. 2020 Oct;586(7827):108-112.
doi: 10.1038/s41586-020-2604-2. Epub 2020 Jul 30.

Microbiota-derived metabolite promotes HDAC3 activity in the gut

Affiliations

Microbiota-derived metabolite promotes HDAC3 activity in the gut

Shu-En Wu et al. Nature. 2020 Oct.

Abstract

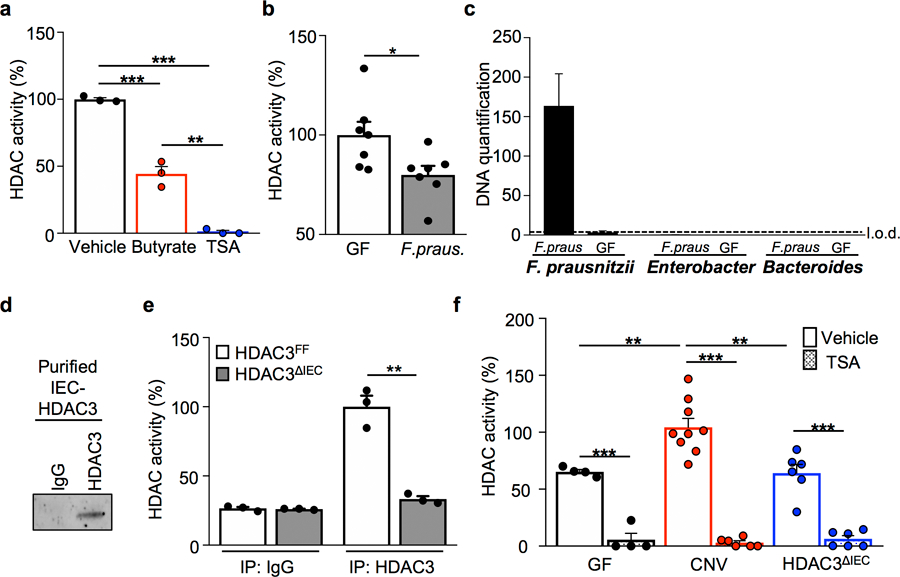
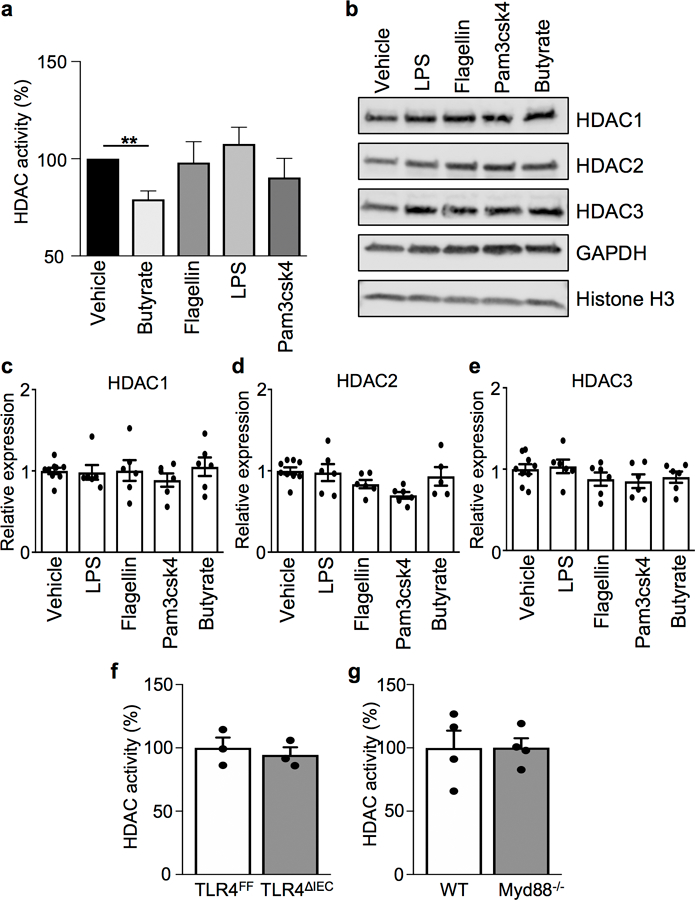
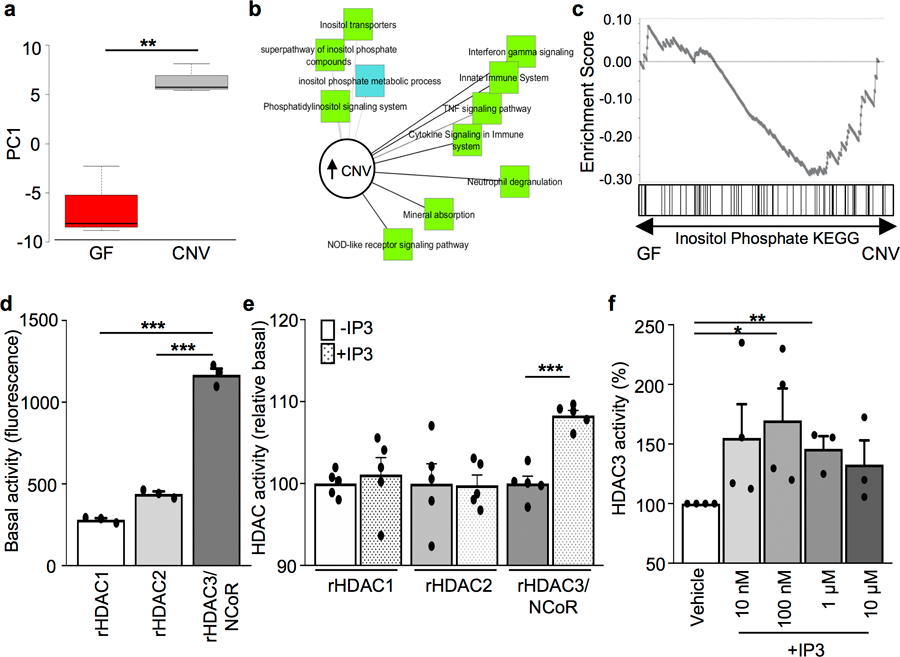
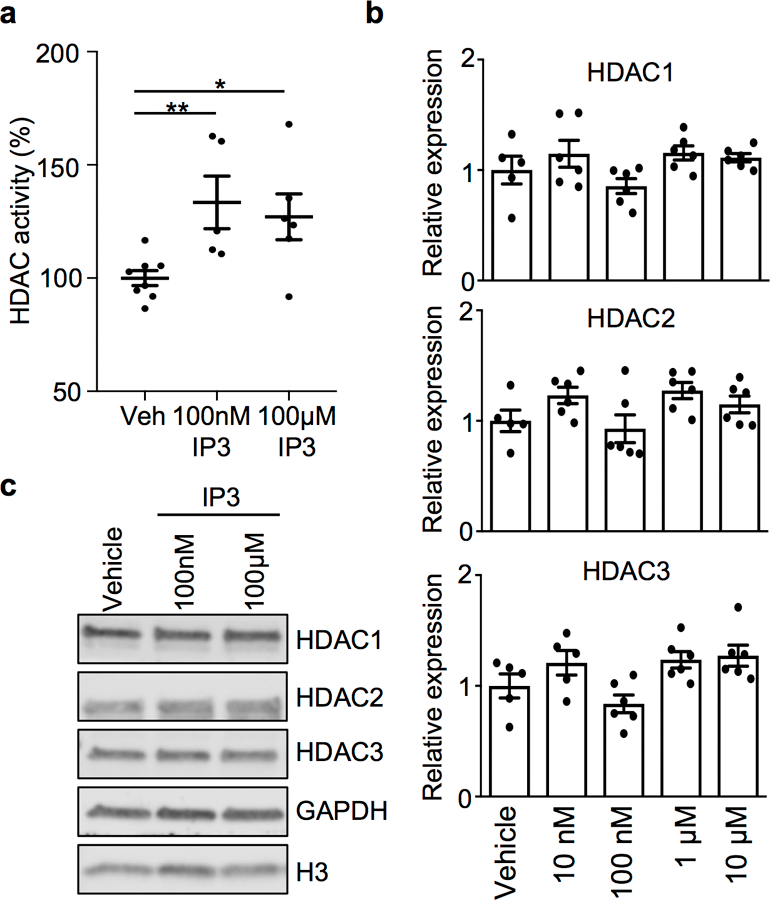
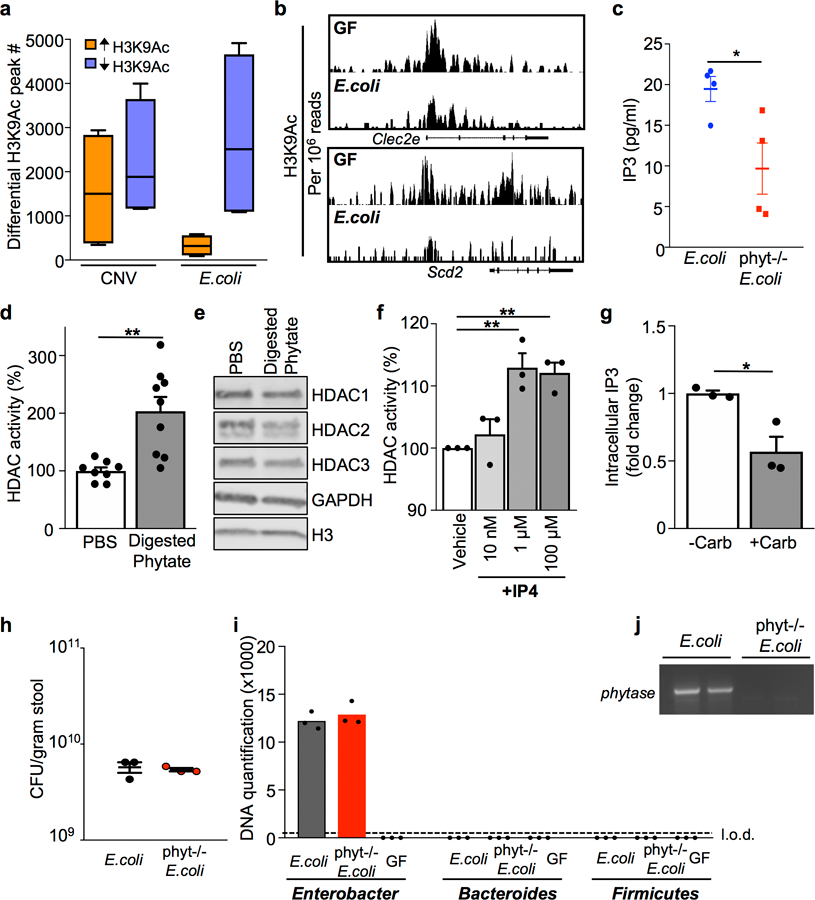
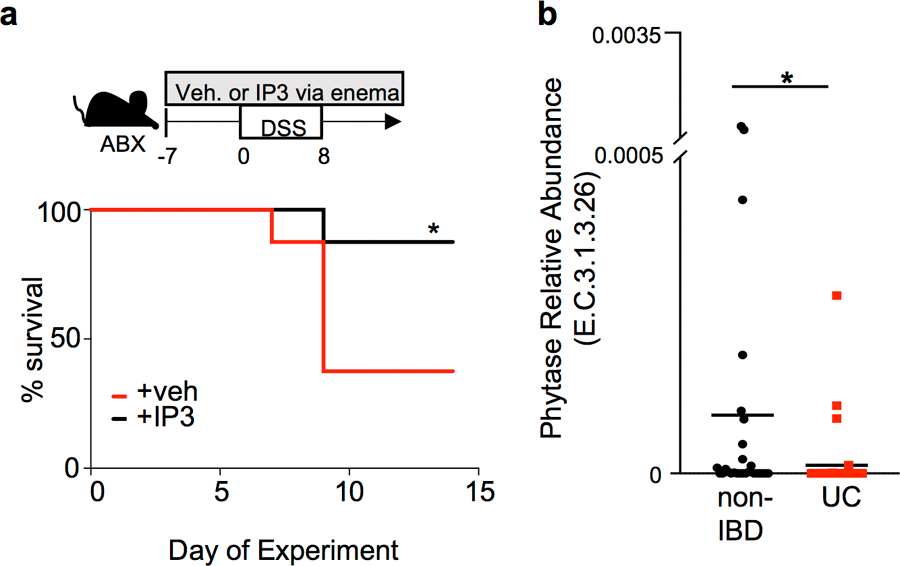
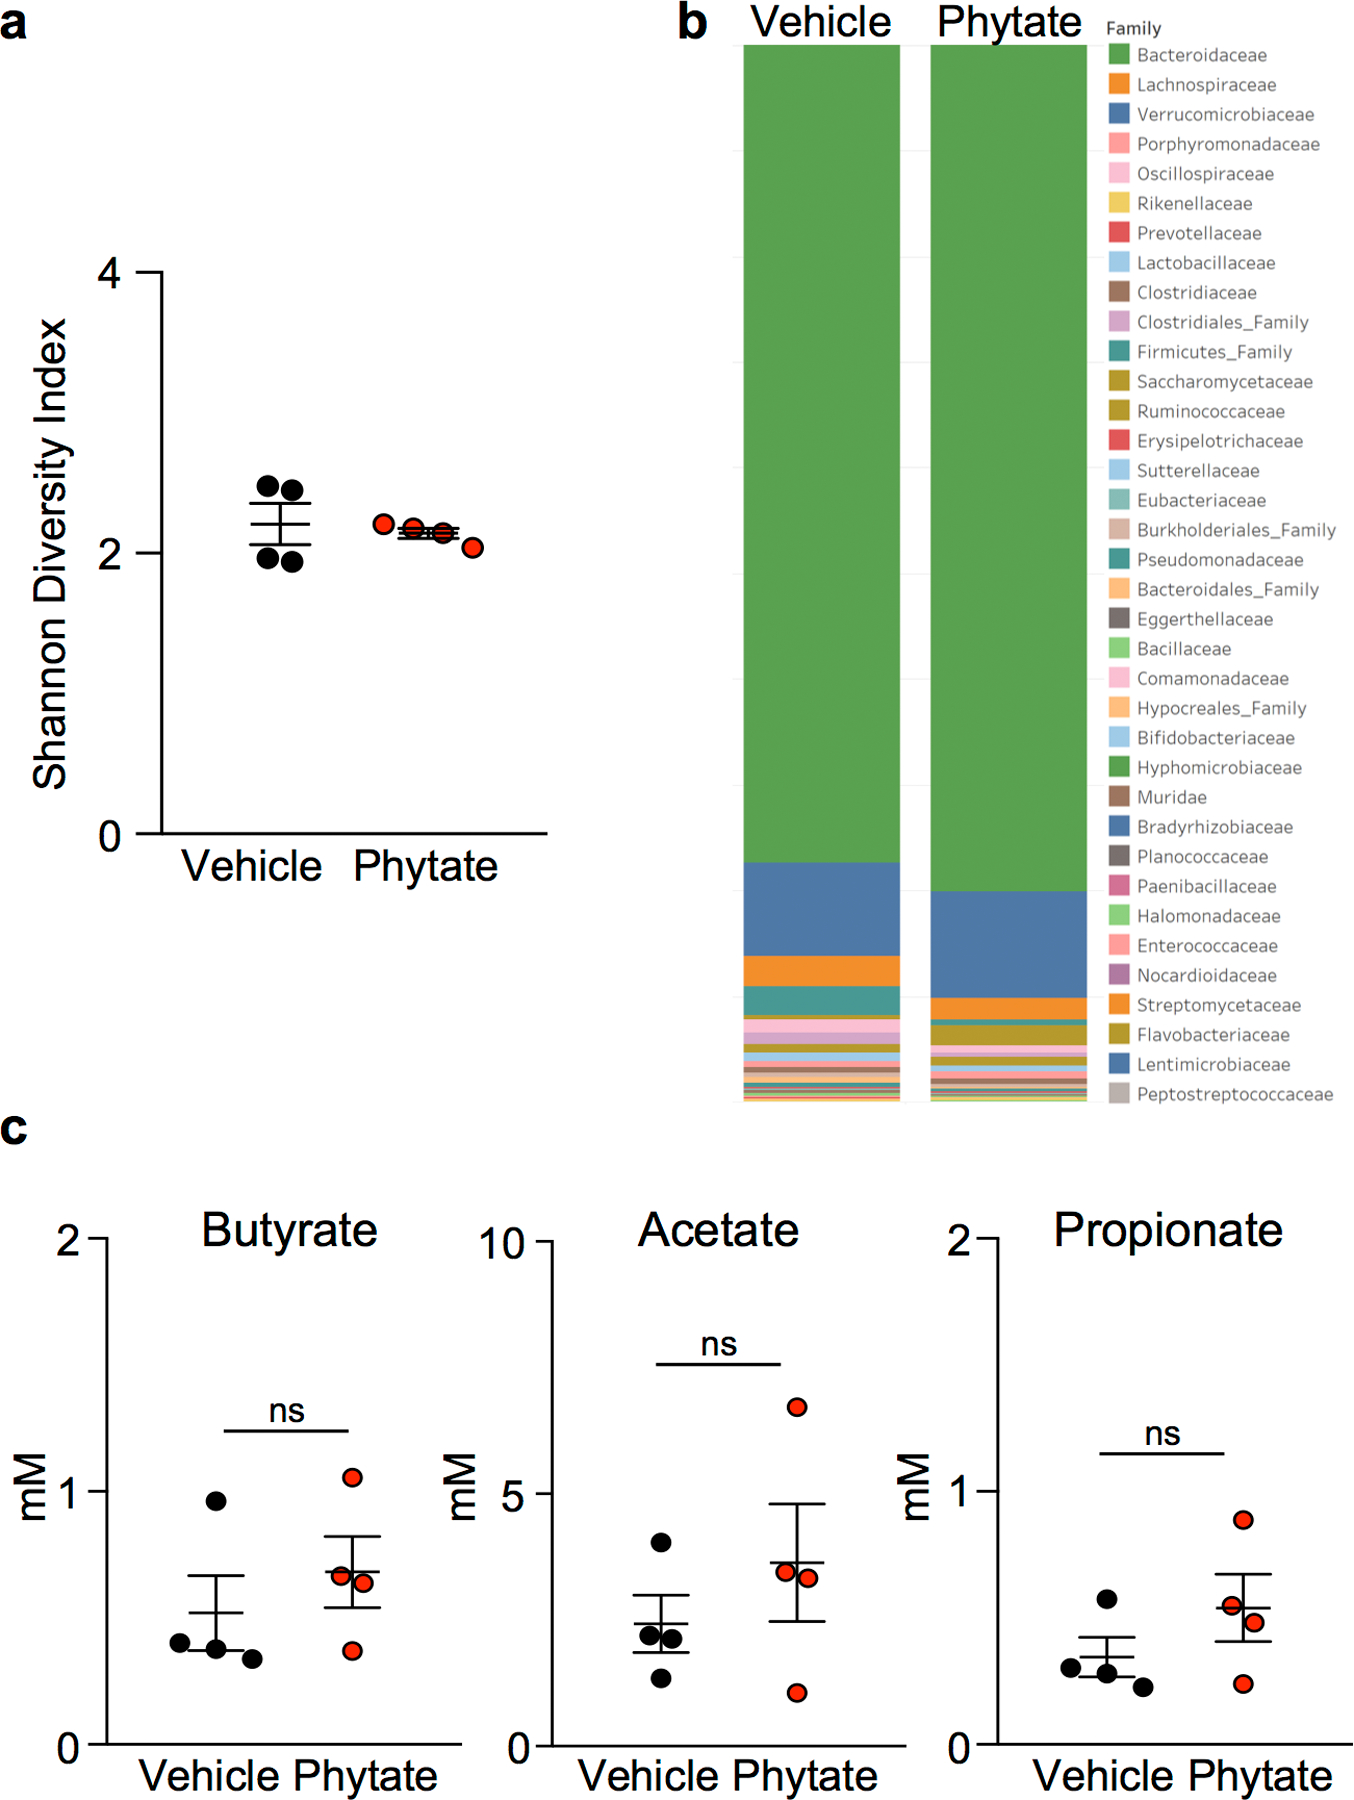
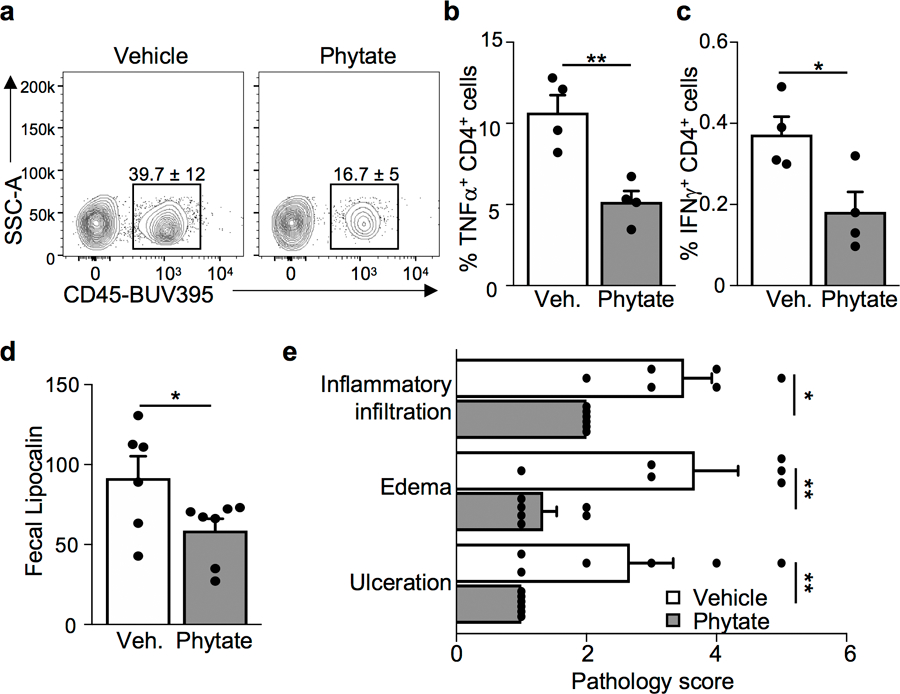
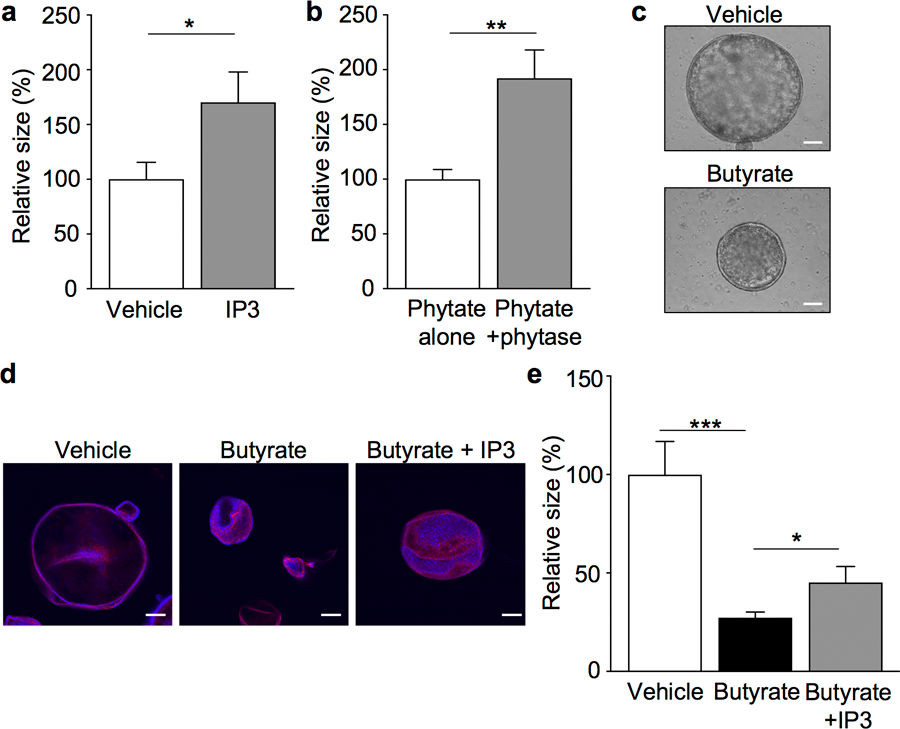
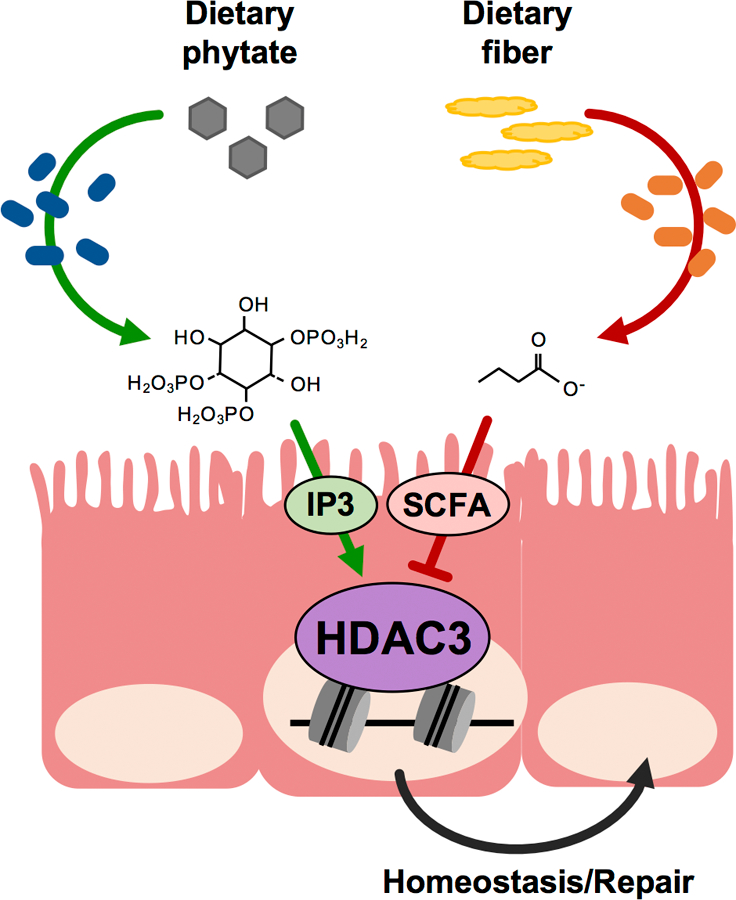
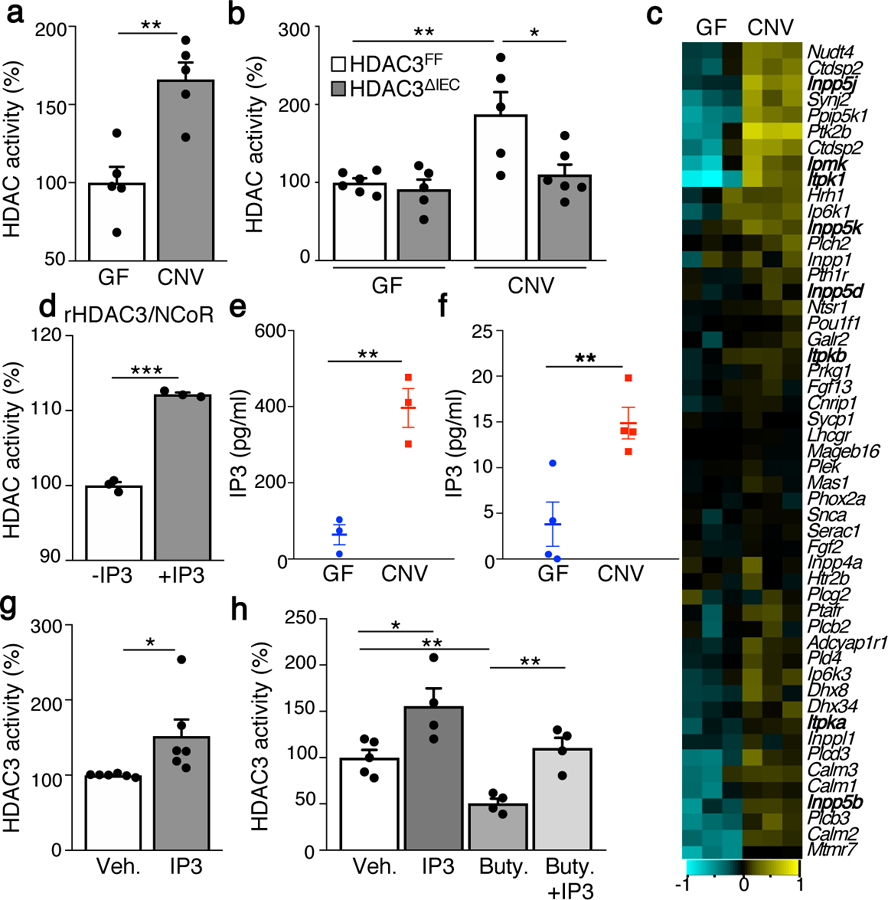
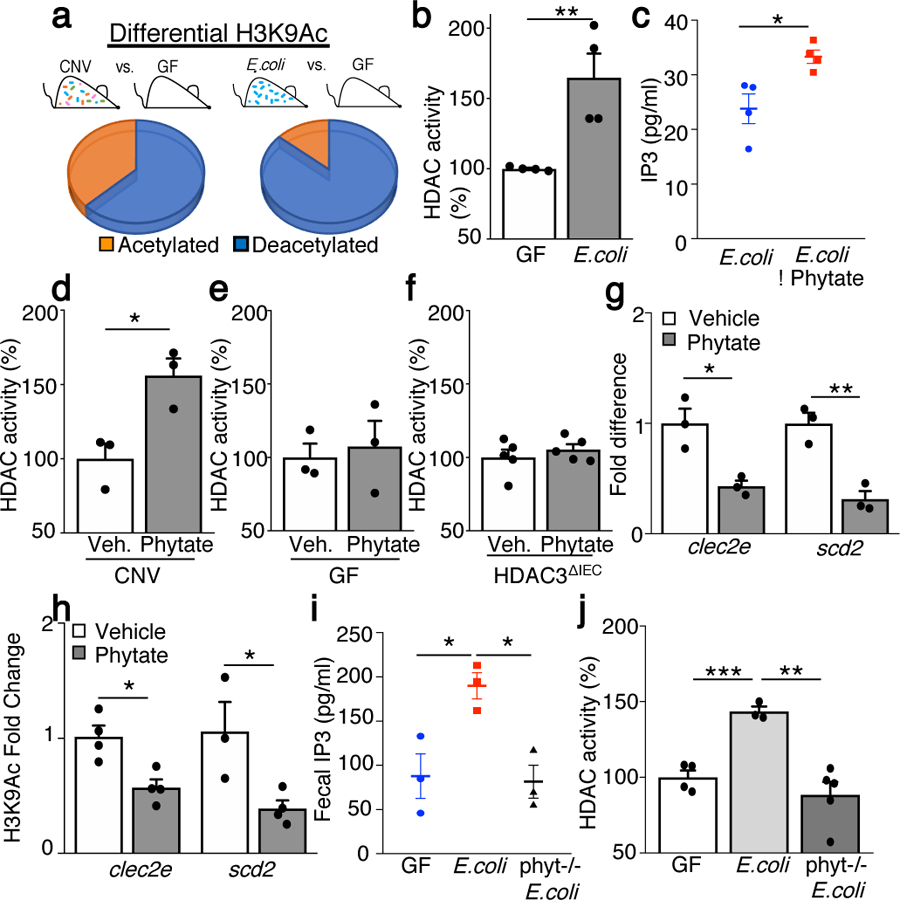
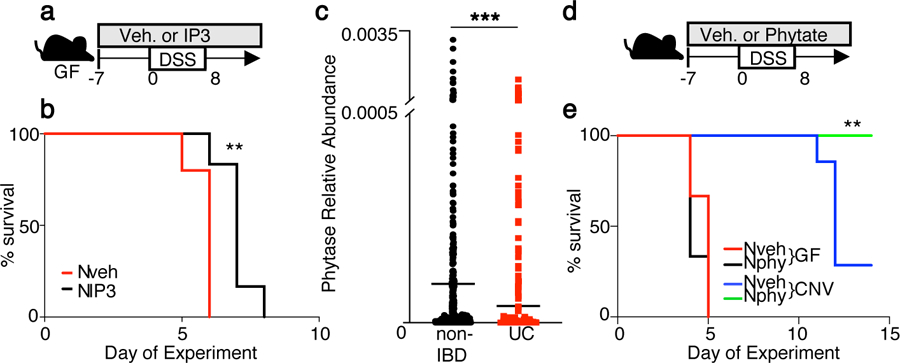
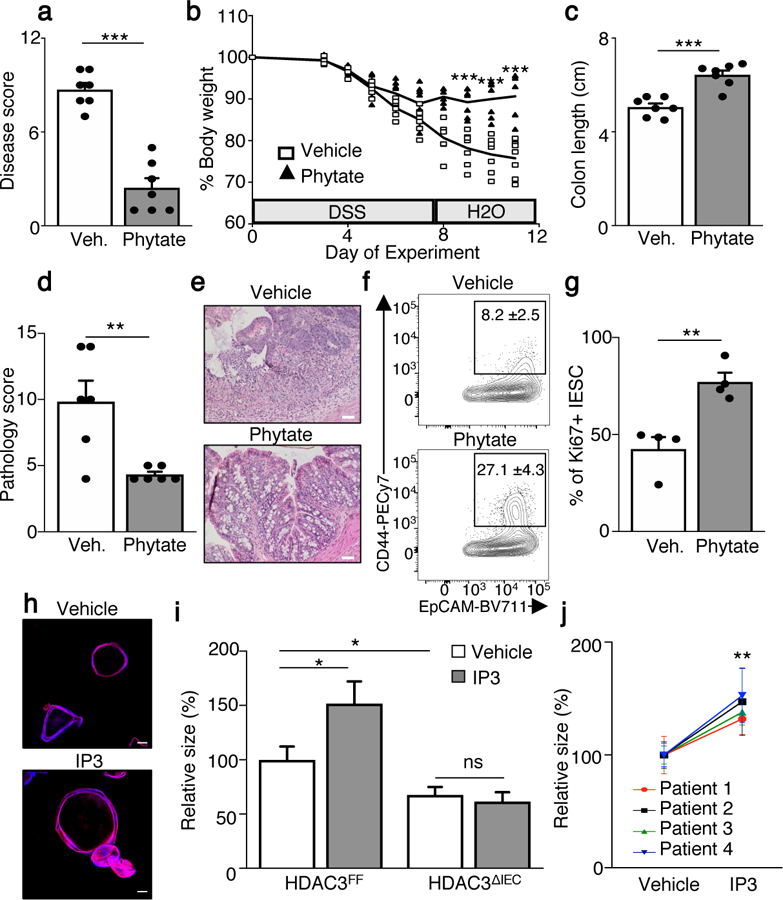
The coevolution of mammalian hosts and their beneficial commensal microbes has led to development of symbiotic host-microbiota relationships1. Epigenetic machinery permits mammalian cells to integrate environmental signals2; however, how these pathways are fine-tuned by diverse cues from commensal bacteria is not well understood. Here we reveal a highly selective pathway through which microbiota-derived inositol phosphate regulates histone deacetylase 3 (HDAC3) activity in the intestine. Despite the abundant presence of HDAC inhibitors such as butyrate in the intestine, we found that HDAC3 activity was sharply increased in intestinal epithelial cells of microbiota-replete mice compared with germ-free mice. This divergence was reconciled by the finding that commensal bacteria, including Escherichia coli, stimulated HDAC activity through metabolism of phytate and production of inositol-1,4,5-trisphosphate (InsP3). Both intestinal exposure to InsP3 and phytate ingestion promoted recovery following intestinal damage. Of note, InsP3 also induced growth of intestinal organoids derived from human tissue, stimulated HDAC3-dependent proliferation and countered butyrate inhibition of colonic growth. Collectively, these results show that InsP3 is a microbiota-derived metabolite that activates a mammalian histone deacetylase to promote epithelial repair. Thus, HDAC3 represents a convergent epigenetic sensor of distinct metabolites that calibrates host responses to diverse microbial signals.


Conflict of interest statement

Competing interests

The authors declare no competing interests.

Figures

Extended Data Figure 1.
Extended Data Figure 1.. Butyrate inhibits epithelial HDAC activity in the intestine.
(a) IEC HDAC activity of large intestine explant treated with vehicle (n=3), 10 mM butyrate (n=3), or 10 mM trichostatin A (TSA; n=3) for 3 hours. ***p=4.16E-07 (Vehicle vs TSA), ***p=0.0006 (Vehicle vs Butyrate), **p=0.0015 (Butyrate vs TSA). (b) IEC HDAC activity of GF mice (n=7) and mice mono-associated with F. prausnitzii (butyrate-producing bacteria) (n=7). *p=0.028. (c) Bacterial-specific qPCR of feces for F. prausnitzii, Enterobacteriaceae, and Bacteroides (n=3/group). (d) Western blot of immunoprecipitated HDAC3 from IECs. For gel source data, see Supplementary Fig. 1. (e) HDAC activity of immunoprecipitated (IP) HDAC3 from HDAC3FF (n=3) and HDAC3ΔIEC (n=3) intestinal epithelium. **p=0.001. (f) HDAC activity of IECs from GF (n=4), CNV (Vehicle n=9, TSA n=6), and HDAC3∆IEC mice (n=6) −/+ 10 μM TSA. ***p=5.77E-05 (GF Vehicle vs TSA), ***p=1.12E-07 (CNV Vehicle vs TSA), ***p=3.49E-05 ( HDAC3∆IEC Vehicle vs TSA), **p= 0.008 (Vehicle GF vs CNV), **p= 0.004 (Vehicle CNV vs HDAC3∆IEC). All graphs are mean of biologic replicates ± s.e.m.; unpaired two-tailed t test. Data were independently repeated three (a-c) or two (d-f) times with similar results. *p ≤ 0.05, **p ≤ 0.01, ***p ≤ 0.001
Extended Data Figure 2.
Extended Data Figure 2.. HDAC activity and expression in IECs lack sensitivity to multiple bacterial stimuli.
(a) HDAC activity of mouse colonoid lysate treated with 1 μg/ml vehicle, butyrate, flagellin, LPS, or Pam3csk4. n=6/treatment. **p=0.0008. (b) Western blot and (c-e) qPCR analyses of HDAC1, HDAC2, and HDAC3 in colonoids following treatment with vehicle (n=9), butyrate (n=6), flagellin (n=6), LPS (n=6), or Pam3csk4 (n=6); all at 1 μg/ml for 5 hours. For gel source data, see Supplementary Fig. 1. (f, g) HDAC activity in IECs harvested from (f) floxed TLR4FF and IEC-specific toll-like receptor 4 knockout (TLR4ΔIEC) mice (n=3/genotype) or (g) wildtype and Myd88 knockout (Myd88−/−) mice (n=4/genotype). All graphs are mean of biologic replicates ± s.e.m.; unpaired two-tailed t test. Data were independently repeated four (a) or two (b-g) times with similar results. **p ≤ 0.01.
Extended Data Figure 3.
Extended Data Figure 3.. Inositol phosphate-sensitive pathways are upregulated in microbiota-replete mice and IP3 induces enhanced HDAC3 activity.
(a) Principle component analysis of gene expression of inositol phosphate-sensitive pathways in IECs from GF (n=3) and CNV (n=3) mice. **p=0.0046. (b) Pathway analysis showing upregulated signaling pathways in IECs from (a). (c) Gene set enrichment analysis (GSEA) comparing IECs from (a) to published data enrichment sets obtained from KEGG. *p=0.05 (d) Basal activity (fluorescence units) of 10 nM recombinant HDAC1, HDAC2, and HDAC3/NCoR-deacetylase activation domain (n=3/group). ***p=2.19E-05 (vs. HDAC1), ***p=5.48E-05 (vs. HDAC2). (e) HDAC activity normalized to recombinant basal levels following incubation with vehicle or 1μM IP3. n= 5/treatment. ***p= 6.61E-05. (f) HDAC activity of immunoprecipitated HDAC3 from primary IECs incubated with increasing IP3 doses. n=4 (Vehicle, 10nM, 100nM), n=3 (1μM, 10μM), *p= 0.040, **p= 0.003. Data in all graphs are mean ± s.e.m.; unpaired two-tailed t test. Data in d-f were independently repeated three times with similar results. *p ≤ 0.05, **p ≤ 0.01, ***p ≤ 0.001.
Extended Data Figure 4.
Extended Data Figure 4.. Inositol phosphate induces HDAC enzymatic activity without altering expression in IECs.
(a) HDAC activity in mouse colonoids following incubation with increasing doses of IP3 for 5 hours (Vehicle: n=8; 100nM IP3: n=5, *p=0.0062; 100μM IP3: n=6, *p=0.0147). (b) mRNA expression of HDAC1, HDAC2 and HDAC3 in mouse colonoids following incubation with IP3 for 5 hours at indicated dose (Vehicle: n=5; IP3: n=6/dose). (c) Western blot of HDAC1, HDAC2 and HDAC3 in colonoids from (a). For gel source data, see Supplementary Fig. 1. All graphs are mean of biologic replicates ± s.e.m.; unpaired two-tailed t test. Data were independently repeated three times with similar results. *p ≤ 0.05, **p ≤ 0.01.
Extended Data Figure 5.
Extended Data Figure 5.. Phytate digestion promotes HDAC activity in IECs.
(a) Number of peaks identified by ChIP-sequencing with significantly increased or decreased H3K9Ac enrichment in IECs, relative to IECs harvested from GF mice. n=2/group; Min to max plots for each comparison (4 per bar); line at median. (b) ChIP-seq for H3K9Ac at HDAC3 target genes in primary IECs isolated from GF and E. coli mono-associated mice. Peaks are normalized to reads per million mapped reads. (c) IP3 levels in 1010 colony forming units (CFU)/ml cultures of phytase−/− E. coli (n=4) versus wildtype E. coli (n=4) *p= 0.0314. (d) HDAC activity of mouse colonoids treated with PBS (n=8) or phytase-digested phytate (1mg/ml) (n=9) for 5 hours.**p= 0.0016. (e) Western blot detection of HDACs in mouse colonoid lysate. For gel source data, see Supplementary Fig. 1. (f) HDAC activity with inositol-1,4,5,6-tetrakisphosphate (IP4) doses as indicated. n=3/group. **p=0.0052 (1μM), **p=0.0018 (100μM). (g) Relative intracellular IP3 levels of colonoids treated with phytase-digested phytate (1mg/ml) −/+ 40 μM carbenoxolone. n=3/treatment. *p=0.0189. (h) CFU measured in stool collected from mice mono-associated with E. coli or phytase−/− E. coli. n=3/group. (i) Bacterial-specific qPCR of feces for Enterobacteriaceae, Bacteroides, and Firmicutes. n=3/group. (j) PCR of E. coli phytase gene (appA1) in stool from mono-associated mice in (h, i). All graphs, except (a), are mean of biologic replicates ± s.e.m.; unpaired two-tailed t test. Data were independently repeated two (e, f) or three (c, d, g-j) times with similar results. *p ≤ 0.05, **p ≤ 0.01.
Extended Data Figure 6.
Extended Data Figure 6.. Microbiota-dependent breakdown of dietary phytate improves recovery from intestinal damage.
(a) Percent survival of antibiotic-treated mice exposed to 2.5% DSS while receiving vehicle (n=8) or 10 μM IP3 (n=8) via rectal enema as depicted in diagram. *p=0.0423 Mantel-Cox test; independently repeated two times. (b) Abundance of bacterial phytase (E.C.3.1.3.26) DNA sequence in last stool sample collected from non-IBD (n=27) and ulcerative colitis (UC) (n=38) patients in Human Microbiome Project. *p=0.036; unpaired two-tailed t test. *p ≤ 0.05.
Extended Data Figure 7.
Extended Data Figure 7.. Microbiota and SCFA composition are not altered in phytate-sensitive DSS protection.
(a) Shannon diversity index (n=4/group) and (b) comparison of bacterial communities in stool collected from DSS-treated mice −/+ 2% phytate (n=4/group). (c) Nuclear magnetic resonance identification of short chain fatty acids in intestinal contents from vehicle- and 2% phytate-treated DSS mice, n = 4/group. Graphs (a, c) are mean ± s.e.m.; ns, not significant.
Extended Data Figure 8.
Extended Data Figure 8.. Phytate decreases pathology caused by intestinal epithelial damage.
(a) Frequency of CD45+ intraepithelial leukocytes assessed by flow cytometry (gated on live cells). n=4/group. *p=0.0107. (b, c) Frequency of (b) TNFα and (c) IFNγ producing CD4+ lamina propria leukocytes from vehicle- and 2% phytate-treated mice during DSS-induced colitis (gated on live, CD45+ CD4+). n=4/group. **p=0.0048 (b), *p=0.0277 (c). (d) Relative fecal lipocalin levels measured by ELISA in vehicle (n=6) or phytate treated (n=7) mice *p=0.0484. (e) Histologic scoring parameters for figure 4d. Scores reflect severity of the DSS-induced histologic parameters: inflammatory infiltration (1–5), edema (1–5), and ulceration on a scale ranging from 1 to 5 with 5 being most severe. n=6/group [inflammatory infiltration: *p=0.0314; edema: **p=0.0075; ulceration: **p=0.0057]. Graphs are mean of biologic replicates ± s.e.m; unpaired two-tailed t test. Data were independently repeated three times with similar results. *p ≤ 0.05, **p ≤ 0.01.
Extended Data Figure 9.
Extended Data Figure 9.. Inositol trisphosphate counters butyrate-induced inhibition of colonoid growth.
(a, b) Growth of colonoids generated from GF mice and treated with (a) vehicle or IP3 (10nM; n=60 colonoids/treatment; *p=0.029) or (b) phytate vs. phytase-digested phytate (0.2mg/ml; n=40 colonoids/treatment; **p=0.0012). (c) Representative images of GF colonoids treated with vehicle or 1mM butyrate, scale bars, 100 µm. (d, e) (d) Representative images (red: phalloidin, blue: DAPI), scale bars, 100µm and (e) growth of colonoids from GF mice treated with vehicle, 5mM butyrate, or 5mM butyrate + 50nM IP3; n=30 colonoids/treatment; *p=0.0409, ***p=0.0001). All graphs are mean of biologic replicates ± s.e.m.; unpaired two-tailed t test. Data were independently repeated two (b) or four (a, c-e) times with similar results. *p ≤ 0.05, **p ≤ 0.01, ***p ≤ 0.001.
Extended Data Figure 10.
Extended Data Figure 10.. Epithelial HDAC3 functions as an intestinal sensor of distinct microbiota-derived metabolites.
Microbiota can generate inhibitory (SCFA) and activating (IP3) signals through metabolism of dietary fibers and phytate, respectively. Epithelial HDAC3 functions as a central hub for these opposing signals, and likely additional factors, to modulate enzymatic activity and intestinal epithelial homeostasis/repair. Therefore, HDAC3 represents an epigenetic-modifying enzyme that can calibrate intestinal dynamics in response to alterations in diet and/or microbiota.
Figure 1.
Figure 1.. Microbiota calibrate epithelial HDAC3 activity by regulating inositol phosphate.
(a) Intestinal epithelial HDAC activity of germ-free (GF) (n=5) and conventionally-housed (CNV) (n=5) mice. Values are relative to GF. **p=0.0021. (b) HDAC activity in IECs from GF-HDAC3FF (n=6), GF-HDAC3∆IEC (n=5), CNV-HDAC3FF(n=5) and CNV-HDAC3∆IEC (n=6) mice. **p=0.0089, *p=0.0271. (c) Hierarchical clustering of expression (log2-transformed transcripts per million) of all genes within inositol phosphate metabolism KEGG pathway in large intestinal IECs from GF (n=3) and CNV (n=3) mice. (d) HDAC activity of recombinant HDAC3-NCoR-deacetylase activation domain protein −/+1μM IP3 (n=3/treatment). ***p=2E-05. (e, f) Relative IP3 levels by competitive ELISA in (e) fecal homogenate (n=3/group; **p=0.004) and (f) IEC lysate (n=4/group; **p=0.0098). (g) HDAC activity of immunoprecipitated HDAC3 from primary IECs incubated with vehicle (n=6) or 1μM IP3 (n=6). *p=0.038. (h) HDAC activity of immunoprecipitated HDAC3 incubated with vehicle (n=5), 1μM IP3 (n=4), 100μM butyrate (n=4), or 100μM butyrate + 1μM IP3 (n=4). *p=0.0239 (Veh. vs IP3), **p=0.0023 (Veh. vs Buty.) **p=0.0027 (Buty. vs Buty.+IP3). Bars in all graphs are mean of biologic replicates ± s.e.m.; unpaired two-tailed t test. Data in a, b, d-h were independently repeated three times with similar results. *p ≤ 0.05, **p ≤ 0.01, ***p ≤ 0.001.
Figure 2.
Figure 2.. Phytate metabolism by commensal bacteria induces HDAC activity in IECs.
(a) Percentage of sites by ChIP-sequencing with differential histone 3 lysine 9 acetylation (H3K9Ac) [acetylated: increased H3K9Ac; deacetylated: decreased H3K9Ac] in IECs from CNV (n=2) or E. coli mono-associated (n=2) vs. GF mice (n=2). (b) IEC-HDAC activity of GF (n=4) and E. coli mice (n=4). **p=0.009. (c) IP3 measured by ELISA in E. coli in vitro culture (−/+ 1mM phytate) (n=4/group). *p=0.019. (d, e, f) HDAC activity in IECs from large intestine explant from (d) CNV (n=3/treatment), *p= 0.022, (e) GF (n=3/treatment), or (f) HDAC3ΔIEC (n=5/treatment) mice (−/+ 1mM phytate). (g, h) (g) mRNA expression (n=3/group); *p= 0.016 (clec2e), **p=0.005 (scd2) and (h) H3K9Ac ChIP-qPCR at clec2e (vehicle (n=4), phytate (n=4); *p=0.011 and scd2 (vehicle (n=3), phytate (n=4); *p=0.033) in IECs following 2% phytate. (i) Fecal homogenate IP3 for mice mono-associated with wildtype (n=3) or phytase−/− (n=3) E. coli relative to GF (n=3) mice (1mg stool/μl). *p=0.025 (GF vs WT) *p=0.011 (WT vs phytase−/−). (j) HDAC activity in IECs from phytate-treated mice with wildtype (n=3) or phytase−/− (n=5) E. coli relative to GF (n=4). ***p= 0.0008, **p=0.0031. All graphs are mean of biologic replicates ± s.e.m.; unpaired two-tailed t test. Data were independently repeated three (b-e) or two (f-j) times with similar results. *p ≤ 0.05, **p ≤ 0.01, ***p ≤ 0.001.
Figure 3.
Figure 3.. Microbiota-dependent breakdown of phytate improves recovery from intestinal damage.
(a) Experimental approach. (b) Percent survival of GF mice on 2.5% DSS while receiving water (n= 5) or 10μM IP3 (n=6) via enema as in (a). **p=0.0078 Mantel-Cox test; independently repeated two times. (c) Abundance of bacterial phytase (E.C.3.1.3.26) DNA sequence in non-IBD (n=429) and ulcerative colitis (UC) (n=459) stool samples from Human Microbiome Project. ***p=0.0006; unpaired two-tailed t test. (d) Experimental approach. (e) Percent survival of GF (n= 3/treatment) and CNV (n=7/treatment) mice treated with vehicle or 2% phytate during DSS as in (d). **p=0.0078 (CNV vehicle vs phytate) Mantel-Cox test; independently repeated three times. **p ≤ 0.01, ***p ≤ 0.001.
Figure 4.
Figure 4.. Inositol phosphate promotes HDAC3-dependent colonic growth.
(a) Disease score of vehicle (n=7) or phytate (n=7) treated mice day 4 after DSS removal. ***p=2.1E-06. (b) Body weight percentage of DSS mice treated. n=7/group. ***p=1.08E-04 (day 9), ***p=9.05E-05 (day 10), ***p=1.05E-04 (day 11). (c) Colon length on day 4 after DSS removal. n=7/group. ***p=9.6E-05. (d) Pathology score. n=6/group. **p=0.007. (e) H&E stained large intestine, scale bars, 50 µm. (f) CD44+ intestinal epithelial stem cell (IESC), gated on CD45, EpCAM+, CD24low. n=4/treatment. **p=0.009. (g) Percentage of Ki67+ IESCs. IESCs are CD45, EpCAM+, CD24med/lo, CD166, and CD44hi. n=4/treatment. **p=0.0042. For gating, see Supplementary Fig. 2. Graphs (a-g) are mean of biologic replicates ± s.e.m.; unpaired two-tailed t test. Animal studies were independently repeated four (a-c) or three (d-g) times with similar results. (h) Confocal of organoids grown from colonic crypts (colonoids) of GF mice treated with vehicle or 10nM IP3 (red: phalloidin, blue: DAPI), scale bars, 100 µm. (i) Growth of colonoids from control (HDAC3FF) or HDAC3ΔIEC mice (−/+ 10nM IP3). n=50 colonoids/treatment for each genotype. Data are relative to vehicle-treated HDAC3FF. *p=0.0335 (HDAC3FF Vehicle vs IP3), *p=0.0249 (HDAC3FF vs HDAC3∆IEC); unpaired two-tailed t test. Murine colonoid studies (h, i) were independently repeated three times. (j) Growth of human colonoids derived from 4 different patients and treated with vehicle or 10μM IP3. Data are relative to vehicle colonoids from the same patient. n=30 colonoids/treatment for each patient. **p= 0.0012; 2-way ANOVA. All graphs are mean ± s.e.m. *p ≤ 0.05, **p ≤ 0.01, ***p ≤ 0.001. ns, not significant.

Comment in

References

    1. Honda K & Littman DR The Microbiome in Infectious Disease and Inflammation. Annu Rev Immunol, doi: 10.1146/annurev-immunol-020711-074937 (2011). - DOI - PMC - PubMed
    1. Feil R & Fraga MF Epigenetics and the environment: emerging patterns and implications. Nat Rev Genet 13, 97–109, doi: 10.1038/nrg3142 (2011). - DOI - PubMed
    1. Peterson LW & Artis D Intestinal epithelial cells: regulators of barrier function and immune homeostasis. Nat Rev Immunol 14, 141–153, doi: 10.1038/nri3608 (2014). - DOI - PubMed
    1. Kim TH et al. Broadly permissive intestinal chromatin underlies lateral inhibition and cell plasticity. Nature 506, 511–515, doi: 10.1038/nature12903 (2014). - DOI - PMC - PubMed
    1. Elliott EN, Sheaffer KL, Schug J, Stappenbeck TS & Kaestner KH Dnmt1 is essential to maintain progenitors in the perinatal intestinal epithelium. Development 142, 2163–2172, doi: 10.1242/dev.117341 (2015). - DOI - PMC - PubMed

REFERENCES (METHODS)

    1. Whitt J et al. Disruption of Epithelial HDAC3 in Intestine Prevents Diet-Induced Obesity in Mice. Gastroenterology 155, 501–513, doi: 10.1053/j.gastro.2018.04.017 (2018). - DOI - PMC - PubMed
    1. Madison BB et al. Cis elements of the villin gene control expression in restricted domains of the vertical (crypt) and horizontal (duodenum, cecum) axes of the intestine. J Biol Chem 277, 33275–33283, doi: 10.1074/jbc.M204935200 (2002). - DOI - PubMed
    1. McAlees JW et al. Distinct Tlr4-expressing cell compartments control neutrophilic and eosinophilic airway inflammation. Mucosal Immunol 8, 863–873, doi: 10.1038/mi.2014.117 (2015). - DOI - PMC - PubMed
    1. Schnare M et al. Toll-like receptors control activation of adaptive immune responses. Nat Immunol 2, 947–950, doi: 10.1038/ni712 (2001). - DOI - PubMed
    1. Vetizou M et al. Anticancer immunotherapy by CTLA-4 blockade relies on the gut microbiota. Science 350, 1079–1084, doi: 10.1126/science.aad1329 (2015). - DOI - PMC - PubMed

Publication types

MeSH terms