. 2020 Oct;586(7830):583-588.
doi: 10.1038/s41586-020-2607-z. Epub 2020 Jul 30.

Single-shot Ad26 vaccine protects against SARS-CoV-2 in rhesus macaques

Noe B Mercado #  1 Roland Zahn #  2 Frank Wegmann #  2 Carolin Loos #  3   4 Abishek Chandrashekar #  1 Jingyou Yu #  1 Jinyan Liu #  1 Lauren Peter #  1 Katherine McMahan #  1 Lisa H Tostanoski #  1 Xuan He #  1 David R Martinez #  5 Lucy Rutten  2 Rinke Bos  2 Danielle van Manen  2 Jort Vellinga  2 Jerome Custers  2 Johannes P Langedijk  2 Ted Kwaks  2 Mark J G Bakkers  2 David Zuijdgeest  2 Sietske K Rosendahl Huber  2 Caroline Atyeo  3   6 Stephanie Fischinger  3   6 John S Burke  3 Jared Feldman  3   6 Blake M Hauser  3   6 Timothy M Caradonna  3   6 Esther A Bondzie  1 Gabriel Dagotto  1   6 Makda S Gebre  1   6 Emily Hoffman  1 Catherine Jacob-Dolan  1   6 Marinela Kirilova  1 Zhenfeng Li  1 Zijin Lin  1 Shant H Mahrokhian  1 Lori F Maxfield  1 Felix Nampanya  1 Ramya Nityanandam  1 Joseph P Nkolola  1 Shivani Patel  1 John D Ventura  1 Kaylee Verrington  1 Huahua Wan  1 Laurent Pessaint  7 Alex Van Ry  7 Kelvin Blade  7 Amanda Strasbaugh  7 Mehtap Cabus  7 Renita Brown  7 Anthony Cook  7 Serge Zouantchangadou  7 Elyse Teow  7 Hanne Andersen  7 Mark G Lewis  7 Yongfei Cai  8 Bing Chen  8   9 Aaron G Schmidt  3   6   9 R Keith Reeves  1 Ralph S Baric  5 Douglas A Lauffenburger  4 Galit Alter  3   9 Paul Stoffels  2 Mathai Mammen  2 Johan Van Hoof  2 Hanneke Schuitemaker  2 Dan H Barouch  10   11   12   13
Affiliations

Single-shot Ad26 vaccine protects against SARS-CoV-2 in rhesus macaques

Noe B Mercado et al. Nature. 2020 Oct.

Erratum in

  • Publisher Correction: Single-shot Ad26 vaccine protects against SARS-CoV-2 in rhesus macaques.
    Mercado NB, Zahn R, Wegmann F, Loos C, Chandrashekar A, Yu J, Liu J, Peter L, McMahan K, Tostanoski LH, He X, Martinez DR, Rutten L, Bos R, van Manen D, Vellinga J, Custers J, Langedijk JP, Kwaks T, Bakkers MJG, Zuijdgeest D, Huber SKR, Atyeo C, Fischinger S, Burke JS, Feldman J, Hauser BM, Caradonna TM, Bondzie EA, Dagotto G, Gebre MS, Hoffman E, Jacob-Dolan C, Kirilova M, Li Z, Lin Z, Mahrokhian SH, Maxfield LF, Nampanya F, Nityanandam R, Nkolola JP, Patel S, Ventura JD, Verrington K, Wan H, Pessaint L, Van Ry A, Blade K, Strasbaugh A, Cabus M, Brown R, Cook A, Zouantchangadou S, Teow E, Andersen H, Lewis MG, Cai Y, Chen B, Schmidt AG, Reeves RK, Baric RS, Lauffenburger DA, Alter G, Stoffels P, Mammen M, Van Hoof J, Schuitemaker H, Barouch DH. Mercado NB, et al. Nature. 2021 Feb;590(7844):E25. doi: 10.1038/s41586-020-03100-y. Nature. 2021. PMID: 33469218 No abstract available.

Abstract

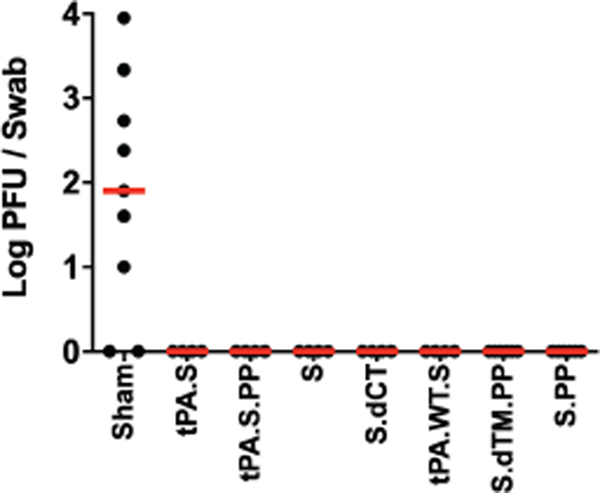
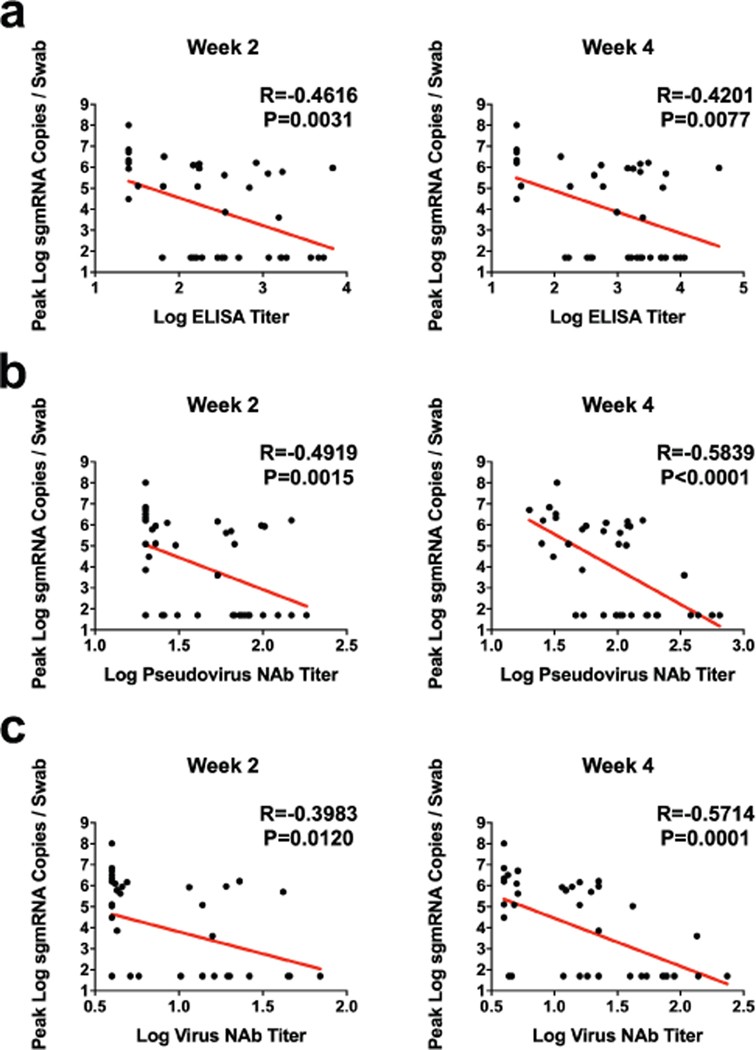
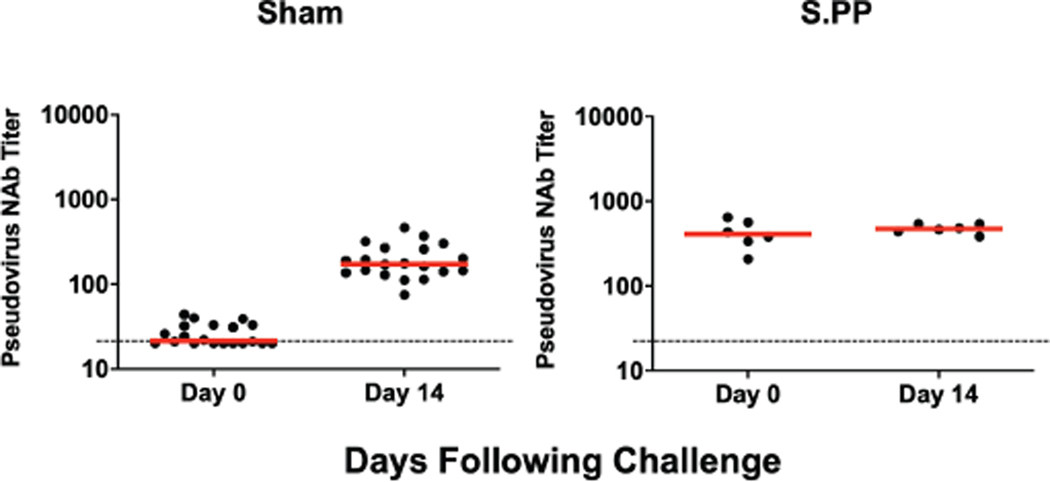
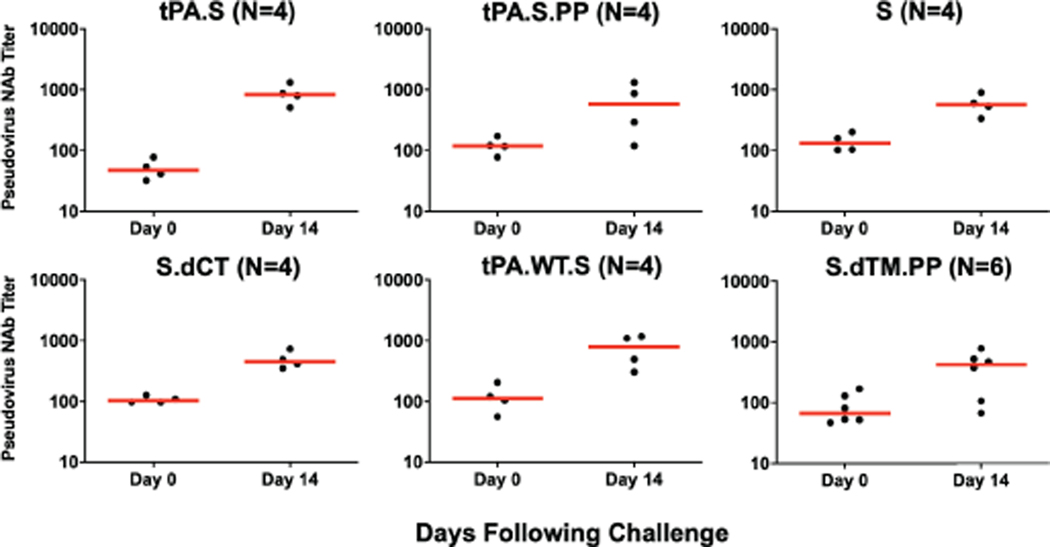
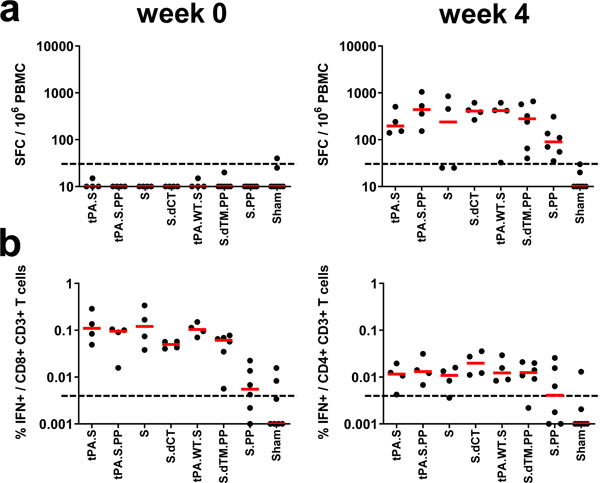
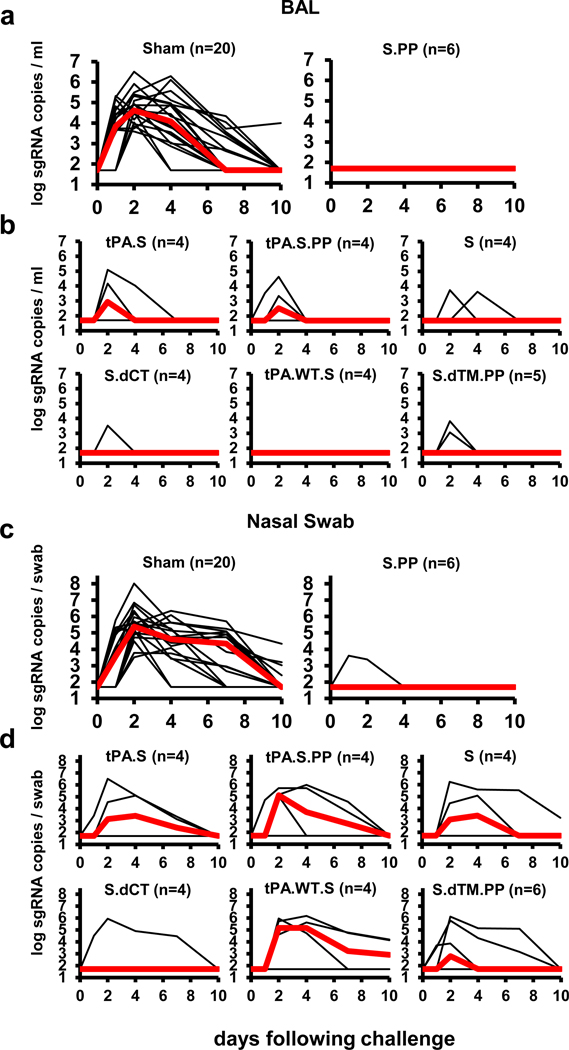
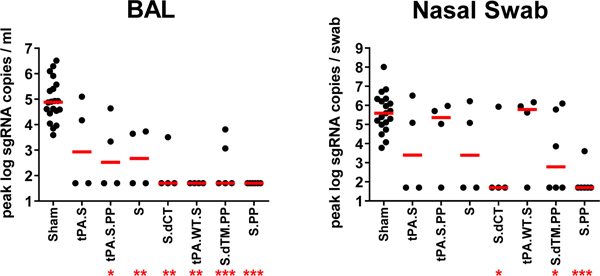
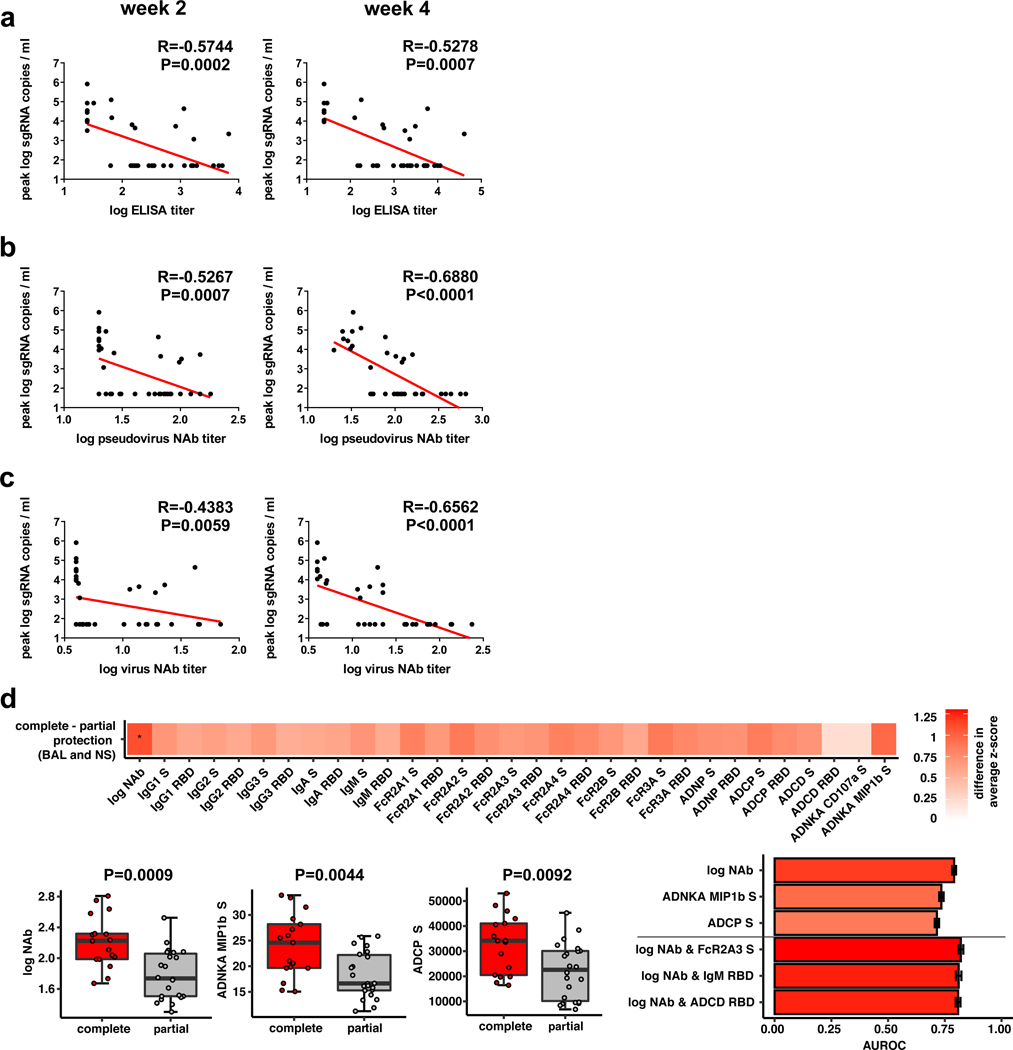
A safe and effective vaccine for severe acute respiratory syndrome coronavirus 2 (SARS-CoV-2) may be required to end the coronavirus disease 2019 (COVID-19) pandemic1-8. For global deployment and pandemic control, a vaccine that requires only a single immunization would be optimal. Here we show the immunogenicity and protective efficacy of a single dose of adenovirus serotype 26 (Ad26) vector-based vaccines expressing the SARS-CoV-2 spike (S) protein in non-human primates. Fifty-two rhesus macaques (Macaca mulatta) were immunized with Ad26 vectors that encoded S variants or sham control, and then challenged with SARS-CoV-2 by the intranasal and intratracheal routes9,10. The optimal Ad26 vaccine induced robust neutralizing antibody responses and provided complete or near-complete protection in bronchoalveolar lavage and nasal swabs after SARS-CoV-2 challenge. Titres of vaccine-elicited neutralizing antibodies correlated with protective efficacy, suggesting an immune correlate of protection. These data demonstrate robust single-shot vaccine protection against SARS-CoV-2 in non-human primates. The optimal Ad26 vector-based vaccine for SARS-CoV-2, termed Ad26.COV2.S, is currently being evaluated in clinical trials.


Figures

Extended Data Figure 1.
Extended Data Figure 1.. Correlation of pseudovirus NAb titers and ELISA or live virus NAb assays in vaccinated macaques.
Red line reflects the best linear fit relationship between these variables. P and R values reflect two-sided Spearman rank-correlation tests. n=38 biologically independent animals.
Extended Data Figure 2.
Extended Data Figure 2.. Peripheral and mucosal humoral immune responses in vaccinated rhesus macaques.
(a) Comparison of pseudovirus NAb in macaques vaccinated with Ad26-S.PP (n=6 biologically independent animals) with previously reported cohorts of convalescent macaques (n=9 biologically independent animals) and convalescent humans (n=27 biologically independent humans) who had recovered from SARS-CoV-2 infection. NHP, nonhuman primate. The upper bound of the box is the 75th and the lower bound the 25th percentile, the horizontal line indicates the median and the whiskers extend from the box bounds to the minimum/maximum value. (b) S-specific IgG and IgA at week 4 in BAL by ELISA in sham controls and in Ad26-S.PP vaccinated animals. Red bars reflect median responses.
Extended Data Figure 3.
Extended Data Figure 3.. Systems serology in vaccinated rhesus macaques.
(a) S- and RBD-specific antibody-dependent neutrophil phagocytosis (ADNP), antibody-dependent monocyte cellular phagocytosis (ADCP), antibody-dependent complement deposition (ADCD), and antibody-dependent NK cell activation (ADNKA) are shown. Red bars reflect median responses. (b) S- and RBD-specific antibody-dependent neutrophil phagocytosis (ADNP), antibody-dependent monocyte cellular phagocytosis (ADCP), antibody-dependent complement deposition (ADCD), and antibody-dependent NK cell activation (ADNKA) at week 4 are shown as radar plots. The size and color intensity of the wedges indicate the median of the feature for the corresponding group (blue depicts antibody functions, red depicts antibody isotype/subclass/FcγR binding). The principal component analysis (PCA) plot shows the multivariate antibody profiles across groups. The PCA analysis reduces the dimension of the data by finding principal components, which are linear combinations of the original antibody features that are uncorrelated and best capture the variance in the data. Here, PC1 explains 74.2% and PC2 explains 8.3% of the variance. Each dot represents an animal, the color of the dot denotes the group, and the ellipses shows the distribution of the groups as 70% confidence levels assuming a multivariate normal distribution.
Extended Data Figure 4.
Extended Data Figure 4.. Cellular immune responses in vaccinated rhesus macaques.
IFN-γ and IL-4 ELISPOT responses in response to pooled S peptides were assessed in a separate cohort of 10 animals that received 1011 vp of the Ad26-S.PP vaccine at week 2 following vaccination. Red bars reflect median responses. Dotted lines reflect assay limit of quantitation.
Extended Data Figure 5.
Extended Data Figure 5.. Infectious virus following challenge.
Infectious virus titers were assessed by plaque-forming unit (PFU) assays in NS on day 2 following challenge in vaccinated animals and additional sham controls.
Extended Data Figure 6.
Extended Data Figure 6.. Correlates of protection in nasal swabs.
Correlations of (a) binding ELISA titers, (b) pseudovirus NAb titers, and (c) live virus NAb titers at week 2 and week 4 with log peak sgRNA copies/swab in NS following challenge. Red lines reflect the best linear fit relationship between these variables. P and R values reflect two-sided Spearman rank-correlation tests. n=52 biologically independent animals.
Extended Data Figure 7.
Extended Data Figure 7.. NAb titers following SARS-CoV-2 challenge.
Pseudovirus NAb titers prior to challenge and on day 14 following challenge in sham controls and in Ad26-S.PP vaccinated animals. Red bars reflect median responses. Dotted lines reflect assay limit of quantitation.
Extended Data Figure 8.
Extended Data Figure 8.. NAb titers following SARS-CoV-2 challenge.
Pseudovirus NAb titers prior to challenge and on day 14 following challenge in vaccinated animals. Red bars reflect median responses. Dotted lines reflect assay limit of quantitation.
Extended Data Figure 9.
Extended Data Figure 9.. Cellular immune responses following SARS-CoV-2 challenge.
IFN-γ+CD8+ and IFN-γ+CD4+ T cell responses by intracellular cytokine staining assays in response to pooled spike (S1, S2), nucleocapsid (NCAP), and non-structural proteins (N6, N7a, N8) peptides on day 14 following challenge in sham controls and in Ad26-S.PP vaccinated animals. Red bars reflect median responses. Dotted lines reflect assay limit of quantitation.
Extended Data Figure 10.
Extended Data Figure 10.. Immunophenotyping of BAL cell subpopulations.
BAL cells from Ad26-S.PP vaccinated and control animals from 2 weeks following immunization and 2 weeks following challenge were assessed by flow cytometry for cellular subpopulations.
Figure 1.
Figure 1.. Construction of Ad26 vectors.
(a) Seven Ad26 vectors were produced expressing SARS-CoV-2 S protein variants: (i) tPA leader sequence with full-length S (tPA.S), (ii) tPA leader sequence with full-length S with mutation of the furin cleavage site and two proline stabilizing mutations (tPA.S.PP), (iii) wildtype leader sequence with native full-length S (S), (iv) wildtype leader sequence with S with deletion of the cytoplasmic tail (S.dCT), (v) tandem tPA and wildtype leader sequences with full-length S as a strategy to enhance expression (tPA.WT.S), (vi) wildtype leader sequence with S with deletion of the transmembrane region and cytoplasmic tail, reflecting the soluble ectodomain, with mutation of the furin cleavage site, proline stabilizing mutations, and a foldon trimerization domain (S.dTM.PP), and (vii) wildtype leader sequence with full-length S with mutation of the furin cleavage site and proline stabilizing mutations (S.PP). Red triangle depicts tPA leader sequence, black triangle depicts wildtype leader sequence, red X depicts furin cleavage site mutation, red vertical lines depict proline mutations, open square depicts foldon trimerization domain. S1 and S2 represent the first and second domain of the S protein, TM depicts the transmembrane region, and CT depicts the cytoplasmic domain. (b) Western blot analyses for expression from Ad26 vaccine vectors encoding tPA.S (lane 2), tPA.S.PP (lane 3), S (lane 4), S.dCT (lane 5), tPA.WT.S (lane 6), S.dTM.PP (lane 7), or S.PP (lane 9) under non-reduced conditions in MRC-5 cell lysates using a human monoclonal antibody (CR3046). This experiment was repeated three times. For gel source data, see Supplementary Figure 1.
Figure 2.
Figure 2.. Humoral immune responses in vaccinated rhesus macaques.
Humoral immune responses were assessed at weeks 0, 2, and 4 by (a) RBD-specific binding antibody ELISA, (b) pseudovirus neutralization assays, and (c) live virus neutralization assays. Red bars reflect median responses. Dotted lines reflect assay limit of quantitation.
Figure 3.
Figure 3.. Cellular immune responses in vaccinated rhesus macaques.
Cellular immune responses were assessed at week 4 following immunization by (a) IFN-γ ELISPOT assays and (b) IFN-γ+CD4+ and IFN-γ+CD8+ T cell intracellular cytokine staining assays in response to pooled S peptides. Red bars reflect median responses. Dotted lines reflect assay limit of quantitation.
Figure 4.
Figure 4.. Viral loads in rhesus macaques following SARS-CoV-2 challenge.
Rhesus macaques were challenged by the intranasal and intratracheal routes with 1.0×10⁵ TCID50 SARS-CoV-2. (a, b) Log10 sgRNA copies/ml (limit of quantification 50 copies/ml) were assessed in bronchoalveolar lavage (BAL) in sham controls and in vaccinated animals following challenge. (c, d) Log10 sgRNA copies/swab (limit of quantification 50 copies/swab) were assessed in nasal swabs (NS) in sham controls and in vaccinated animals following challenge. Days following challenge is shown on the x-axis. One animal in the S.dTM.PP group did not have peak BAL samples obtained following challenge. Red lines reflect median values.
Figure 5.
Figure 5.. Summary of peak viral loads following SARS-CoV-2 challenge.
Peak viral loads in BAL and NS following challenge. Peak viral loads occurred variably on day 1–4 following challenge. Red lines reflect median viral loads. P-values indicate two-sided Mann-Whitney tests (*P<0.05, **P<0.001, ***P<0.0001). n=4, 5, or 6 biologically independent animals in vaccine groups and n=20 biologically independent animals in sham group.
Figure 6.
Figure 6.. Antibody correlates of protection.
Correlations of (a) binding ELISA titers, (b) pseudovirus NAb titers, and (c) live virus NAb titers at week 2 and week 4 with log peak sgRNA copies/ml in BAL following challenge. Red lines reflect the best linear fit relationship between these variables. P and R values reflect two-sided Spearman rank-correlation tests. n=52 biologically independent animals. (d) The heat map shows the differences in the means of z-scored features between completely protected (n=17) and partially protected and non-protected (n=22) animals. The two groups were compared by two-sided Mann-Whitney tests, and stars indicate the Benjamini-Hochberg corrected q-values (*q < 0.05), with q = 0.02707 for log NAb. The dot plots show differences in the features that best discriminated completely protected and partially protected animals, including NAb titers, S-specific antibody-dependent NK cell activation (ADNKA), and antibody-dependent monocyte cellular phagocytosis (ADCP). P-values indicate two-sided Mann-Whitney tests. For the box plots, the upper bound of the box indicates the 75th percentile, and the lower bound the 25th percentile. The horizontal line shows the median and the whiskers indicate minimum/maximum values. The bar plot shows the cross-validated area under the receiver operator characteristics curves using the features indicated on the x-axis in a logistic regression model. The top three 1-feature and 2-feature models are shown. Error bars indicate the mean and standard deviation for 100 repetitions of 10-fold cross-validation.

References

    1. Wu F et al. A new coronavirus associated with human respiratory disease in China. Nature 579, 265–269, doi:10.1038/s41586-020-2008-3 (2020). - DOI - PMC - PubMed
    1. Zhou P et al. A pneumonia outbreak associated with a new coronavirus of probable bat origin. Nature 579, 270–273, doi:10.1038/s41586-020-2012-7 (2020). - DOI - PMC - PubMed
    1. Holshue ML et al. First Case of 2019 Novel Coronavirus in the United States. N Engl J Med 382, 929–936, doi:10.1056/NEJMoa2001191 (2020). - DOI - PMC - PubMed
    1. Li Q et al. Early Transmission Dynamics in Wuhan, China, of Novel Coronavirus-Infected Pneumonia. N Engl J Med, doi:10.1056/NEJMoa2001316 (2020). - DOI - PMC - PubMed
    1. Zhu N et al. A Novel Coronavirus from Patients with Pneumonia in China, 2019. N Engl J Med 382, 727–733, doi:10.1056/NEJMoa2001017 (2020). - DOI - PMC - PubMed

Publication types

MeSH terms