Review
. 2020 Jul 28;25(15):3413.
doi: 10.3390/molecules25153413.

Molecular Imaging of Fluorinated Probes for Tau Protein and Amyloid-β Detection

Affiliations
Review

Molecular Imaging of Fluorinated Probes for Tau Protein and Amyloid-β Detection

Sarah K Yeo et al. Molecules. .

Abstract

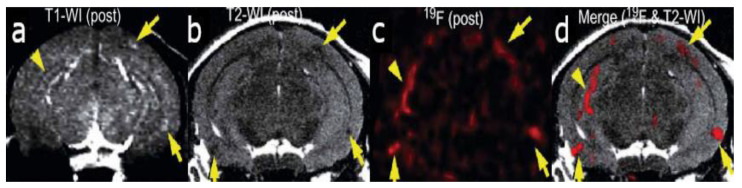
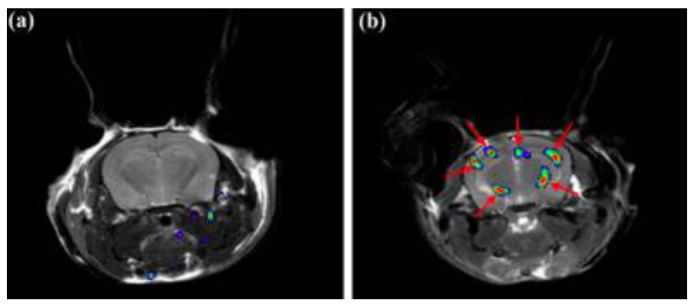
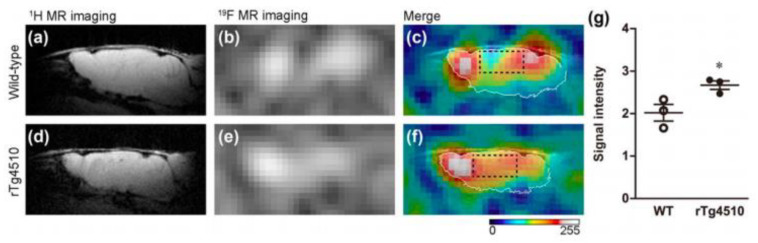
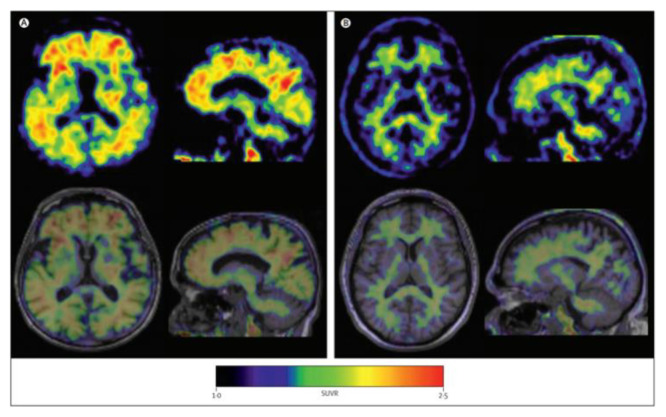
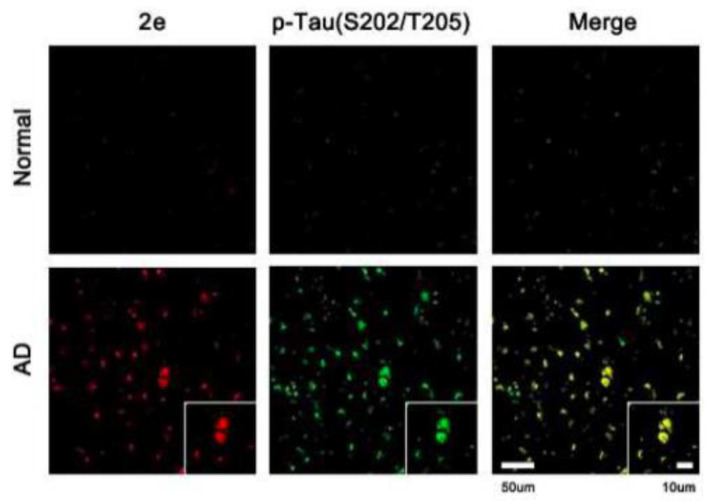
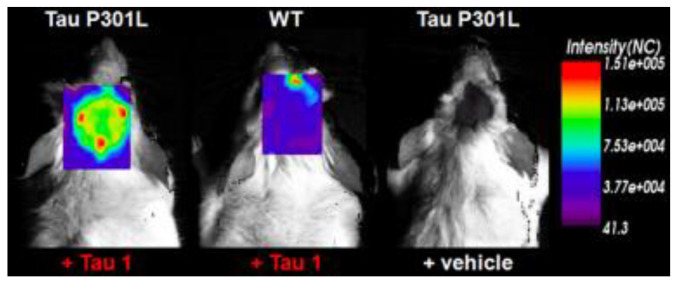
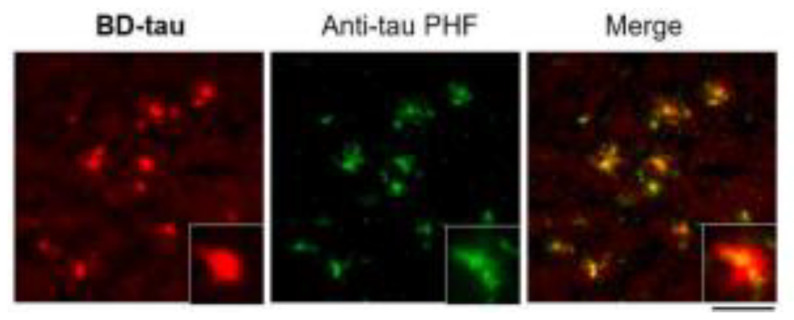
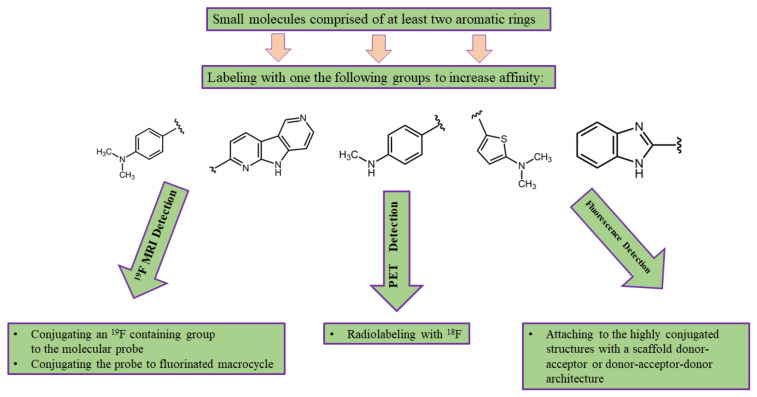
Alzheimer's disease (AD) is the most common form of dementia and results in progressive neurodegeneration. The incidence rate of AD is increasing, creating a major public health issue. AD is characterized by neurofibrillary tangles (NFTs) composed of hyperphosphorylated tau protein and senile plaques composed of amyloid-β (Aβ). Currently, a definitive diagnosis of AD is accomplished post-mortem. Thus, the use of molecular probes that are able to selectively bind to NFTs or Aβ can be valuable tools for the accurate and early diagnosis of AD. The aim of this review is to summarize and highlight fluorinated molecular probes that can be used for molecular imaging to detect either NFTs or Aβ. Specifically, fluorinated molecular probes used in conjunction with 19F MRI, PET, and fluorescence imaging will be explored.

Keywords: Alzheimer’s disease; MRI; PET; amyloid beta imaging; fluorescence; fluorinated molecular probes; molecular imaging; neurofibrillary tangle imaging.


Conflict of interest statement

The authors declare no conflicts of interest.

Figures

Figure 1
Figure 1
In vivo detection of amyloid plaques (indicated by arrowheads and arrows) in the brain of a Tg2576 mouse after injection with (E,E)-1-fluoro-2,5-bis(3-hydroxycarbonyl-4-hydroxy)styryl-benzene (FSB) [14]. (a) T1-weighted 1H imaging of the mouse brain. (b) T2-weighted image of the same slice indicating the position of the amyloid-beta plaques. (c) 19F MRI image of the mouse brain after FSB injection. (d) 19F-FSB image overlaid on top of the high-resolution T2-weighted 1H image. Images are reprinted with permission from the publisher [14].
Figure 2
Figure 2
19F MRI signals of bovine serum albumin@F-functionalized graphene quantum dots (BSA@FGQDs) in normal (a) and Alzheimer’s disease (AD) (b) mice overlaid on top of a high-resolution T1-weighted proton MRI image [27]. Arrows indicate the detection of in vivo amyloid plaques. Images are reprinted with permission from the publisher [27].
Figure 3
Figure 3
In vivo tau detection in wild-type (ac) and rTg4510 (df) mice using 19F MRI after the injection of Shiga-X35 [32]. The proton MRI images (a,d) were used for brain localization. (b,e) 19F MRI images acquired after Shiga-X35 injection. Fluorine images were superimposed on top of high-resolution proton images (c,f). The Shiga-X35 uptake was significantly (* p = 0.044) higher in rTg4510 mice compared to the healthy controls (g). Images and graph are reprinted with permission from the publisher [32].
Figure 4
Figure 4
Axial and sagittal (18F)florbetaben brain PET images of an AD patient (A) and a healthy control (B) for the detection of Aβ [56]. The bottom row illustrates a fused PET/T1-weighted MRI image. Pet images were acquired 90–110 min post-injection. Images are reprinted with permission of the publisher [56].
Figure 5
Figure 5
Representative axial and sagittal (18F)flutemetamol images of AD (upper row), mild cognitive impairment (middle row), and healthy controls (lower row) for the detection of Aβ [57]. Extensive uptake of flutemetamol can be observed in the cortical regions of AD and mild cognitive impairment patients. Images are reprinted with permission of the publisher [57].
Figure 6
Figure 6
Representative transversal, sagittal, and coronal (18F)N-methyl lansoprazole (NML) PET images in a progressive supranuclear palsy patient for the detection of tau [70]. Images are reprinted with permission of the publisher [70].
Figure 7
Figure 7
(18F)RO-948 PET images overlaid on MRI on a healthy control (upper row) and an AD patient (bottom row). The increased uptake of (18F)RO-948 in the AD patient is associated with the binding to the hyperphosphorylated tau protein. [80]. Images are reprinted with permission of the publisher [80].
Figure 8
Figure 8
In vivo imaging of Aβ using QAD-1 in APPSWE/PSEN 1dE9 transgenic (Tg) and wild-type (WT) mice [90]. From left to right, images were taken 5 (a), 15 (b), and 30 (c) min after QAD-1 injection. The significant difference between the QAD-1 uptake in transgenic and wild-type mice was observed 5 min post-QAD-1 injection. The hot-spots on the images correspond to the Aβ plaques localized in the APPSWE/PSEN 1dE9 transgenic mouse. The low background signal of QAD-1 can be observed in (c). Images are reprinted with permission of the publisher [90].
Figure 9
Figure 9
Confocal fluorescence images of healthy controls and AD brain sections after treatment with 6-((1E,3E)-4-(4-[dimethylamino]phenyl)-buta-1,3-dien-1-yl)-2,2-difluoro-4-319 isobutyl-2H-1,3,2-dioxaborinin-1-ium-2-uide to detect tau filaments (first column) [103]. The second column demonstrates staining with a p-tau antibody (Ser202/Thr205). The third column shows the superimposed images demonstrating the accuracy of t-protein detection using the difluoroboron β-diketonate probe. Images are reprinted with permission of the publisher [103].
Figure 10
Figure 10
In vivo fluorescence imaging of a tau deposition in Tau P301L and wild-type mouse brain after the injection of either Tau 1 or the vehicle (negative control) [104]. The images were acquired using 670-nm excitation light 30 min after the injection of the molecular imaging probe. Images are reprinted with permission of the publisher [104].
Figure 11
Figure 11
Ex vivo brain slices of tau transgenic mice labeled with the BD-tau and anti-tau paired helical filament (PHF) antibodies to demonstrate the accuracy of tau aggregates detection using BD-tau [105]. The third image is the overlay of the first two. Images are reprinted with permission of the publisher [105].
Figure 12
Figure 12
The suggested block scheme for the development of fluorinated molecular imaging probes for AD detection using one of the following medical imaging modalities: MRI, PET, and fluorescence imaging. Probes can be adjusted for single-photon emission computed tomography (SPECT) by radiolabeling with 99mTc or 131I instead of 18F.

References

    1. Report A.A. 2020 Alzheimer’s disease facts and figures. Alzheimers Dement. 2020;16:391–460. doi: 10.1002/alz.12068. - DOI
    1. Serrano-Pozo A., Frosch M.P., Masliah E., Hyman B.T. Neuropathological alterations in Alzheimer disease. Cold Spring Harb. Perspect. Med. 2011;1:a006189. doi: 10.1101/cshperspect.a006189. - DOI - PMC - PubMed
    1. Reitz C. Alzheimer’s disease and the amyloid cascade hypothesis: A critical review. Int. J. Alzheimers Dis. 2012;2012:369808. doi: 10.1155/2012/369808. - DOI - PMC - PubMed
    1. Giannakopoulos P., Herrmann F.R., Bussière T., Bouras C., Kövari E., Perl D.P., Morrison J.H., Gold G., Hof P.R. Tangle and neuron numbers, but not amyloid load, predict cognitive status in Alzheimer’s disease. Neurology. 2003;60:1495–1500. doi: 10.1212/01.WNL.0000063311.58879.01. - DOI - PubMed
    1. Deture M.A., Dickson D.W. The neuropathological diagnosis of Alzheimer’s disease. Mol. Neurodegener. 2019;14:396. doi: 10.1186/s13024-019-0333-5. - DOI - PMC - PubMed

MeSH terms