. 2020 Jul 28;13(15):3348.
doi: 10.3390/ma13153348.

Pandora's Box-Influence of Contour Parameters on Roughness and Subsurface Residual Stresses in Laser Powder Bed Fusion of Ti-6Al-4V

Affiliations

Pandora's Box-Influence of Contour Parameters on Roughness and Subsurface Residual Stresses in Laser Powder Bed Fusion of Ti-6Al-4V

Katia Artzt et al. Materials (Basel). .

Abstract

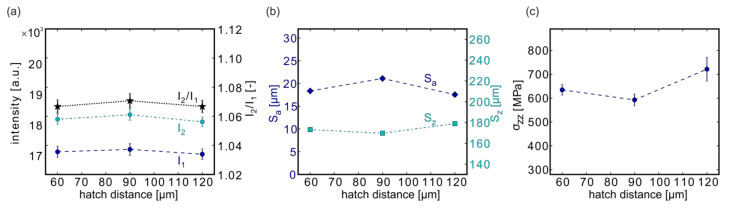
The contour scan strategies in laser powder bed fusion (LPBF) of Ti-6Al-4V were studied at the coupon level. These scan strategies determined the surface qualities and subsurface residual stresses. The correlations to these properties were identified for an optimization of the LPBF processing. The surface roughness and the residual stresses in build direction were linked: combining high laser power and high scan velocities with at least two contour lines substantially reduced the surface roughness, expressed by the arithmetic mean height, from values as high as 30 µm to 13 µm, while the residual stresses rose from ~340 to about 800 MPa. At this stress level, manufactured rocket fuel injector components evidenced macroscopic cracking. A scan strategy completing the contour region at 100 W and 1050 mm/s is recommended as a compromise between residual stresses (625 MPa) and surface quality (14.2 µm). The LPBF builds were monitored with an in-line twin-photodiode-based melt pool monitoring (MPM) system, which revealed a correlation between the intensity quotient I2/I1, the surface roughness, and the residual stresses. Thus, this MPM system can provide a predictive estimate of the surface quality of the samples and resulting residual stresses in the material generated during LPBF.

Keywords: Ti-6Al-4V; additive manufacturing; contour scan strategy; melt pool monitoring; residual stress; surface roughness; synchrotron X-ray diffraction.


Conflict of interest statement

The authors declare no conflict of interest.

Figures

Figure 1
Figure 1
(a) Sample positions on the base plate; red marked are the sample sides, which were investigated in this study; (b) side view of the specimens (5 × 5 × 15 mm3), which were printed on 2 mm block supports; (c) example for a typical scan pattern used in this study consisting of 5 contour lines, 1 fill contour, and volume scan.
Figure 2
Figure 2
Examples for different scan patterns (bottom images represent enlargements of the top left corner in the upper sketches): (a) only chess pattern used (contour line with P = 0 W); (b) 2 contour lines (h = 90 µm); (c) 5 contour lines (h = 90 µm), (d) 10 contour lines (h = 90 µm); (e) only contour lines (h = 90 µm); (f) 5 contour lines with a small hatch distance of h = 60 µm; (g) 5 contour lines with a large hatch distance of h = 120 µm.
Figure 3
Figure 3
MPM (melt pool monitoring) photodiode intensity I1 for one layer of sample #05 (LPBF (laser powder bed fusion) parameters: 5 contour lines with a contour laser power Pcl = 100 W, contour velocity vcl = 525 mm/s; volume laser power P = 175 W, velocity v = 500 mm/s, see Appendix A, Table A1). The data of the outer contour line within the red marked area was used for a consecutive comparison to roughness and stress results.
Figure 4
Figure 4
(a) Image of specimens on the base plate (specimen size 5 × 5 × 15 mm3 + 2 mm support); (b,c) simplified gauge volume shape and measurement points for measurement of strains in build direction z (ϕ = 0°). The identical sample sides were analyzed with MPM and diffraction (see Figure 1).
Figure 5
Figure 5
Influence of the scan pattern on the MPM data (a), on the surface roughness (b), and on the residual stresses (c). Depicted results are from samples #01 (CL O-I), #02 (CL I-O), #03 (chess scan strategy with P = 100 W), and #04 (chess/P = 175 W). CL O-I, contour lines from the outside to the inside; CL I-O, contour lines from the inside and finishing with the outside.
Figure 6
Figure 6
Influence of the scan order on the MPM data (a), on the surface roughness (b), and on the residual stresses (c). Depicted are the results from samples #05 (CL(O-I)-V), #06 (CL(I-O)-V), #07 (V-CL(I-O)), and #08 (V-CL(O-I)).
Figure 7
Figure 7
The influence of the contour line count on the MPM data (a), on the surface roughness (b), and on the residual stresses (c). Depicted are the results from samples #04 (only volume, no contour lines), #09 (2 contour lines), #05 (5 contour lines), #10 (10 contour lines), and #01 (only contour lines, no volume). Note: The lines connecting the measurement points are only provided as a guide for the eye.
Figure 8
Figure 8
Influence of the power on the MPM data (a), on the surface roughness (b), and on the residual stresses (c). Depicted are the results from samples #11 (PCL = 75 W), #05 (PCL = 100 W), #12 (PCL = 200 W). Note: The lines connecting the measurement points are only provided as a guide for the eye.
Figure 9
Figure 9
Influence of the scanning velocity on the MPM data (a), on the surface roughness (b), and on the residual stresses (c). Depicted are the results from samples #13 (250 mm/s), #05 (525 mm/s), and #14 (1050 mm/s). Note: The lines connecting the measurement points are only provided as a guide for the eye.
Figure 10
Figure 10
Influence of the hatch distance on the MPM data (a), on the surface roughness (b), and on the RS (c). Depicted are the results from samples #15 (60 µm), #05 (90 µm), and #16 (120 µm). Note: The lines connecting the measurement points are only provided as a guide for the eye.
Figure 11
Figure 11
Effects of the laser power, scanning velocity, and hatch distance at constant volume energy density (Ev = const.) on the MPM data (a), on the surface roughness (b), and on the residual stresses (c). Depicted are the results of the samples listed in Table 5. The upper-velocity axis at the top of each Figure corresponds to the h = 60 µm and the lower one to the h = 90 µm curves. Note: The lines connecting the measurement points are only provided as a guide for the eye.
Figure 12
Figure 12
(a) LSM topography results of the shot-peened specimen (#22); (b) stress depth profile for a shot-peened specimen relative to an as-built specimen (#09 for y = 0 µm). Each stress value belongs to a certain {hkl}-peak, which is given in the brackets. The penetration depth τ was calculated according to Equation (3).
Figure 13
Figure 13
Comparison of the results for the variation of the hatch distance h, laser power P, and scanning velocity v in relation to EV (details see Section 3.4) on the MPM data (a), on the surface roughness (b), and on the residual stresses (c).
Figure 14
Figure 14
Correlation of the mean arithmetic height Sa with (a) the stress in build direction σzz and (b) image of a component (diameter ~80 mm, height ~15 mm) built with the same parameters that were used for sample #19 and exhibited severe RS-induced cracking. Three examples of cracks are indicated by red arrows.
Figure 15
Figure 15
(a) Correlation of Sa with I2/I1 for specimens, which were manufactured with contour lines and the standard scan order CL(O-I)-V. The following samples are depicted: hatch distance variation (h var.), Section 3.4. (c); laser power variation (P. var), Section 3.4. (a); velocity variation (v var.), Section 3.4. (b); samples from the studies with hatch distances of 60 µm and = 90 µm at EV = const. (h = 60 µm and h = 90 µm), Section 3.5; samples from the contour line (CL var), Section 3.3. (b) Correlation of Sa with I2/I1 for all specimens. (c) Correlation of the residual stress in build direction σzz with I2/I1.

References

    1. Dutta B., Froes F.H. Chapter 1—The Additive Manufacturing of Titanium Alloys. In: Dutta B., Froes F.H., editors. Additive Manufacturing of Titanium Alloys. Butterworth-Heinemann; Kidlington, UK: 2016. pp. 1–10. - DOI
    1. ISO/ASTM 52900 . Additive Manufacturing—General Principles—Terminology. Beuth Verlag; Berlin, Germany: 2016.
    1. Gibson I., Rosen D.W., Stucker B. Additive Manufacturing Technologies: Rapid Prototyping to Direct Digital Manufacturing. Springer; Boston, MA, USA: 2010. Design for Additive Manufacturing; pp. 299–332. - DOI
    1. Gunther J., Leuders S., Koppa P., Troster T., Henkel S., Biermann H., Niendorf T. On the effect of internal channels and surface roughness on the high-cycle fatigue performance of Ti-6Al-4V processed by SLM. Mat. Des. 2018;143:1–11. doi: 10.1016/j.matdes.2018.01.042. - DOI
    1. Chen Z., Wu X., Tomus D., Davies C.H.J. Surface roughness of Selective Laser Melted Ti-6Al-4V alloy components. Addit. Manuf. 2018;21:91–103. doi: 10.1016/j.addma.2018.02.009. - DOI

LinkOut - more resources