

Single Cell Transcriptome Analysis of Niemann-Pick Disease, Type C1 Cerebella
- PMID: 32731618
- PMCID: PMC7432835
- DOI: 10.3390/ijms21155368
Single Cell Transcriptome Analysis of Niemann-Pick Disease, Type C1 Cerebella
Abstract
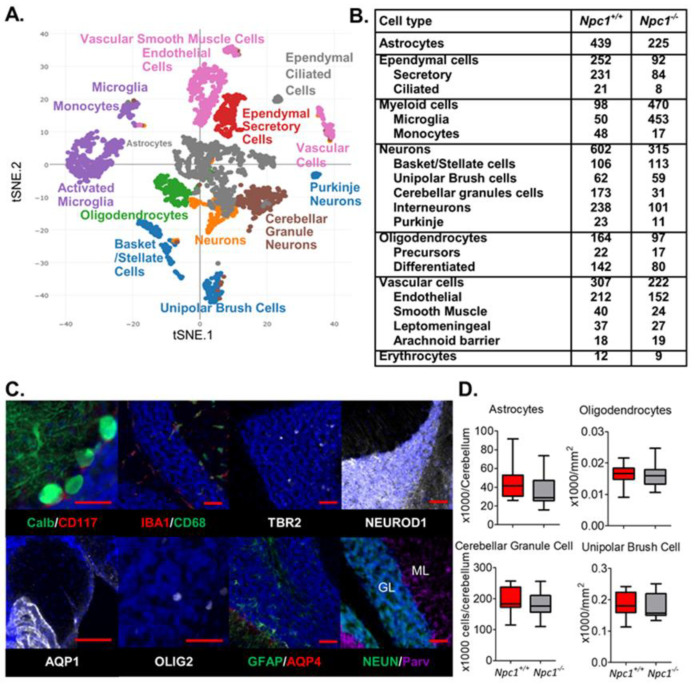
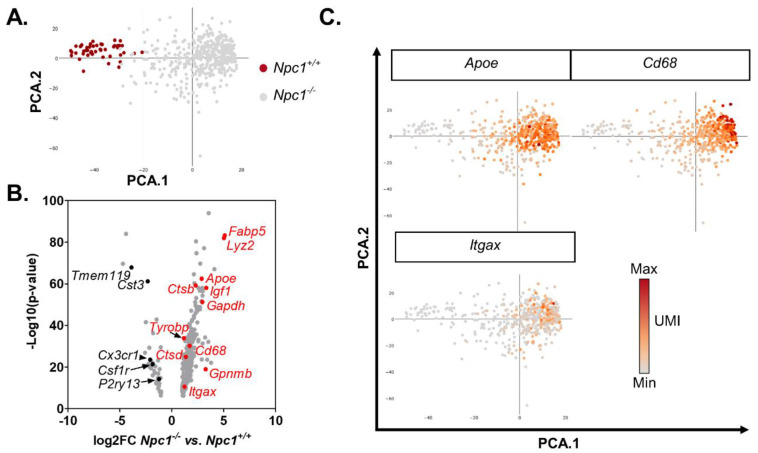
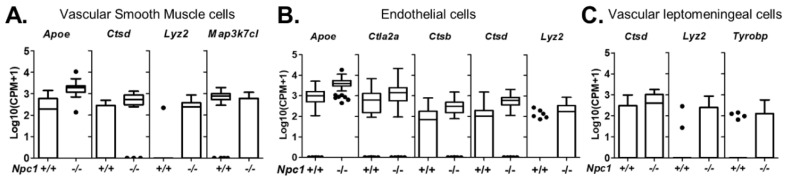
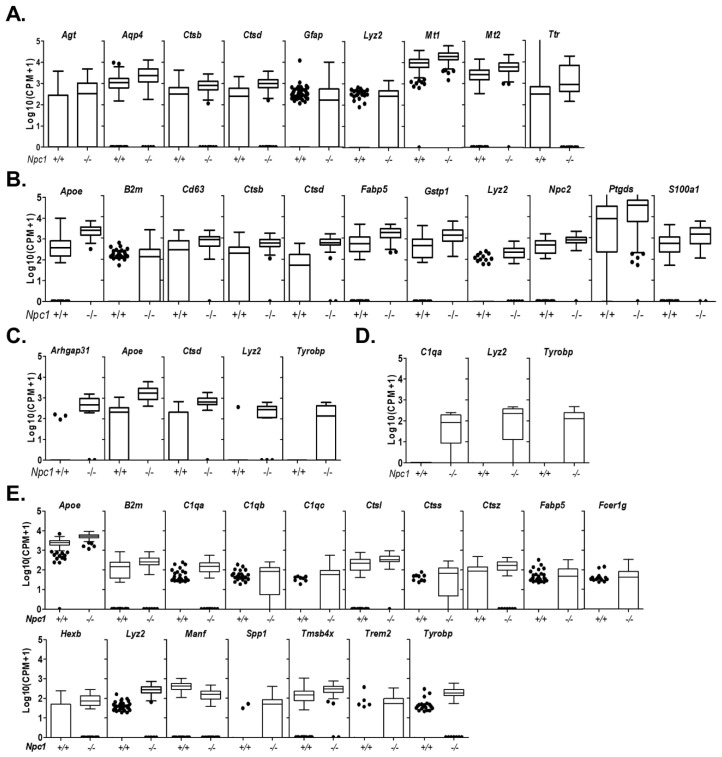
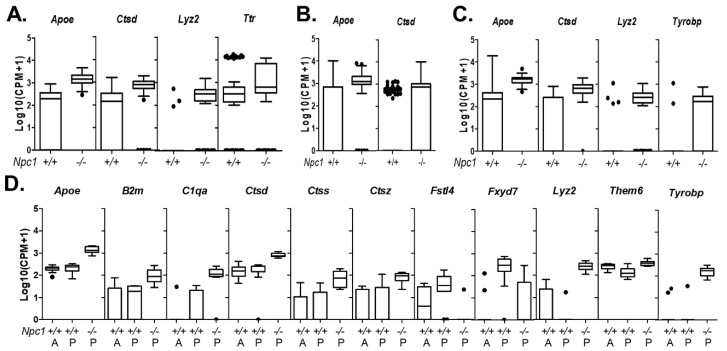
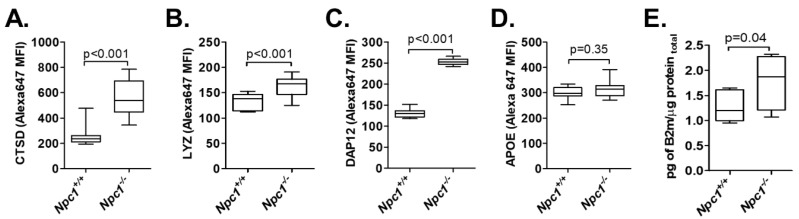
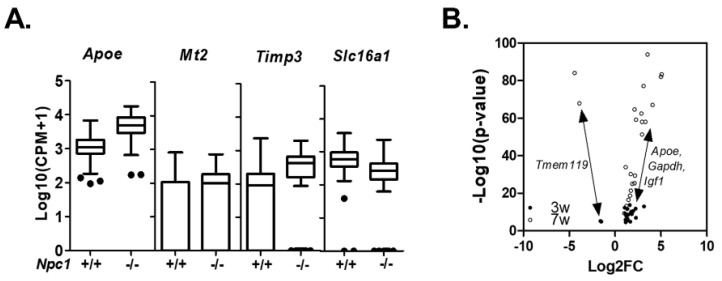
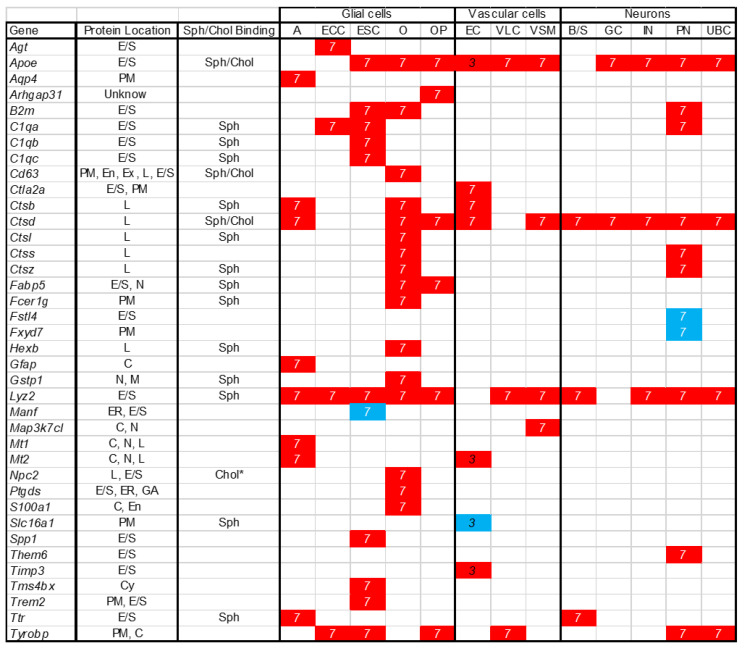
Niemann-Pick disease, type C1 (NPC1) is a lysosomal disease characterized by endolysosomal storage of unesterified cholesterol and decreased cellular cholesterol bioavailability. A cardinal symptom of NPC1 is cerebellar ataxia due to Purkinje neuron loss. To gain an understanding of the cerebellar neuropathology we obtained single cell transcriptome data from control (Npc1+/+) and both three-week-old presymptomatic and seven-week-old symptomatic mutant (Npc1-/-) mice. In seven-week-old Npc1-/- mice, differential expression data was obtained for neuronal, glial, vascular, and myeloid cells. As anticipated, we observed microglial activation and increased expression of innate immunity genes. We also observed increased expression of innate immunity genes by other cerebellar cell types, including Purkinje neurons. Whereas neuroinflammation mediated by microglia may have both neuroprotective and neurotoxic components, the contribution of increased expression of these genes by non-immune cells to NPC1 pathology is not known. It is possible that dysregulated expression of innate immunity genes by non-immune cells is neurotoxic. We did not anticipate a general lack of transcriptomic changes in cells other than microglia from presymptomatic three-week-old Npc1-/- mice. This observation suggests that microglia activation precedes neuronal dysfunction. The data presented in this paper will be useful for generating testable hypotheses related to disease progression and Purkinje neurons loss as well as providing insight into potential novel therapeutic interventions.
Keywords: NPC1; Niemann–Pick disease; cerebellar ataxia; cerebellum; single cell RNA sequencing; transcriptome; type C1.
Conflict of interest statement
The authors declare no conflicts of interest.
Figures
Similar articles
-
The Cerebellum in Niemann-Pick C1 Disease: Mouse Versus Man.Cerebellum. 2023 Feb;22(1):102-119. doi: 10.1007/s12311-021-01347-3. Epub 2022 Jan 18. Cerebellum. 2023. PMID: 35040097 Free PMC article. Review.
-
Identification of Novel Pathways Associated with Patterned Cerebellar Purkinje Neuron Degeneration in Niemann-Pick Disease, Type C1.Int J Mol Sci. 2019 Dec 31;21(1):292. doi: 10.3390/ijms21010292. Int J Mol Sci. 2019. PMID: 31906248 Free PMC article.
-
Reduction of glutamate neurotoxicity: A novel therapeutic approach for Niemann-Pick disease, type C1.Mol Genet Metab. 2021 Dec;134(4):330-336. doi: 10.1016/j.ymgme.2021.11.008. Epub 2021 Nov 16. Mol Genet Metab. 2021. PMID: 34802899 Free PMC article.
-
Evaluation of the Potential Role of Proprotein Convertase Subtilisin/Kexin Type 9 (PCSK9) in Niemann-Pick Disease, Type C1.Int J Mol Sci. 2020 Mar 31;21(7):2430. doi: 10.3390/ijms21072430. Int J Mol Sci. 2020. PMID: 32244519 Free PMC article.
-
Modeling Niemann Pick type C1 using human embryonic and induced pluripotent stem cells.Brain Res. 2017 Feb 1;1656:63-67. doi: 10.1016/j.brainres.2016.03.007. Epub 2016 Mar 10. Brain Res. 2017. PMID: 26972536 Free PMC article. Review.
Cited by
-
Cerebellum in neurodegenerative diseases: Advances, challenges, and prospects.iScience. 2024 Oct 18;27(11):111194. doi: 10.1016/j.isci.2024.111194. eCollection 2024 Nov 15. iScience. 2024. PMID: 39555407 Free PMC article. Review.
-
The neurotrophic factor MANF regulates autophagy and lysosome function to promote proteostasis in Caenorhabditis elegans.Proc Natl Acad Sci U S A. 2024 Oct 22;121(43):e2403906121. doi: 10.1073/pnas.2403906121. Epub 2024 Oct 17. Proc Natl Acad Sci U S A. 2024. PMID: 39418305 Free PMC article.
-
The cerebellum and cognitive neural networks.Front Hum Neurosci. 2023 Jul 28;17:1197459. doi: 10.3389/fnhum.2023.1197459. eCollection 2023. Front Hum Neurosci. 2023. PMID: 37576472 Free PMC article. Review.
-
The cholesterol transporter NPC1 is essential for epigenetic regulation and maturation of oligodendrocyte lineage cells.Nat Commun. 2023 Jul 5;14(1):3964. doi: 10.1038/s41467-023-39733-6. Nat Commun. 2023. PMID: 37407594 Free PMC article.
-
The Cerebellum in Niemann-Pick C1 Disease: Mouse Versus Man.Cerebellum. 2023 Feb;22(1):102-119. doi: 10.1007/s12311-021-01347-3. Epub 2022 Jan 18. Cerebellum. 2023. PMID: 35040097 Free PMC article. Review.
References
-
- Pentchev P.G., Comly M.E., Kruth H.S., Patel S., Proestel M., Weintroub H. The cholesterol storage disorder of the mutant BALB/c mouse. A primary genetic lesion closely linked to defective esterification of exogenously derived cholesterol and its relationship to human type C Niemann-Pick disease. J. Biol. Chem. 1986;261:2772–2777. - PubMed
MeSH terms
Grants and funding
LinkOut - more resources
Full Text Sources
Medical
Research Materials
