. 2020 Sep 11;369(6509):1388-1394.
doi: 10.1126/science.aba8984. Epub 2020 Jul 30.

The hepatocyte clock and feeding control chronophysiology of multiple liver cell types

Affiliations

The hepatocyte clock and feeding control chronophysiology of multiple liver cell types

Dongyin Guan et al. Science. .

Abstract

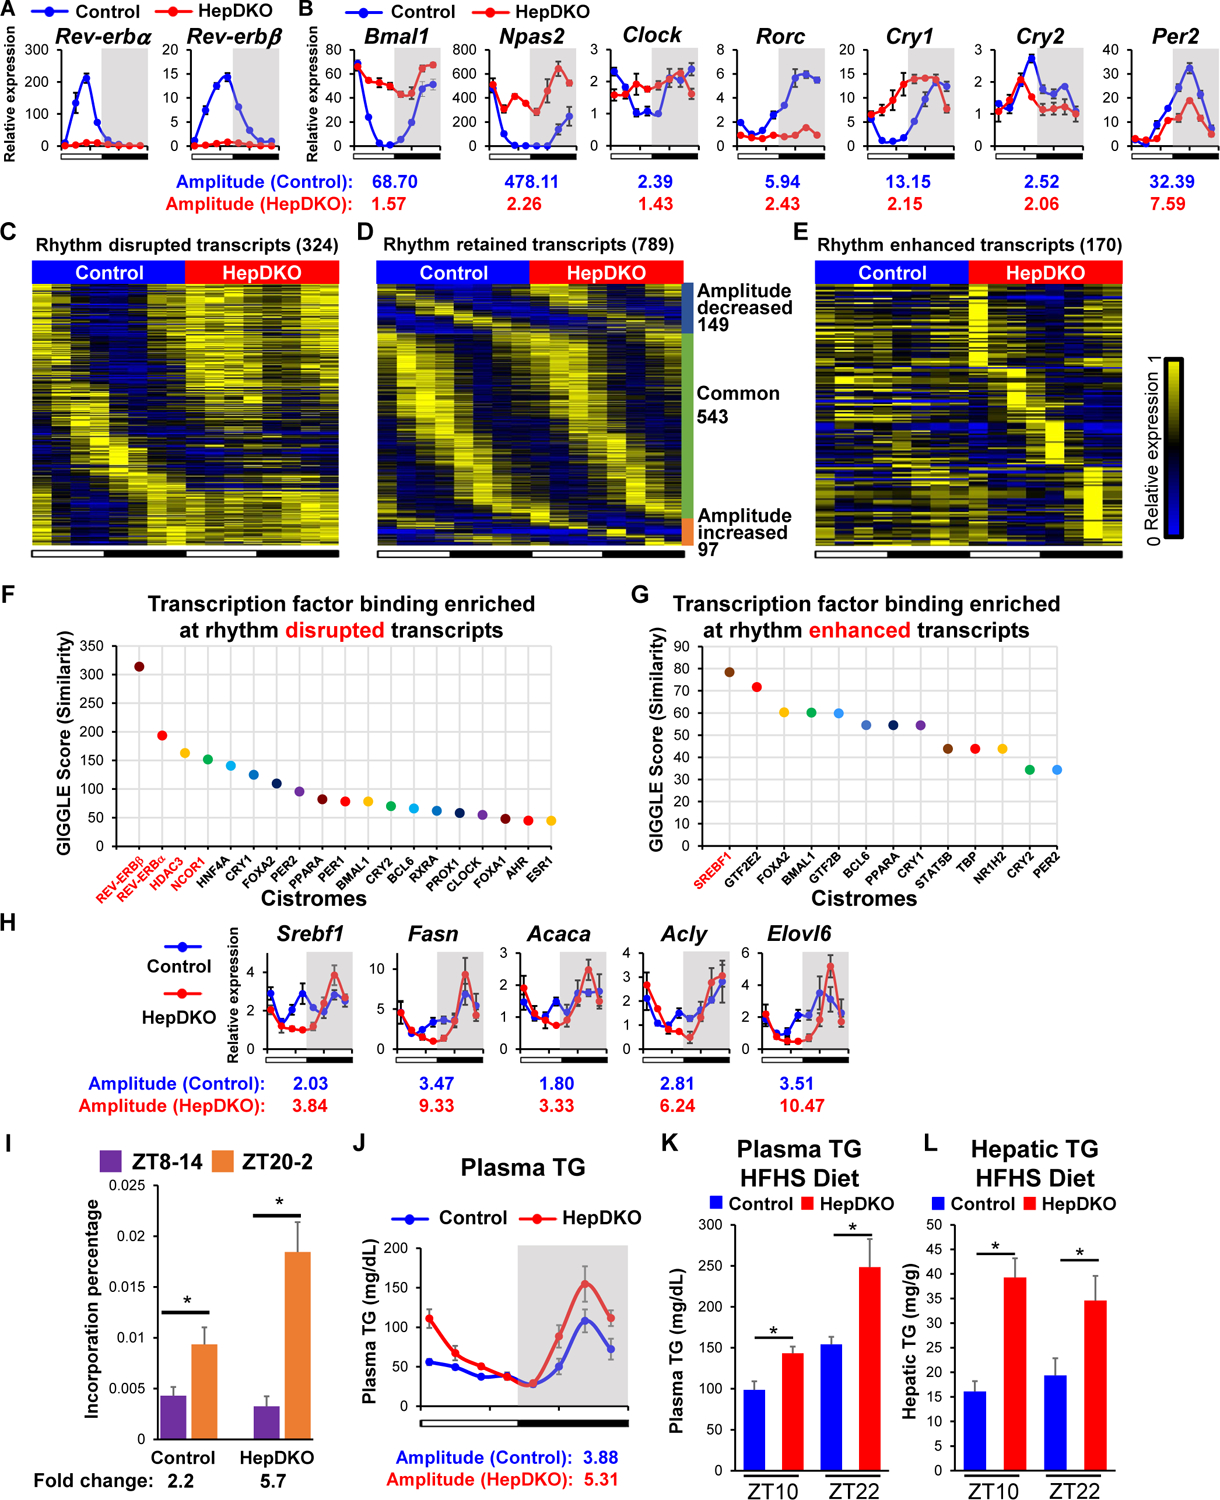
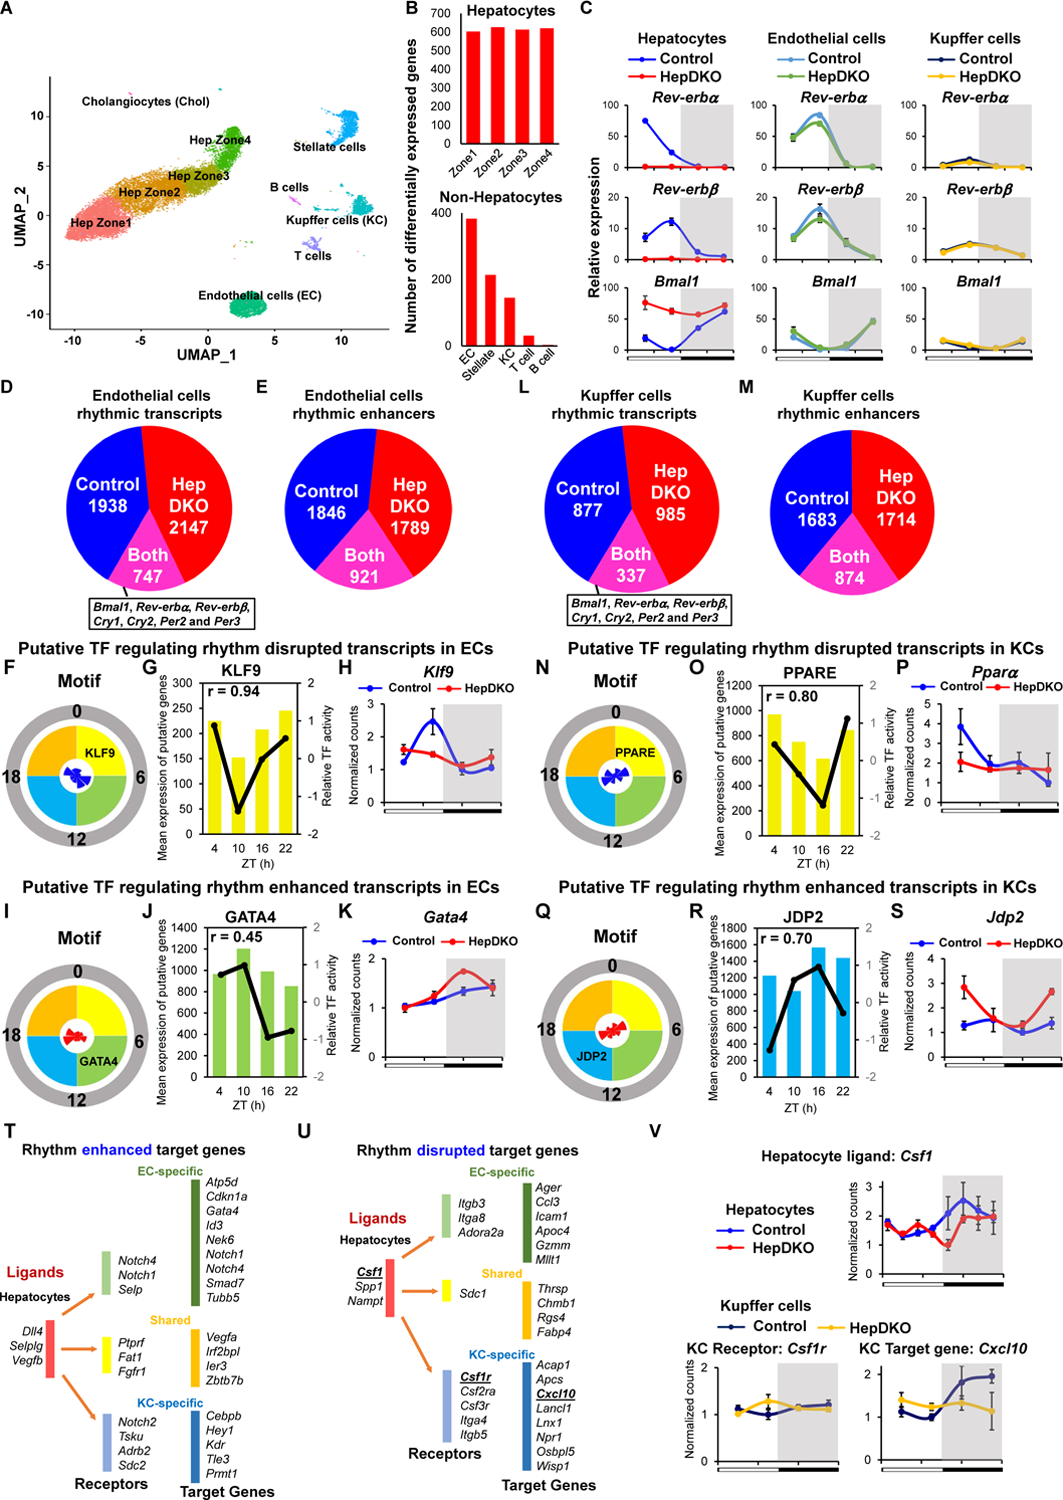
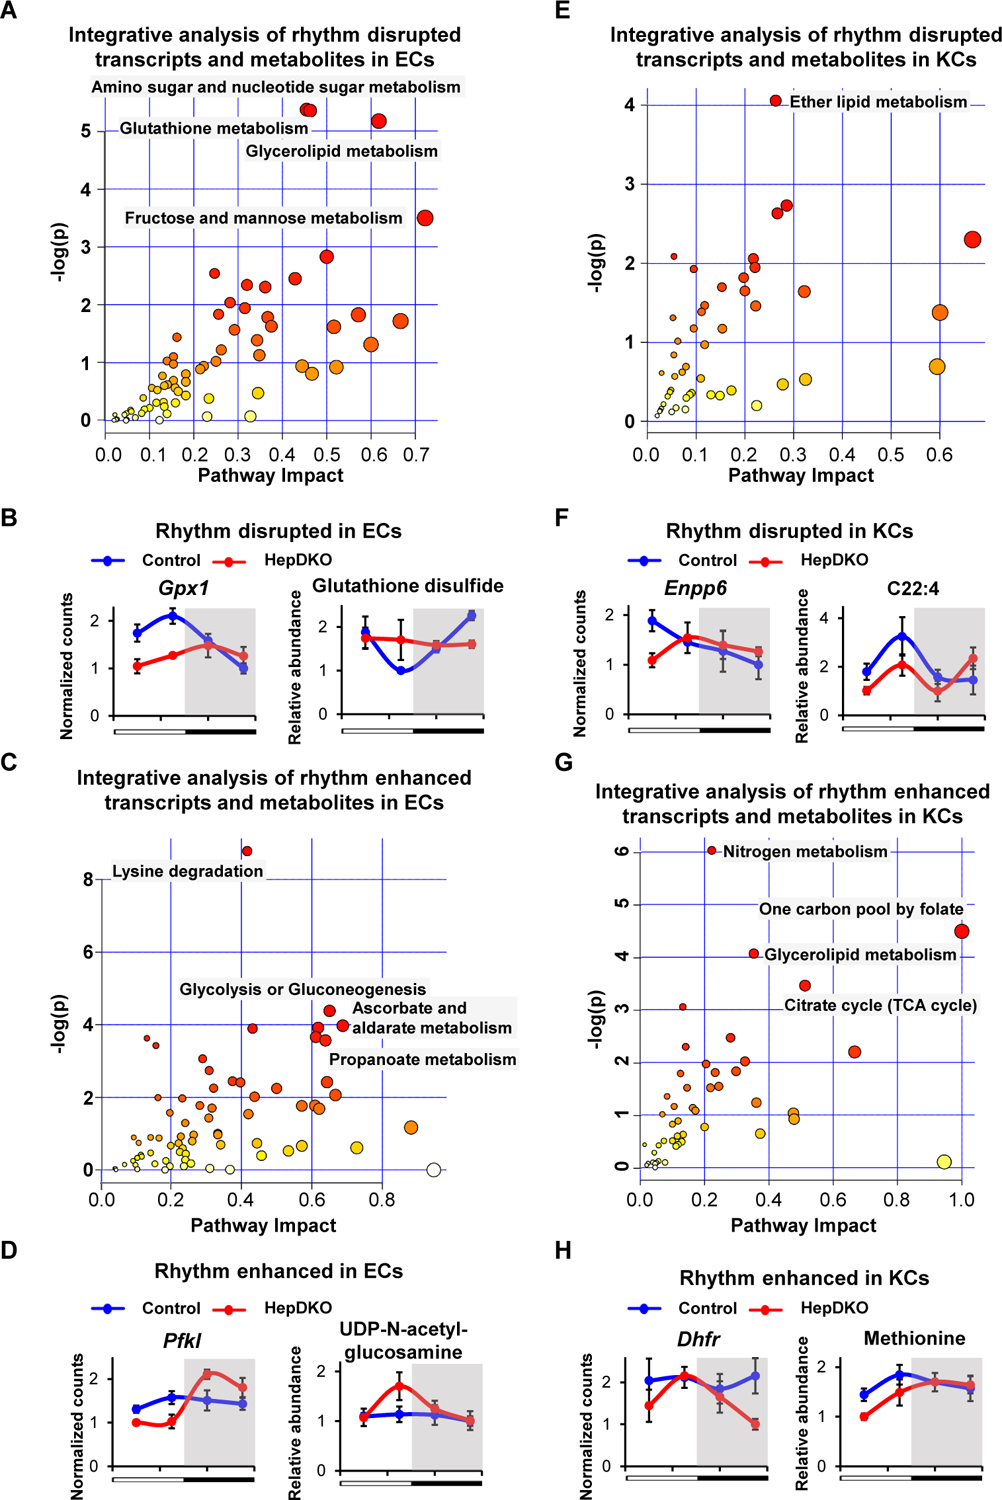
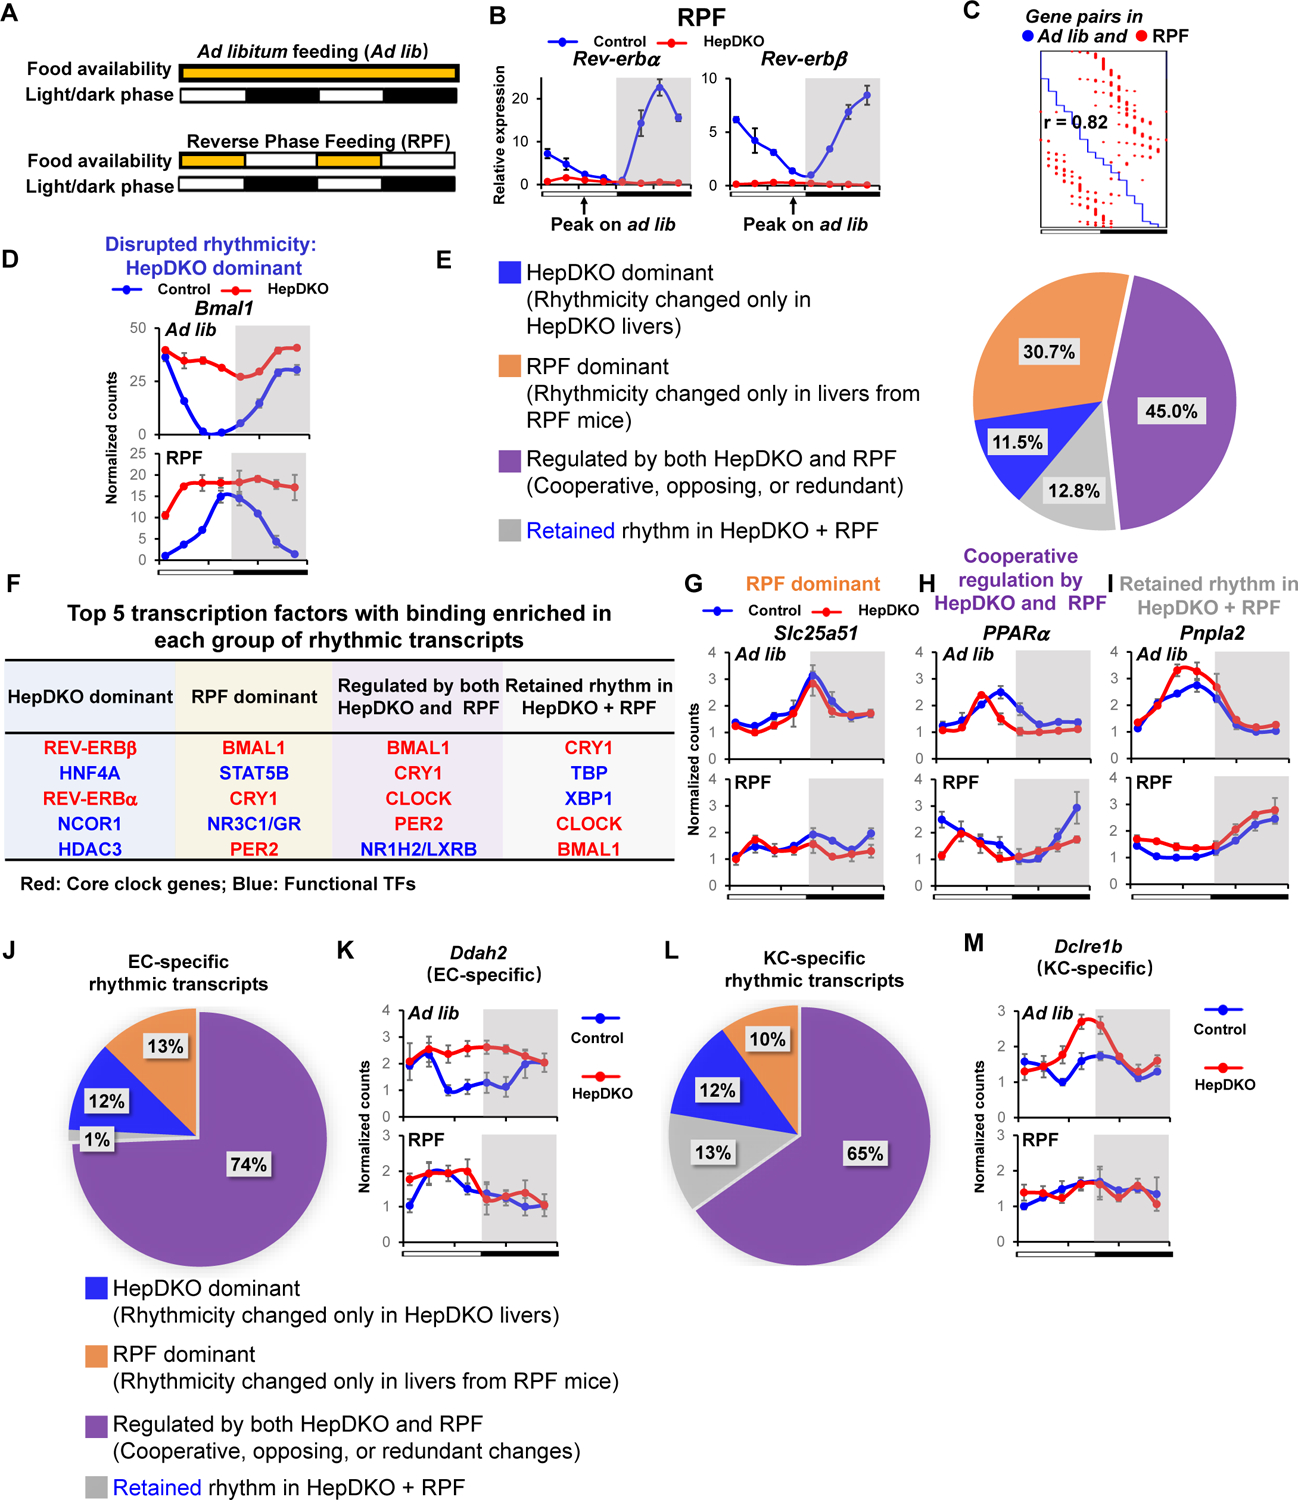
Most cells of the body contain molecular clocks, but the requirement of peripheral clocks for rhythmicity and their effects on physiology are not well understood. We show that deletion of core clock components REV-ERBα and REV-ERBβ in adult mouse hepatocytes disrupts diurnal rhythms of a subset of liver genes and alters the diurnal rhythm of de novo lipogenesis. Liver function is also influenced by nonhepatocytic cells, and the loss of hepatocyte REV-ERBs remodels the rhythmic transcriptomes and metabolomes of multiple cell types within the liver. Finally, alteration of food availability demonstrates the hierarchy of the cell-intrinsic hepatocyte clock mechanism and the feeding environment. Together, these studies reveal previously unsuspected roles of the hepatocyte clock in the physiological coordination of nutritional signals and cell-cell communication controlling rhythmic metabolism.


Conflict of interest statement

Competing interests: J.D.R. is consultant for Pfizer and scientific advisor to C.R.R., and M.A.L. is consultant to Pfizer, Novartis, Madrigal Pharmaceuticals, and Calico.

Figures

Figure 1.
Figure 1.. Disruption of REV-ERBα and β in hepatocytes remodels the liver diurnal rhythmic transcriptome and lipid metabolism.
(A–B) Relative mRNA expression of Rev-erbα and Rev-erbβ (A) and REV-ERBs target genes (B) in control and HepDKO livers. (C–E) Heat map of the relative expression of rhythm disrupted (C), retained (D), and enhanced (E) transcripts in control and HepDKO livers. The color bar indicates the scale used to show the expression of transcripts across eight time points, with the highest expression normalized to 1. JTK_CYCLE, adjusted p < 0.01, 21 ≤ period (t) ≤ 24 hr, peak to trough ratio > 2 (n = 3 per time point). (F–G) Transcription factor binding similarity screening on rhythm disrupted (F) and enhanced (G) transcripts based on all published liver cistromes from CistromeDB (11). (H) Relative mRNA expression of Srebf1 and its target genes in control and HepDKO livers (n = 4–6 per time point). (I) Incorporation of deuterated water into liver fatty acids was measured in mice 6 hours after oral gavage of D2O either at ZT8 or at ZT20. Data are presented as mean ± SEM. *p < 0.05 in Student’s t-test (n = 6 mice per group). (J) Serum triglyceride measurements in control and HepDKO mice. (K–L) Serum triglyceride (K) and hepatic triglyceride (L) measurements in HFHS-fed control and HepDKO mice. Data are presented as mean ± SEM (n = 4–6 per time point).
Figure 2.
Figure 2.. Hepatocyte REV-ERBs control non-hepatocytic diurnal rhythmic transcriptome.
(A) UMAP visualization of liver cell clusters based on 18,239 single-cell transcriptomes. (B) The number of differentially expressed transcripts in hepatocytes (upper panel) or non-hepatocytes (lower panel) upon REV-ERBs HepDKO. (C) Relative mRNA expression of Rev-erbα, Rev-erbβ and Bmal1 in isolated hepatocytes, endothelial cells and Kupffer cells from control and HepDKO livers. (D and E) Identification of diurnal rhythmic transcripts (D) and enhancers (E) in isolated endothelial cells from control and HepDKO livers. JTK_CYCLE (Hughes et al., 2010), adjusted p ≤ 0.05, 21 ≤ period (t) ≤ 24 hr, peak to trough ratio > 1.5. (F and I) Rose diagrams show the prevalence of rhythmic transcripts in each phase group, and motifs enriched at sites of rhythmic enhancers, which were correlated with rhythm disrupted (F) and enhanced (I) transcripts and enhancers from IMAGE in isolated ECs. (G and J) Correlation of mean expression of putative target genes and relative TF transcription activity in four phase groups in isolated ECs from control (G) and HepDKO (J) livers. In each plot, the bars represent the mean expression of putative TF target genes of each phase, and the black line represents the predicted TF relative transcription activity. Correlation coefficient r shows the strength of the relationship between the mean expression of putative TF target genes and relative transcription activity. (H and K) Expression level (normalized read counts) of Klf9 (H) and Gata4 (K) in isolated ECs from control and HepDKO livers. (L and M) Identification of diurnal rhythmic transcripts (L) and enhancers (M) in isolated Kupffer cells from control and HepDKO livers. (N and Q) Rose diagrams show the prevalence of rhythmic transcript in each phase group, and motifs enriched at sites of rhythmic enhancers, which were correlated with rhythm disrupted (N) and enhanced (Q) transcripts and enhancers from IMAGE in isolated KCs. (O and R) Correlation of mean expression of putative target genes and relative TF transcription activity in four phase groups in isolated KCs from control (O) and HepDKO (R) livers. In each plot, the bars represent the mean expression of putative TF target genes of each phase, and the black line represents the predicted TF relative transcription activity. Correlation coefficient r shows the strength of the relationship between the mean expression of putative TF target genes and relative transcription activity. (P and S) Expression level (normalized read counts) of Pparα (P) and Jbp2 (S) in isolated KCs from control and HepDKO livers. Data are presented as mean ± SEM (n = 4 per time point). (T and U) Ligand-receptor interaction analysis. Top 3 putative ligands from hepatocytes affect receptors (in ECs and KCs) for the regulation of rhythm enhanced (T) and disrupted (U) transcripts in ECs and KCs. (V) Examples of rhythm disrupted ligand (Csf1) from hepatocytes, receptor (Csf1r) and rhythm disrupted target gene (Cxcl10) in Kupffer cells.
Figure 3.
Figure 3.. Hepatocyte REV-ERBs regulate non-hepatocytic diurnal rhythmic metabolic process.
(A and C) Metabolic pathway analysis integrating the enrichment of genes and metabolites in rhythm disrupted (A) and enhanced (C) transcripts and metabolites in isolated ECs. (B and D) Examples of rhythm disrupted (B) and enhanced (D) metabolites and related transcripts in ECs upon REV-ERBs DKO in hepatocytes. (E and G) Metabolic pathway analysis integrating the enrichment of genes and metabolites in rhythm disrupted (E) and enhanced (G) transcripts and metabolites in isolated KCs. (F and H) Examples of rhythm disrupted (F) and enhanced (H) metabolites and related transcripts in KCs upon REV-ERBs DKO in hepatocytes. Pathways were considered significant if p < 0.01 using Hypergeometric Test. Metabolites and transcripts data are presented as mean ± SEM (n = 3–4 per time point).
Figure 4.
Figure 4.. Control of liver diurnal rhythms by the hepactocyte clock and feeding.
(A) Diagram of feeding schedule of Ad libitum feeding (Ad lib) and reverse phase feeding (RPF). (B) Relative expression of Rev-erbα and Rev-erbβ in control and HepDKO livers from RPF mice. (C) Phase correlation of hepatic rhythmic transcripts between ad lib and RPF mice. Each row has a unique pair of hepatic rhythmic transcripts in ad lib mice (blue dot) and RPF mice (red dot). (D) Expression level (normalized read counts) of Bmal1 in control and HepDKO livers from ad lib and RPF mice. (E) Identification of rhythmic transcripts that were dominantly regulated by HepDKO (blue) or RPF (orange), regulated by both HepDKO and RPF (purple), and retained in HepDKO+RPF (grey). (F) Top 5 TFs from four groups in (E) identified from transcription factor binding similarity screening based on all published liver cistromes from CistromeDB (11). (G-I) Expression level (normalized read counts) of Slc25a51, Pparα and Pnpla2 in control and HepDKO livers from ad lib and RPF mice. (J and L) Identification of EC-specific (J) and KC-specific (L) rhythmic transcripts that were dominantly regulated by HepDKO (blue) or RPF (orange), regulated by both HepDKO and RPF (purple), and retained in HepDKO+RPF (grey). (K and M) Expression level (normalized read counts) of EC-specific gene Ddah2 (K) and KC-specific gene Dclre1b (M) in control and HepDKO livers from ad lib and RPF mice. Data are presented as mean ± SEM (n = 3 per time point).

References

    1. Bass J, Takahashi JS, Circadian integration of metabolism and energetics. Science 330, 1349–1354 (2010). - PMC - PubMed
    1. Takahashi JS, Transcriptional architecture of the mammalian circadian clock. Nat Rev Genet 18, 164–179 (2017). - PMC - PubMed
    1. Welsh DK, Takahashi JS, Kay SA, Suprachiasmatic nucleus: cell autonomy and network properties. Annu Rev Physiol 72, 551–577 (2010). - PMC - PubMed
    1. Green CB, Takahashi JS, Bass J, The meter of metabolism. Cell 134, 728–742 (2008). - PMC - PubMed
    1. Panda S, Circadian physiology of metabolism. Science 354, 1008–1015 (2016). - PMC - PubMed

Publication types

Substances