. 2020 Aug 11;117(32):19590-19598.
doi: 10.1073/pnas.1921909117. Epub 2020 Jul 30.

REM sleep stabilizes hypothalamic representation of feeding behavior

Affiliations

REM sleep stabilizes hypothalamic representation of feeding behavior

Lukas T Oesch et al. Proc Natl Acad Sci U S A. .

Abstract

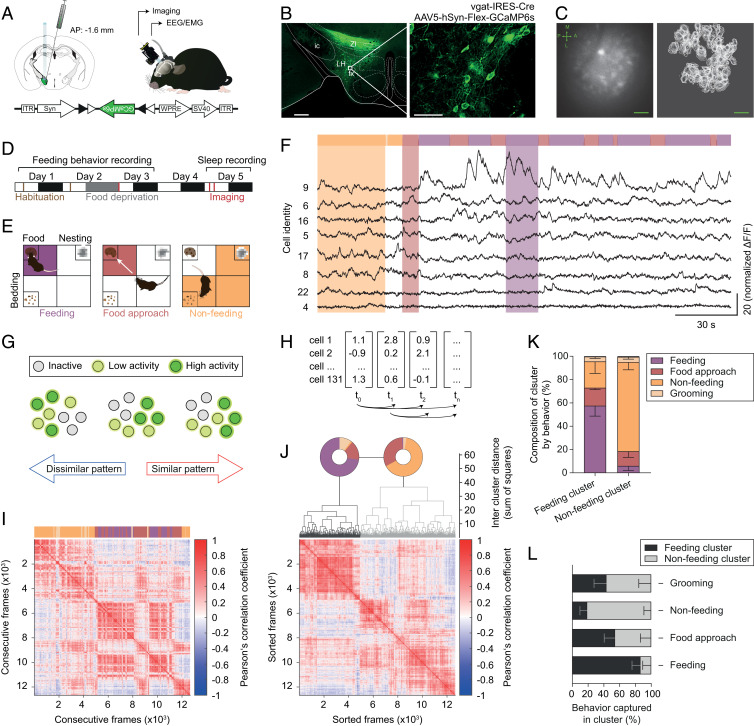
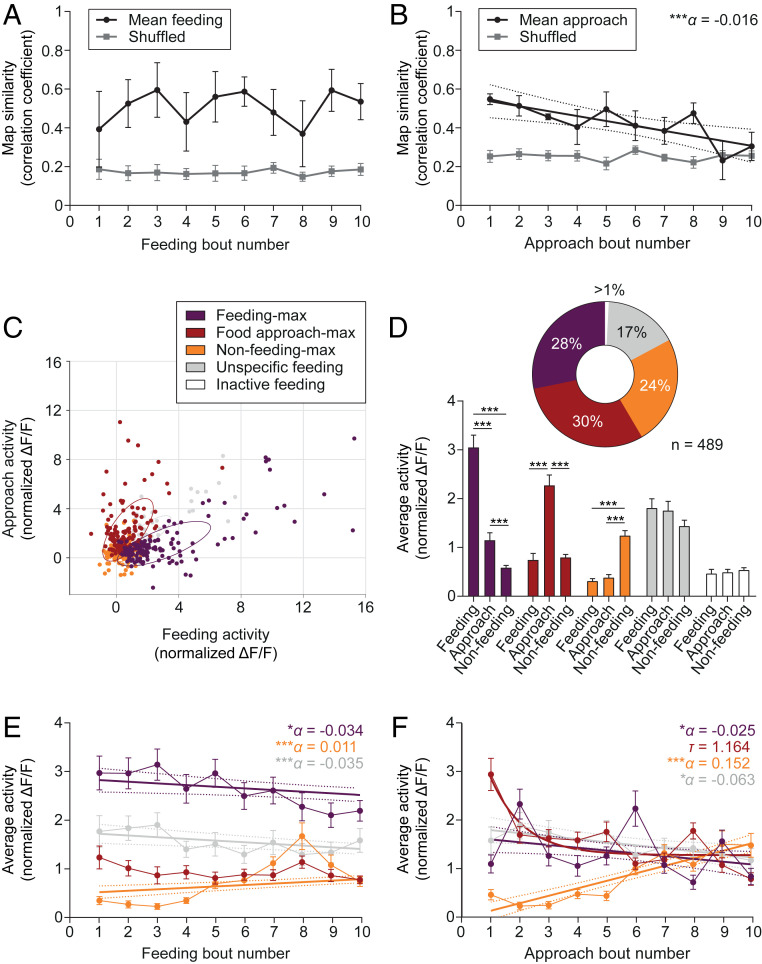
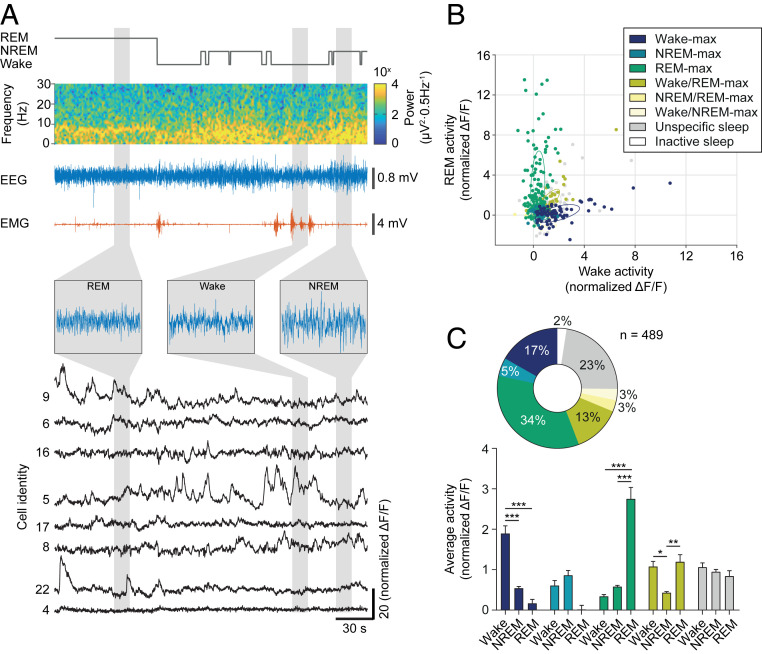
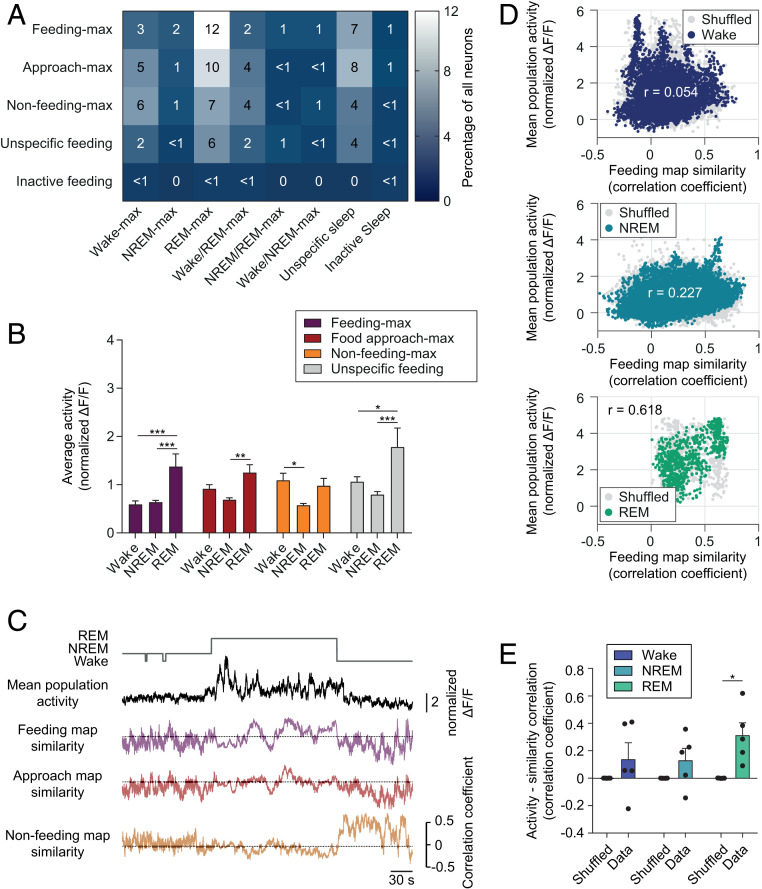
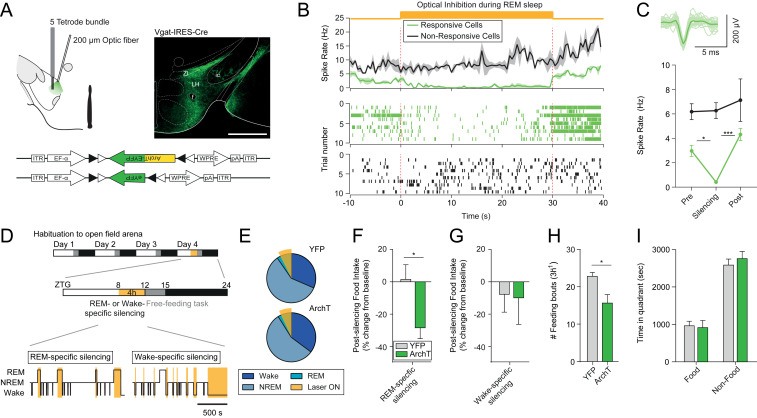
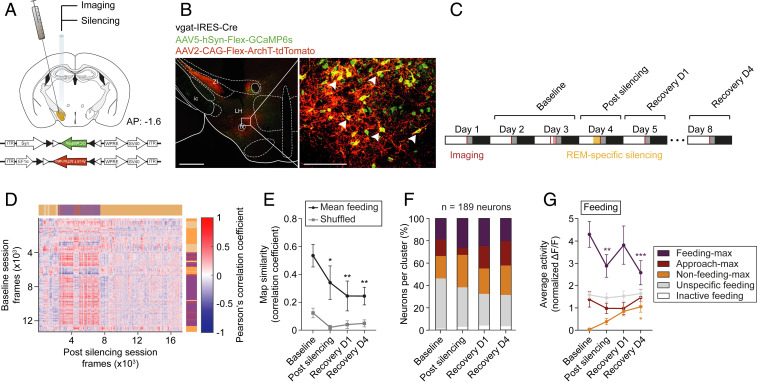
During rapid eye movement (REM) sleep, behavioral unresponsiveness contrasts strongly with intense brain-wide neural network dynamics. Yet, the physiological functions of this cellular activation remain unclear. Using in vivo calcium imaging in freely behaving mice, we found that inhibitory neurons in the lateral hypothalamus (LHvgat) show unique activity patterns during feeding that are reactivated during REM, but not non-REM, sleep. REM sleep-specific optogenetic silencing of LHvgat cells induced a reorganization of these activity patterns during subsequent feeding behaviors accompanied by decreased food intake. Our findings provide evidence for a role for REM sleep in the maintenance of cellular representations of feeding behavior.

Keywords: REM sleep; calcium imaging; feeding; lateral hypothalamus; optogenetics.


Conflict of interest statement

The authors declare no competing interest.

Figures

Fig. 1.
Fig. 1.
Feeding is reliably encoded by LHvgat neurons. (A) Schematic (Left) showing LH injection of Cre-dependent AAV in vgat-IRES-Cre mice. Following cre-dependent local virus transfection, the GCaMP6s cassette is flipped in LHvgat allowing transcription and long-term expression in the LH (Lower). Illustration of the chronic GRIN lens implantation and imaging using a miniature fluorescence microscope in freely moving mice (Right). (B) Photomicrograph of cell-specific expression of GCaMP6s in the LH from vgat-IRES-Cre mice 4 wk after virus injection (Left). Right shows enlargement of the white box highlighted in Left. fx, fornix; ic, internal capsule; LH, lateral hypothalamus; ZI, zona incerta. (C) Representative field of view from imaging of LHvgat neurons with the miniature microscope (Left). Bright cellular structures and dark blood vessels are readily visible. Arrows indicate the body axes (A-P, anterior-posterior; M-L, medial-lateral). Cells were identified using the CNMF-E algorithm (Right). Note that the single cell activity was longitudinally recorded across multiple experimental sessions. (Scale bars, B, Left, 500 µm; B, Right, 50 µm; C, 100 µm.) (D) Experimental timeline. White and dark boxes represent light and dark phase, respectively. (E) An open field arena was divided into four quadrants, which contained either food, bedding, or nesting material or were left empty. Animals were video-tracked and feeding (purple, Left), food-approach (red, Center), and nonfeeding (orange, Right) behaviors were visually scored. (F) Representative recording of calcium transients from GCaMP6-expressing LHvgat cells across feeding behavior (color-coded, Upper) acquired at 10 frames per second. Eight single-cell recordings are shown (black, Lower). (G) Schematic illustration of the concept of neural activity-pattern similarity. Note that the number of neurons (circle) with high (green), intermediate (yellow), or no activity (gray) is the same for all of the three frames displayed, while their activity patterns show high (Right) or low (Left) similarity. (H) Matrix of activity-pattern similarity obtained from cross-correlation of the population vectors at all different time points (i.e., imaging frames) with each other. (I) Representative similarity matrix for a single animal across free-feeding episodes (color-coded bar, Upper). Note the presence of similar activity patterns across consecutive feeding bouts. (J) Hierarchical clustering of data shown in I. The activity patterns grouped into “feeding” (black) and “nonfeeding” (gray) clusters as shown on the dendrogram. The pie charts (Upper) indicate the behavior that was observed when the respective activity patterns occurred. The sorted similarity matrix is shown at the bottom. The clustering is significant, permutation test, P < 0.001. (K) Mean percentage − SEM of LHvgat neuron activity patterns in the cluster associated with a specific behavior. Note the high specificity of the “feeding” and the “nonfeeding” clusters. (n = 5 animals). (L) Mean percentage − SEM of frames in the cluster corresponding to specific behavior out of total frames for this behavior (n = 5 animals). Note the sensitivity of the respective clusters for the different behaviors.
Fig. 2.
Fig. 2.
Subpopulations of LHvgat neurons simultaneously carry information about current and prior feeding. (A and B) Mean ± SEM population vector similarity over consecutive feeding (A) or food approach (B) bouts during a recording session (black) as compared to 1,000 randomly drawn samples (Shuffled, gray). Similarity was expressed as correlation with the mean feeding or approach vector. The line in B represents a significant linear regression ± 95% CI with slope α (n = 5 animals). ***P < 0.001. (C) Scatter plot showing the average cell activity (normalized ΔF/F) of each LHvgat cell during feeding and food approach behavior. Neurons were classified according to their activity profiles during different behaviors (Methods Summary). Color coding indicates functional clusters. Ellipses represent the mean-centered covariance of the clusters for feeding and food approach behaviors. Note that the graph was projected to the two axes of largest variance. (D) Mean + SEM cell activity (normalized ΔF/F) of GCaMP6s-expressing LHvgat neurons within the different clusters. The pie chart summarizes the classification (n = 489 cells from 5 animals, Upper). Two-way RM ANOVA, FCluster(4, 484) = 11.70, FCluster x Behavior(8, 968) = 13.76, with Tukey’s post hoc test, ***P < 0.001. (E and F) Mean ± SEM cell activity (normalized ΔF/F) of LHvgat neurons over consecutive feeding E or food approach F bouts by functional cluster (n = 489 cells from 5 animals). Straight lines indicate significant linear regressions ± 95% confidence interval with slope α for different clusters. Note that the activity of food approach-max neurons in F shows a rapid exponential decay with half-life τ. *P < 0.05, ***P < 0.001.
Fig. 3.
Fig. 3.
LHvgat neurons show high activity during wakefulness and REM sleep. (A) Representative recording of EEG, EMG, and calcium transients from GCaMP6s-expressing LHvgat neurons across sleep–wake states in freely behaving mice. Hypnogram (gray), EEG spectrogram (colormap), EEG (blue), and EMG (red) traces are shown. Insets show extended EEG traces for the different sleep–wake states. Calcium transients for neurons identical to Fig. 1F are displayed (black). (B) Scatter plot shows the average activity (normalized ΔF/F) of each LHvgat cell during wakefulness and REM sleep. Neurons were classified according to their activity profiles during different sleep stages (Methods Summary). Color coding indicates cluster identity. Ellipses represent the mean-centered covariance of the clusters for wakefulness and REM sleep. Note that the graph was projected to the two axes of largest variance. (C) Mean + SEM cell activity (normalized ΔF/F) of GCaMP6-expressing LHvgat neurons within the different clusters encoding sleep and wake states (Lower). The pie chart summarizes the classification of LHvgat neurons (n = 489 cells from 5 animals, Upper). Two-way RM ANOVA, FCluster (4, 440) = 3.97, FState(2, 880) = 5.02, FCluster x State(8, 880) = 37.78, with Tukey’s post hoc test, *P < 0.05, **P < 0.01, ***P < 0.001.
Fig. 4.
Fig. 4.
Feeding-like population activity patterns are associated with high activity during REM sleep. (A) Coclassification matrix of LHvgat neurons during sleep–wake states and food-directed behaviors. Color coding and numbers represent the percentage of neurons for the corresponding clusters (n = 489 cells from five animals). (B) Mean + SEM cell activity of the functional clusters for feeding behaviors during the different sleep stages. Note the high activation of feeding-max cells during REM sleep, as compared to wakefulness or NREM sleep. Two-way RM ANOVA, FCluster(2, 962) = 20.90, FCluster x State(6, 962) = 2.16, followed by the Tukey’s post hoc test, *P < 0.05, **P < 0.01, ***P < 0.001. (C) Representative traces of overall population activity (black) in comparison to map similarity for feeding behaviors (in respective color) over sleep and wake episodes. (D) Representative scatter plots show the relationship between feeding similarity and population activity during wakefulness (Top), NREM (Middle) and REM sleep (Bottom). Colored dots represent the true data while for gray dots the population activity was shuffled 1,000 times, r indicates the Pearson correlation coefficient for the true data. (E) Mean + SEM feeding similarity – activity correlation for true and shuffled data (n = 5 animals). Two-way RM ANOVA, FShuffle(1, 8) = 17.10, followed by the Sidak’s post hoc test, *P < 0.05.
Fig. 5.
Fig. 5.
Optogenetic silencing of LHvgat neurons during REM sleep, but not wakefulness, decreases food intake. (A) Schematic of optogenetic targeting and tetrode recordings from freely moving mice (Left). Photomicrograph shows cell-specific expression of ArchT in the LH of vgat-IRES-Cre mice (Right). LHvgat neurons were transfected to either express ArchT-eYFP (test group) or eYFP only (control group, Lower). fx, fornix; ic, internal capsule; LH, lateral hypothalamus; ZI, zona incerta. (Scale bar, 500 μm.) (B) Average spike rate ± SEM of light-responsive and nonresponsive single units from the LH (Top). Continuous light illumination (532 nm, orange shading) was delivered for 30 s during REM sleep. Raster plots from a representative light-responsive (Middle) and a nonresponsive (Bottom) unit are shown across the illumination period. (C) Average waveform of a responsive unit (Upper). The mean spike rate of the light-responsive (n = 8 cells) and nonresponsive (n = 10 cells) units before, during, and after the silencing is shown (Lower, n = 4 animals). Two-way RM ANOVA, FResponsive(1, 16) = 12.69, FStim(2, 32) = 7.24, FResponsive x Stim(2, 32) = 3.49 with Tukey’s post hoc test, *P < 0.05, ***P < 0.001. (D) Timeline of optogenetic silencing experiment (Top). Mice were habituated to the open field arena for 3 d prior to testing. Online optogenetic silencing (Middle) was conducted between zeitgeber (ZTG) 8 and 12, and food-directed behaviors were quantified in a free-feeding task over the next 3 h (ZTG 12–15). Continuous optical stimulation (orange shading) was delivered selectively during REM sleep (Bottom Left) or wake (Bottom Right) episodes to silence LHvgat neurons in a state-specific manner. (E) Average percentage of vigilance states during the REM-specific optogenetic silencing experiment for YFP control (n = 8 animals, Upper) and ArchT (n = 8 animals, Lower) mice. The orange shading indicates total optogenetic stimulation time during REM sleep. Two-way ANOVA, P > 0.05. (F) Average postsilencing food intake change ± SEM after REM sleep-specific silencing in YFP control (gray, n = 8 animals) and ArchT (green, n = 8 animals) mice. Student’s unpaired t test, t14 = 2.68, *P < 0.05. (G) Average postsilencing food intake change − SEM after wake-specific silencing in YFP control (gray, n = 5 animals) and ArchT (green, n = 7 animals) mice. Student’s unpaired t test, P > 0.05. (H) Average feeding frequency + SEM over the free-feeding task following optogenetic silencing during REM sleep in YFP control (gray, n = 6 animals) and ArchT (green, n = 5 animals) mice. Student’s unpaired t test, t9 = 3.05, *P < 0.05. (I) Average time + SEM spent in food and nonfood quadrants of the open field arena after REM sleep-specific silencing for YFP control (gray, n = 6 animals) and ArchT (green, n = 5 animals) mice. Two-way ANOVA, FZone(1, 8) = 2.60, with Sidak’s post hoc test, P > 0.05.
Fig. 6.
Fig. 6.
Optogenetic silencing of LHvgat neurons during REM sleep induces long-term changes in the feeding map. (A) Schematic of genetic cotargeting of GCaMP6s and ArchT-tdTomato to the LH of vgat-IRES-Cre mice for calcium imaging and optogenetic silencing, respectively. Animals were implanted with a GRIN lens for silencing and recording. The GCaMP6s and ArchT-tdTomato expression cassettes are shown on the bottom. (B) Photomicrograph of long-term cell-specific expression of GCaMP6s (green) and ArchT-tdTomato (red) in the LH from vgat-IRES-Cre mice (Left). Right shows enlargement of the white box highlighted in Left; the arrows show GCaMP6s/ArchT-tdTomato double-expressing LHvgat neurons. fx, fornix; ic, internal capsule; LH, lateral hypothalamus; ZI, zona incerta. (Scale bars: Left, 500 µm; Right, 100 µm.) (C) Timeline of optogenetic silencing and calcium recording, concomitant to EEG/EMG measurements for up to eight consecutive days. (D) Representative REM sleep population vector correlation matrix before (rows, vertical) and immediately after REM sleep-specific optogenetic silencing (columns, horizontal). Video-tracked and scored behaviors are indicated using color coding. Note that the matrix is not square because the sessions contain a different number of frames. (E) True average population vector similarity (black) and shuffled (gray) ± SEM between the feeding vectors across experimental timeline (n = 5 animals). Two-way RM ANOVA, FSession(3, 12) = 4.23, FShuffle(1, 4) = 10.38 with Dunnett’s post hoc test against baseline, *P < 0.05, **P < 0.01. (F) Bar graph shows the classification of imaged neurons across experimental timeline (n = 5 animals). (G) Average activity ± SEM of the different functional clusters across the experimental timeline for feeding behavior. Two-way RM ANOVA, FCluster(3, 183) = 20.4, FCluster x Session(9, 549) = 3.28 with Dunnett’s post hoc test against baseline, *P < 0.05, **P < 0.01, ***P < 0.001.

References

    1. Li W., Ma L., Yang G., Gan W.-B., REM sleep selectively prunes and maintains new synapses in development and learning. Nat. Neurosci. 20, 427–437 (2017). - PMC - PubMed
    1. Del Rio-Bermudez C., Kim J., Sokoloff G., Blumberg M. S., Theta oscillations during active sleep synchronize the developing rubro-hippocampal sensorimotor network. Curr. Biol. 27, 1413–1424.e4 (2017). - PMC - PubMed
    1. Poe G. R., Nitz D. A., McNaughton B. L., Barnes C. A., Experience-dependent phase-reversal of hippocampal neuron firing during REM sleep. Brain Res. 855, 176–180 (2000). - PubMed
    1. Boyce R., Glasgow S. D., Williams S., Adamantidis A., Causal evidence for the role of REM sleep theta rhythm in contextual memory consolidation. Science 352, 812–816 (2016). - PubMed
    1. Diekelmann S., Born J., The memory function of sleep. Nat. Rev. Neurosci. 11, 114–126 (2010). - PubMed

Publication types

Substances