. 2020 Jul 30;11(1):3798.
doi: 10.1038/s41467-020-17291-5.

A molecular map of murine lymph node blood vascular endothelium at single cell resolution

Affiliations

A molecular map of murine lymph node blood vascular endothelium at single cell resolution

Kevin Brulois et al. Nat Commun. .

Abstract

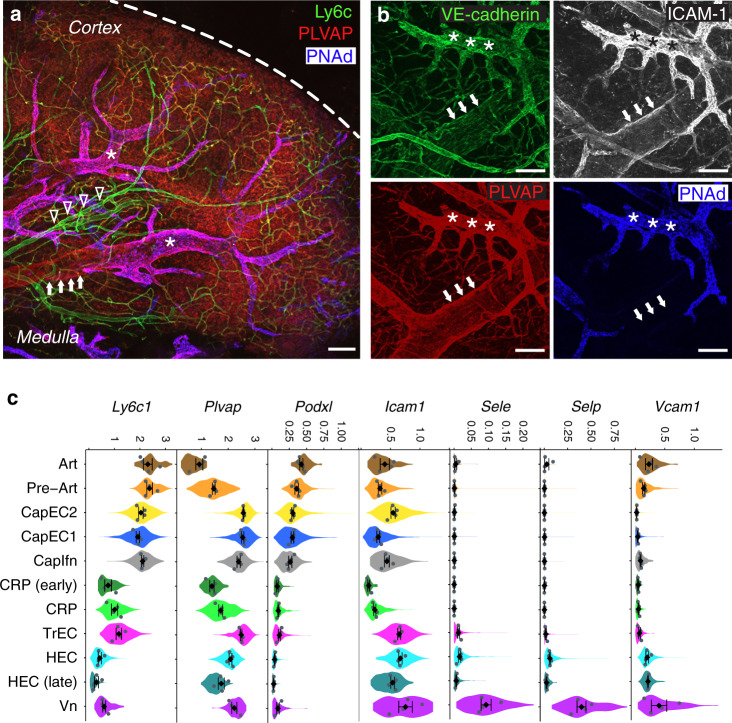
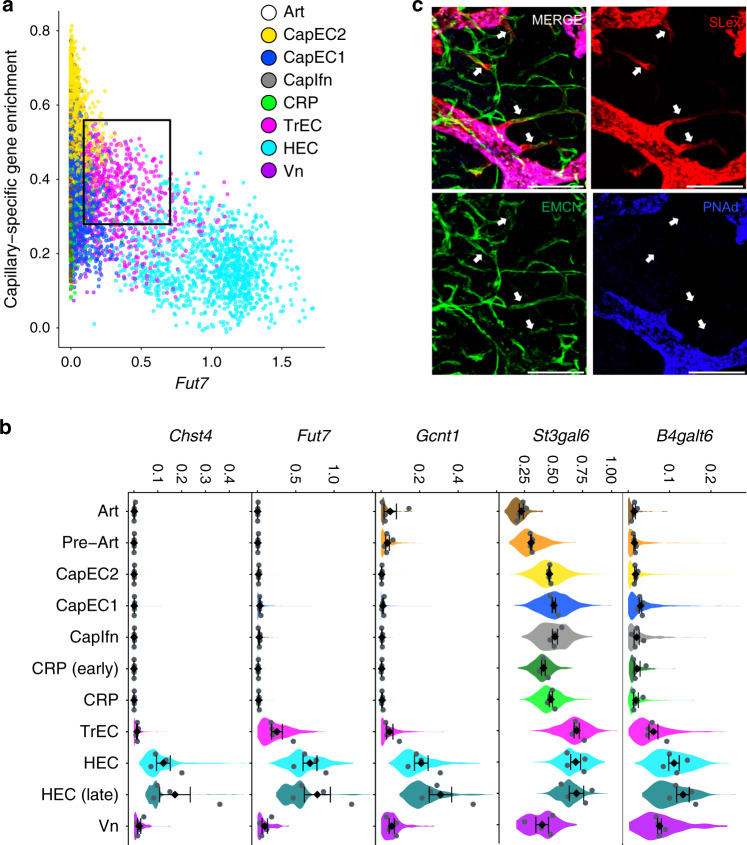
Blood vascular endothelial cells (BECs) control the immune response by regulating blood flow and immune cell recruitment in lymphoid tissues. However, the diversity of BEC and their origins during immune angiogenesis remain unclear. Here we profile transcriptomes of BEC from peripheral lymph nodes and map phenotypes to the vasculature. We identify multiple subsets, including a medullary venous population whose gene signature predicts a selective role in myeloid cell (vs lymphocyte) recruitment to the medulla, confirmed by videomicroscopy. We define five capillary subsets, including a capillary resident precursor (CRP) that displays stem cell and migratory gene signatures, and contributes to homeostatic BEC turnover and to neogenesis of high endothelium after immunization. Cell alignments show retention of developmental programs along trajectories from CRP to mature venous and arterial populations. Our single cell atlas provides a molecular roadmap of the lymph node blood vasculature and defines subset specialization for leukocyte recruitment and vascular homeostasis.


Conflict of interest statement

The authors declare no competing interests.

Figures

Fig. 1
Fig. 1. Single-cell survey of lymph node blood vessel endothelial cells.
a Workflow schematic. Lymph nodes from adult mice are pooled and dissociated into single cells. Fluorescence activated cell sorting (FACS) is used to isolate blood endothelial cells. scRNAseq (×10 Chromium) is used to profile the cells. Representative FACS plot. b Lymph node schematic depicting the eight major subsets identified by scRNAseq analysis. c Heatmap of expression of the top 50 differentially and specifically expressed genes for each subset are shown. Subset, sample, and cohort are annotated across the top and select genes on the right. d UMAP plot of 8832 single cells from three samples (four cohorts). Cells are segregated by type: arterial EC (pre-Art), high endothelial cells (HEC), non-HEC veins (Vn), and five capillary phenotype EC (CapEC1, CapEC2, capillary resident progenitors (CRP), transitional EC (TrEC), Interferon-stimulated gene-enriched CapEC (CapIfn). e Computationally predicted relationships visualized in PCA projection of cells aligned in trajectory space using cells from PLN1. Clusters extending to the termini of the arterial, CRP, and HEV branches were further subdivided to distinguish cells most distinct (distant along trajectories) from the bulk of EC (CRP (early), Art, HEC (late; darker shadings). Interactive rendering available: https://stanford.io/2qzJ8Hl. f Selected marker and signature genes for each of the indicated clusters and combinations of clusters (top). Mean expression values from three samples and four cohorts (color scale). g Total transcript counts (UMI; unique molecular identifiers) per cell within each subset. Violins show the UMI distribution of all cells. Mean expression values for each of the four independent cohorts (gray dots) and mean and standard error (SEM) of the cohort means are also plotted (black diamonds, bars).
Fig. 2
Fig. 2. Marker gene expression and immunolocalization of the major arterial and venous populations.
Immunofluorescent visualization of PLN vessels using intravenously (i.v.) injected antibodies: anti-Ly6c (green), anti-PLVAP (red), and anti-PNAd (blue). Dashed line, lymph node capsule (a); anti-VE-cadherin (green), anti-ICAM-1 (white), anti-PLVAP (red), and anti-PNAd (blue) (b). Arrow heads, artery (Ly6c+ PNAd, PLVAP, ICAM1low). Arrows, medullary veins (PNAd, ICAM1+, PLVAP+, Ly6c). Medullary veins are downstream of HEC. Asterisks, HEV (PNAd+). Bars, 100 μm. Dotted line, medullary vein. Images representative of three independent experiments. c Violin plots showing expression of genes Ly6c1, Plvap, Podxl, and Icam1 corresponding to immuno-stained marker proteins; and Sele, Selp and Vcam1 illustrating selective expression by non-HEV vein. Note the decline in Podxl expression from artery to pre-Art to capillary EC subsets, and a corresponding decline in intensity of staining for Ly6c1 as arteries bifurcate into capillaries in situ in a. Mean expression values for each of the four independent cohorts (grey dots) and mean and SEM of the cohort means are also plotted (black diamonds) within the violin plots.
Fig. 3
Fig. 3. Medullary veins recruit myeloid cells but not lymphocytes in acute inflammation.
In situ lymphocyte and myeloid cell recruitment in HEV versus medullary veins of S. aureus infected LysMGFP mice. a Pooled expression values of genes from the indicated GO terms (color scale) plotted along the tSpace projection from Fig. 1e. b Experimental protocol for S. aureus injection and visualization of lymphocyte and myeloid cell trafficking in LN. LysMGFP recipients received 2.5 × 107S. aureus in the footpad. One hour later mice were injected i.v. with CMTPX-labeled lymphocytes (red). The draining LN was imaged from 2–4 h post infection using two-photon videomicroscopy. c Schematic depicting the location of HEV and medullary veins visualized. d Representative fields of view from 2 photon videomicroscopy of a LN from mice treated according to (b). Myeloid cells (green) and lymphocytes (red; arrow heads) arrested in HEV (upper panel) or medullary vein (lower panel). HEV, identified by injection of red fluorescent anti-PNAd at a non-blocking concentration immediately prior to sacrifice, are readily distinguished from migrating lymphocytes and from PNAd medullary veins. Venular lumen is highlighted by Dylight-680 labeled albumin (cyan). Bars, 20 um. e Quantification of lymphocyte and myeloid cells adherent to HEV and medullary veins. n = 34 fields of view (FOV) for HEV and 8 FOV for veins from a total of four mice. Data shown as mean ± SEM. Statistically significant differences were determined using a two-way ANOVA test corrected with Tukey. f Inhibition of myeloid cell accumulation in medullary veins by antibody blockade of P- and E- selectin. Test or isotype control antibodies were injected i.v. 20 min before footpad S. aureus infection in LysMGFP mice, and draining LN visualized 2 h post infection. Myeloid cell (GFP+) adhesion to medullary veins was quantified from 24–47 FOV of popliteal LN over 2 h of imaging. Each point represents an average of the values collected from one mouse. n = 5 mice for isotype, n = 3 mice for all other groups. Data shown as mean ± SEM. A one-tailed t-test was used for comparisons to the Isotype. A two-tailed t-test was used to compare Anti-P-selectin and Anti-E + P-selectin.
Fig. 4
Fig. 4. Transitional phenotype capillary EC occupy capillary-HEC junctions.
a Scatter plot of cells showing Fut7 expression by capillary EC defined by an enrichment score for capillary-specific genes. Cells colored by major cell type. b Immunofluorescence image of PLN with intravenously injected anti-SLex (red), anti-PNAd (blue), and anti-capillary (EMCN; green) antibodies. Scale bar 100 µm. Arrows point to Slex+ EMCN+ PNAd TrEC. Images representative of three independent experiments. c Expression of Chst2, Fut7, Gcnt1, St3gal6, B4galt6 in the BEC subsets. Violins show the expression distribution of all cells. Mean expression values for each of the four independent cohorts (grey dots) and mean and SEM of the cohort means are also plotted (black diamonds).
Fig. 5
Fig. 5. Stem cell features, markers and immunolocalization of a capillary resident regenerative population (CRP).
a Expression of selected stem or progenitor cell-related genes. b Signaling entropy rate (entropy) for each BEC subset. Highest 1% of all BEC, dashed box. High entropy cells are enriched in early CRP. c tSpace projection from Supplementary Fig. 1d with all cells. CRP, green. High Entropy cells (top 1% as gated in (b)) are black. Other cells, gray. Interactive rendering available: https://stanford.io/2WXR811 d Percent of each BEC subset classified as dividing based on pooled expression of cell-cycle genes. Points represent values for individual samples. Diamonds, average of all samples. Error bars, standard error of the mean. n = 3 biologically independent samples. e Phenotype of dividing cells presented as percent of dividing cells with the indicated BEC phenotypes. Error bars, standard error of the mean. n = 3 biologically independent samples. f Experimental timeline for (g) and (h). g Quantification of ER+ endothelium by immunofluorescence histology in resting (day 0) PLN and in PLN 5 days after cutaneous inflammation. Expressed as ER+ capillaries (PODXL+ or MCAM+ PNAdEC) or ER+ HEV (PNAd+) as percent of capillary EC or HEC units (arbitrary units of length) scanned. No ER+ HEC were detected out of over 5000 scanned in resting and over 5000 in inflamed PLN. 95% CL are shown as error bars or indicated. For each group, nine lymph nodes from two mice were enumerated. Each datum is from a given LN. Statistically significant differences were determined using a Kruskal-Wallis test and Dunn’s multiple comparisons test. 95% confidence limits are shown as error bars or indicated above HEC. h Representative images of resting PLN from AplnCreER mice stained with anti-PNAd (yellow), anti-PODXL (red), anti-ER (green) and intravenously injected anti-MCAM (blue). Arrow heads point to ER+ CRP. Bars, 50 μm. Images representative of three independent experiments. i Images of resting PLN (72 h post 4-OHT) from AplnCreER, mTmG mice stained with injected anti-CXCR4 (blue), anti-CD276 (white) and anti-EMCN (red). Arrow heads point to GFP+ cells in capillaries. Bars, 20 µm. Images representative of three independent experiments.
Fig. 6
Fig. 6. Lineage tracing of AplnERTCre-expressing capillary EC.
a Experimental protocol. b Representative images of Apln-driven reporter expression (GFP) in PLN from Apln-CreER x R26-mTmG mice at rest (upper) and three and half weeks post-immunization with CFA (lower panel). EC subsets were labeled by i.v. injection of the indicated antibodies 10–20 min before sacrifice: PNAd (blue), MCAM (magenta). Arrow heads, capillaries. Arrows, HEV. Bars, 50 µm.
Fig. 7
Fig. 7. Trajectories align EC subsets and mechanisms of EC development and specification to the vasculature.
a Cells along KNN-based trajectories were isolated (Methods). be Expression of selected genes and gene set enrichment scores along cell trajectories from mature CRP to Art (plotted leftward), and from CRP to HEC or Vn (rightward). Cells along the trajectories were manually gated in the first five principal components of trajectory space and aligned according to distance from early CRP. Representation of cell types along the trajectories is indicated at top. Normalized count data plotted as a function of trajectory distance was smoothed using a gaussian kernel. Trajectory distances were scaled to the longest trajectory (CRP to HEC). Genes were grouped according to biological class or function. Imputed gene expression values for all cells (without duplications) were calculated independently and used for hierarchical clustering within each gene group. Cxcr4, Cxcl12, and Ackr3 are shown as a separate group at the top in c (see results). Average normalized expression values for the min and max subset are indicated to the right of each heatmap. OSS: pooled expression of oscillatory shear stress genes: Egr1, Nfkbia, Junb, Cxcl1. Cell Division: pooled expression of cell-cycle genes.

References

    1. Anderson AO, Anderson ND. Studies on the structure and permeability of the microvasculature in normal rat lymph nodes. Am. J. Pathol. 1975;80:387–418. - PMC - PubMed
    1. Kumar V, et al. Global lymphoid tissue remodeling during a viral infection is orchestrated by a B cell-lymphotoxin-dependent pathway. Blood. 2010;115:4725–4733. - PubMed
    1. Chyou S, et al. Coordinated regulation of lymph node vascular–stromal growth first by CD11c+ cells and then by T and B cells. J. Immunol. 2011;187:5558–5567. - PMC - PubMed
    1. Mondor I, et al. Clonal proliferation and stochastic pruning orchestrate lymph node vasculature remodeling. Immunity. 2016;45:877–888. - PubMed
    1. Rossi‐Schneider TR, Verli FD, Marinho SA, Yurgel LS, Souza MALD. Study of intussusceptive angiogenesis in inflammatory regional lymph nodes by scanning electron microscopy. Microsc. Res. Tech. 2010;73:14–19. - PubMed

Publication types

MeSH terms