. 2020 Jul 30;11(7):601.
doi: 10.1038/s41419-020-02813-2.

Long non-coding RNA MIR22HG promotes osteogenic differentiation of bone marrow mesenchymal stem cells via PTEN/ AKT pathway

Affiliations

Long non-coding RNA MIR22HG promotes osteogenic differentiation of bone marrow mesenchymal stem cells via PTEN/ AKT pathway

Chanyuan Jin et al. Cell Death Dis. .

Abstract

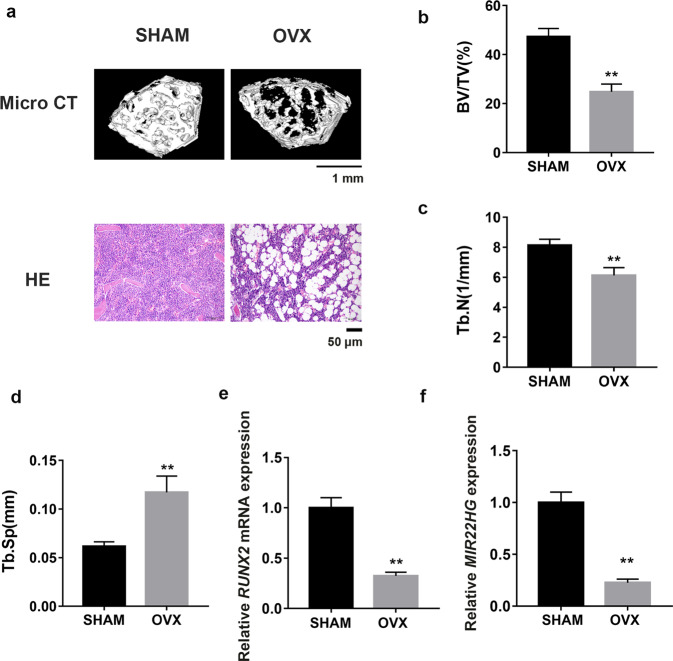
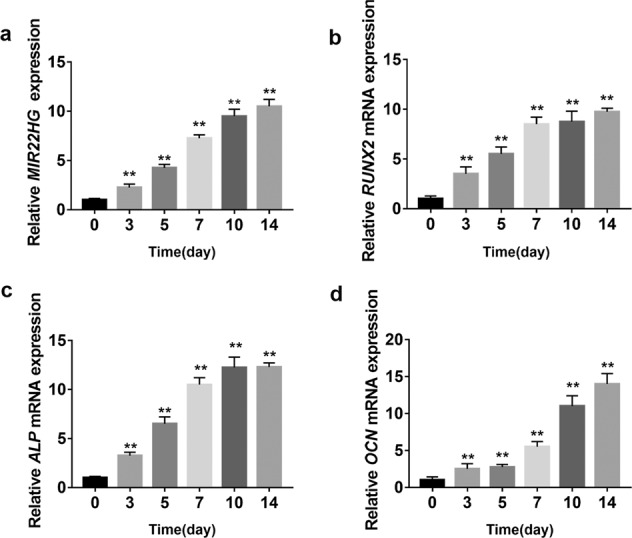
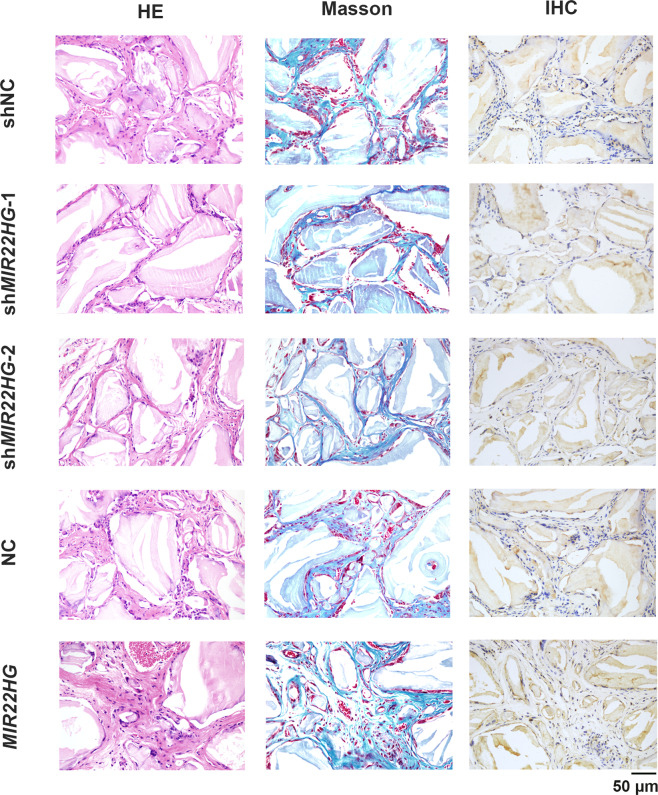
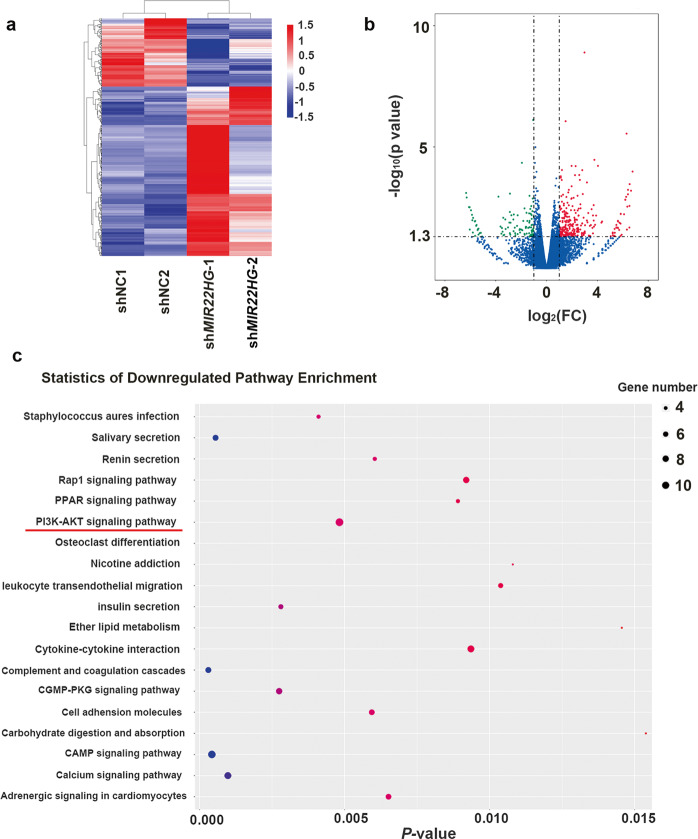
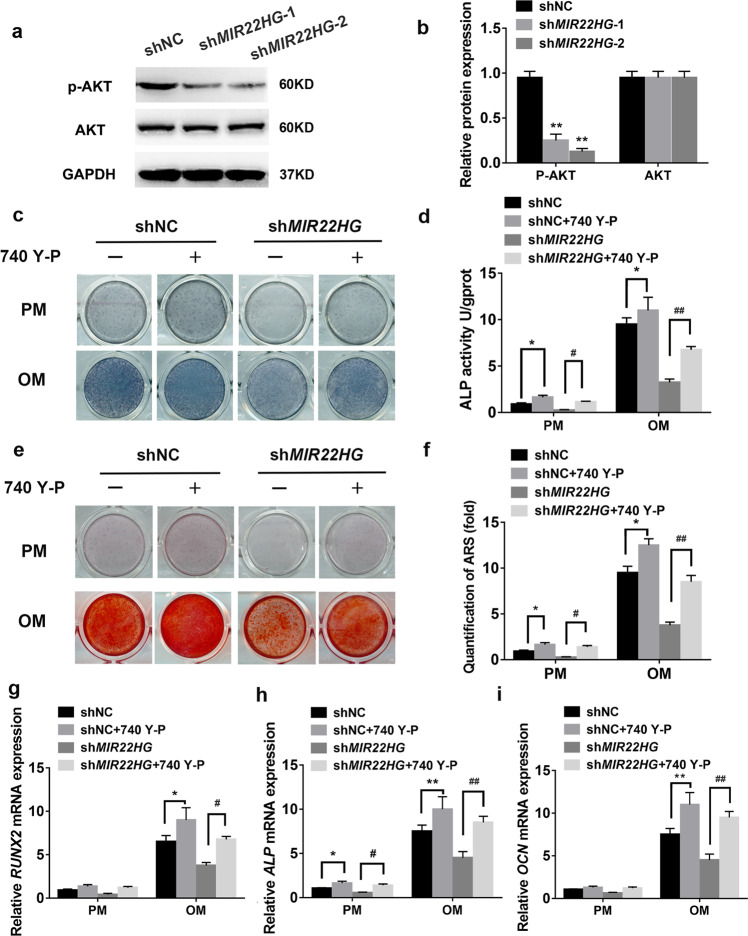
Osteoporosis is a prevalent metabolic bone disease characterized by low bone mineral density and degenerative disorders of bone tissues. Previous studies showed the abnormal osteogenic differentiation of endogenous bone marrow mesenchymal stem cells (BMSCs) contributes to the development of osteoporosis. However, the underlying mechanisms by which BMSCs undergo osteogenic differentiation remain largely unexplored. Recently, long non-coding RNAs have been discovered to play important roles in regulating BMSC osteogenesis. In this study, we first showed MIR22HG, which has been demonstrated to be involved in the progression of several cancer types, played an important role in regulating BMSC osteogenesis. We found the expression of MIR22HG was significantly decreased in mouse BMSCs from the osteoporotic mice and it was upregulated during the osteogenic differentiation of human BMSCs. Overexpression of MIR22HG in human BMSCs enhanced osteogenic differentiation, whereas MIR22HG knockdown inhibited osteogenic differentiation both in vitro and in vivo. Mechanistically, MIR22HG promoted osteogenic differentiation by downregulating phosphatase and tensin homolog (PTEN) and therefore activating AKT signaling. Moreover, we found MIR22HG overexpression promoted osteoclastogenesis of RAW264.7 cells, which indicated that MIR22HG played a significant role in bone metabolism and could be a therapeutic target for osteoporosis and other bone-related diseases.


Conflict of interest statement

The authors declare that they have no conflict of interest.

Figures

Fig. 1
Fig. 1. MIR22HG expression was decreased in OVX mice.
a Representative images of Micro CT and HE staining from SHAM and OVX mice indicated the bone loss of OVX mice compared to SHAM mice. Scale bars for Micro CT and HE staining represent 1 mm and 50 μm, respectively. bd Trabecular bone volume/tissue volume (BV/TV), trabecular number (Tb.N), and trabecular spacing (Tb.Sp) were detected in SHAM and OVX mice. e, f Expression levels of RUNX2 and MIR22HG tested in mBMSCs from OVX mice in contrast to SHAM mice, determined by qRT-qPCR. All data are shown as mean ± SD, **P < 0.01, compared with SHAM group.
Fig. 2
Fig. 2. MIR22HG was increased during the osteogenic differentiation of hBMSCs.
a qRT-PCR analysis of MIR22HG during the osteogenic differentiation of hBMSCs. bd Relative mRNA expression levels of RUNX2, ALP, and OCN were detected by qRT-PCR. Results are presented as the mean ± SD, **P < 0.01, normalized by Glyceraldehyde 3-phosphate dehydrogenase (GAPDH), compared with day 0.
Fig. 3
Fig. 3. The role of MIR22HG in osteogenic differentiation of hBMSCs.
a Images of ALP staining in shNC, shMIR22HG-1, shMIR22HG-2, NC, MIR22HG groups. Cells were treated with proliferation medium (PM) or osteogenic medium (OM) for 7 days. b Histogram showing 7d ALP activity. c, d Alizarin Red S (ARS) staining and quantification in shNC, shMIR22HG-1, shMIR22HG-2, NC, MIR22HG groups on day 14. eg Relative mRNA expression levels of RUNX2, ALP, and OCN measured by qRT-PCR on day 14 of osteogenic induction. GAPDH was used for normalization. Results are presented as the mean ± SD, */#p < 0.05, **/##p < 0.01, * compared with shNC, # compared with NC.
Fig. 4
Fig. 4. MIR22HG promoted bone formation of hBMSCs in vivo.
HE staining (HE), Masson’s trichrome staining (Masson), and immunohistochemical staining (IHC) of osteocalcin (OCN) in shNC, shMIR22HG-1, shMIR22HG-2, NC, MIR22HG groups. Scale bar = 50 μm.
Fig. 5
Fig. 5. Differential expression of genes between MIR22HG knockdown and shNC hBMSCs.
a The differentially expressed genes in MIR22HG knockdown hBMSCs were shown in the heat map. p value <0.05 and fold change >2 were set as restrictive conditions to identify the differentially expressed genes. b The differentially expressed genes were counted; among these genes, a total of 278 genes were upregulated and 112 genes were downregulated. c KEGG pathway analysis showed the genes downregulated by MIR22HG knockdown might be related to different pathways, among which the top-ranking enriched pathways were shown.
Fig. 6
Fig. 6. MIR22HG knockdown inhibited AKT signaling.
a The expression levels of total AKT and phosphorylated AKT (p-AKT) in shNC, shMIR22HG-1, and shMIR22HG-2 groups. GAPDH was used as an internal control. b The band intensities of a were analyzed by Image J software. c MIR22HG knockdown (shMIR22HG) and the control (shNC) hBMSCs were treated with proliferation or osteogenic media for 7 days. 740 Y-P (10 μM) or DMSO (control ‘-’) was added to the medium for 7 days and ALP staining was performed. d Histogram showing 7d ALP activity. e Images of Alizarin red S staining (ARS) in shNC, shMIR22HG groups treated with 740 Y-P (10 μM) or DMSO (control ‘-’) for 14 days. f Histograms showing quantification of ARS by spectrophotometry. gi Relative mRNA expression levels of RUNX2, ALP, and OCN on day 14 after osteogenic induction. 740 Y-P (10 μM) was incubated for 14 days. DMSO was used as control. Results are presented as the mean ± SD, */#p < 0.05, **/##p < 0.01, * compared with shNC, # compared with shMIR22HG.
Fig. 7
Fig. 7. MIR22HG overexpression activated AKT signaling.
a The expression levels of total AKT and phosphorylated AKT (p-AKT) in NC, MIR22HG groups. GAPDH was used as an internal control. b The band intensities of a were analyzed by Image J software. c ALP staining in MIR22HG overexpression (MIR22HG) and the control (NC) hBMSCs with or without LY294002 (10 μM) treatment on day 7 of osteogenic induction. DMSO was used as control (-). d Histogram showing 7d ALP activity. e Calcium deposition in NC, MIR22HG groups treated with LY294002 (10 μM) or DMSO (control ‘-’) was observed by Alizarin Red S staining on day 14 of osteogenic induction. f Histograms showing quantification of ARS by spectrophotometry. gi Relative mRNA expression of RUNX2, ALP, and OCN on day 14 after osteogenic induction. LY294002 (10 μM) was incubated for 14 days. DMSO was used as control. Results are presented as the mean ± SD, */#p < 0.05, **/##p < 0.01, * compared with NC, # compared with MIR22HG. LY: LY294002.

References

    1. Sakai, T., Honzawa, S., Kaga, M., Iwasaki, Y. & Masuyama, T. Osteoporosis pathology in people with severe motor and intellectual disability. Brain Dev.42, 256–263 (2020). - PubMed
    1. Tang, C. H. Osteoporosis: from molecular mechanisms to therapies. Int. J. Mol. Sci.21, E714 (2020). - PMC - PubMed
    1. Trivedi, H. D., Danford, C. J., Goyes, D. & Bonder, A. Osteoporosis in primary biliary cholangitis: prevalence, impact and management challenges. Clin. Exp. Gastroenterol.13, 17–24 (2020). - PMC - PubMed
    1. Liu, Q. et al. In vitro cell behaviors of bone mesenchymal stem cells derived from normal and postmenopausal osteoporotic rats. Int. J. Mol. Med.41, 669–678 (2018). - PMC - PubMed
    1. Ma, N., Tie, C., Yu, B., Zhang, W. & Wan, J. Identifying lncRNA-miRNA-mRNA networks to investigate Alzheimer’s disease pathogenesis and therapy strategy. Aging12, 2897–2920 (2020). - PMC - PubMed

Publication types

Substances