. 2020 Jul 30;11(1):3813.
doi: 10.1038/s41467-020-17515-8.

Emerging heterogeneous compartments by viruses in single bacterial cells

Affiliations

Emerging heterogeneous compartments by viruses in single bacterial cells

Jimmy T Trinh et al. Nat Commun. .

Abstract

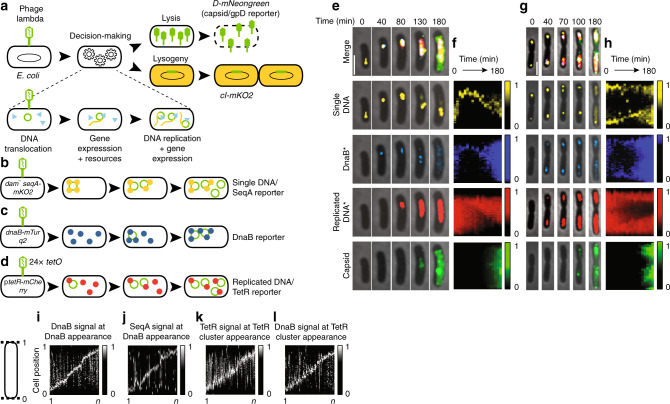
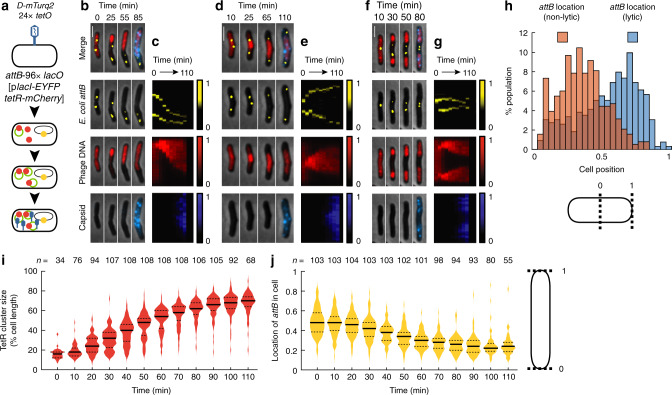
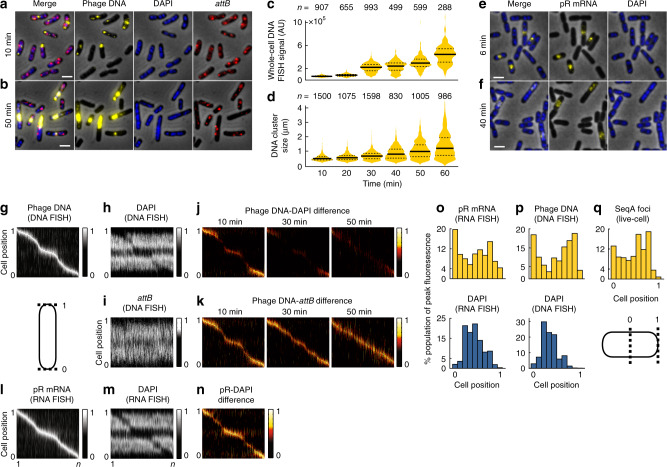
Spatial organization of biological processes allows for variability in molecular outcomes and coordinated development. Here, we investigate how organization underpins phage lambda development and decision-making by characterizing viral components and processes in subcellular space. We use live-cell and in situ fluorescence imaging at the single-molecule level to examine lambda DNA replication, transcription, virion assembly, and resource recruitment in single-cell infections, uniting key processes of the infection cycle into a coherent model of phage development encompassing space and time. We find that different viral DNAs establish separate subcellular compartments within cells, which sustains heterogeneous viral development in single cells. These individual phage compartments are physically separated by the E. coli nucleoid. Our results provide mechanistic details describing how separate viruses develop heterogeneously to resemble single-cell phenotypes.


Conflict of interest statement

The authors declare no competing interests.

Figures

Fig. 1
Fig. 1. Phage DNAs organize developmental processes into subcellular locations during infection.
a Combination of phage processes results in decision-making. Lytic decisions reported by a D-mNeongreen translational fusion and lysogenic decisions reported by a cI-mKO2 transcriptional fusion. b SeqA system detects single molecules of phage DNA. Methylated phages infect dam cells. Phage DNA is bound by SeqA-mKO2 proteins. Only phage DNA retaining methylation is labeled. c DnaB is an essential DNA replication resource. DnaB-mTurquoise2 fusion protein reports localization of DnaB. d Tet system detects replicated phage DNAs. Phage DNA bearing tetO arrays is labeled by TetR-mCherry binding. e Representative infected cell with reporters described in ad undergoes lytic development. Representative cells in e and g chosen from three independent infection experiments. * indicates contrast is adjusted for each time point for clarity. DnaB and replicated DNA fixed contrast images are shown in Supplementary Fig. 2b–e. All scale bars in this figure are 2 μm. f Kymograph of the cell in e. Explanations for data analysis in Supplementary Fig. 1 and Supplementary Discussion. Fluorescence is normalized to the population maximum. g Representative infected, lytic cell with two subcellular areas of development. h Kymograph of the cell in g. Fluorescence is normalized to the population maximum. i DnaB heat maps for lytic cells at their DnaB appearance time point are arranged by the position of DnaB. Cell to the left of i describes how location is represented for il. Fluorescence of each cell is normalized to its own peak brightness for il. n = 91 cells for il. j SeqA heat maps for lytic cells are arranged in the same order and time points as in i to compare SeqA and DnaB. k TetR heat maps for lytic cells at their TetR cluster appearance time point are arranged by the position of TetR. l DnaB heat maps for lytic cells are arranged in the same order and time points as in k to compare DnaB and TetR. Source data are provided as a Source Data file.
Fig. 2
Fig. 2. Organization of multiple heterogeneous subcellular areas during phage induction.
a Schematic for the spatial organization of phage development after induction. Lambda prophage is integrated into the bacterial chromosome, and different copies of the chromosome locate to different areas of the cell during growth. Induction of lysogens forces phages to develop in different areas of the cell. The prophage bears the gpD-mNeongreen lytic reporter and carries a tetO array. The cell harbors a TetR-mCherry plasmid and a DnaB-mTurquoise2 reporter. b Overlay images of lysogens after induction. At 0 min the cells were not yet induced (*indicates that the contrast is adjusted for each time point shown for clarity). All scale bars in this figure are 2 μm. c, d Intracellular areas of phage DNA and DnaB form. Histograms of the number of DnaB (c) and replicated DNA clusters (d) are shown for each time point. e Phage DNA replication varies intracellularly. For cells with more than one DNA cluster, the standard deviation of the size of the clusters is represented in boxplots for each time point, as a measure of intracellular phage DNA variability. The median is indicated by the dot at the center of the box, the box bounds the interquartile range of the data, the whiskers span the range of the data excluding the outliers, and the outliers are indicated as individual points. The approximate limit of our resolution is around 250 nm. Source data are provided as a Source Data file.
Fig. 3
Fig. 3. Bacterial DNA physically separates different intracellular phactories.
a Detection of phage and bacterial DNA locations. Phage carries the Tet reporter as in Fig. 1d and the D-mTurquoise2 lytic reporter. Cell carries a lacO array at its attB locus and bears a plasmid expressing both TetR-mCherry and LacI-EYFP to label phage and bacterial DNA. b, d, f Representative lytic cells with different bacterial DNA interactions. Phage DNA will push (b, 108/179 cells), spread (d, 56/179 cells), or squeeze (f, 15/179 cells) bacterial DNA as phage DNA expands. Representative cells chosen from four independent infection experiments. All scale bars in this figure are 2 μm. c, e, g Kymographs corresponding to the cells in b, d, f. Fluorescence is normalized to the population maximum. h Spatial distribution of bacterial DNA in lytic and non-lytic cells differs. In non-lytic cells, the locations of attB for three time points prior to cell division (orange), and in lytic cells, the location of the attB marker for three time points prior to cell lysis (blue) represent the location preference of bacterial loci in different developmental paths. The cell below shows how locations are represented. n = 653 data points for lytic and 382 data points for non-lytic categories. i, j Expanse of phage DNA pushes bacterial DNA. The sizes of phage DNA in each lytic cell that pushes bacterial DNA are shown as violin plots (i). The maximum (nearest to mid-cell) location of attB of the cells in i are shown as violin plots (j). Cell on the right shows how locations are represented for i, j. Cells were oriented such that the TetR clusters were all aligned toward one direction. In the violin plots, the solid line represents the median, and the dashed lines mark the bounds of the interquartile range of the data. Source data are provided as a Source Data file.
Fig. 4
Fig. 4. Phage transcription and DNA replication are collectively organized within nucleoid-free regions.
a, b DNA FISH labels phage and bacterial DNA. Representative images of DNA FISH experiments targeting phage DNA and attB at 10 min (a) and 50 min (b) post-infection with cells stained with DAPI. Representative cells chosen from six independent infection experiments. All scale bars in this figure are 2 μm. c, d Violin plots of whole-cell phage DNA signal (c) and sizes of phage DNA clusters (d). In the violin plots, the solid line represents the median, and the dashed lines mark the bounds of the interquartile range of the data. e, f RNA FISH labels phage pR transcript at 6 min (e) and 40 min (f) post-infection. Cells stained with DAPI. Representative cells chosen from six independent infection experiments. gi Phage DNA (g), DAPI (h), and E. coli attB (i) heat maps arranged by the location of peak brightness of phage DNA at 10 min post-infection. Cell below (g) shows how locations are represented for gn. Fluorescence of each cell is normalized to its own peak brightness for gi and l, m. n = 907 cells for gi. j, k Phage DNA prefers nucleoid-free locations and avoids attB. j Difference maps (see Supplementary Discussion), calculated as g, h, show contrast in locations of phage DNA and DAPI. Negative values are set to 0. k Difference maps as in j, except showing differences between phage DNA and attB. n for j and k = n of c for each time point. ln Phage mRNA prefers nucleoid-free locations. pR RNA FISH (l) and DAPI (m) heat maps arranged by the location of peak brightness of pR at 15 min post-infection. n Difference map of l, m, similar to jk. n = 2035 for ln. oq Phage DNA and mRNA colocalize away from E. coli DNA. o Histograms of peak location of pR and DAPI from RNA FISH in l, m. p Histograms of peak location of phage DNA and DAPI from DNA FISH (g, h). q Histogram of peak location of SeqA signal from experiments in Fig. 1 (lytic cells, combined first three time points). Cell below (q) shows how locations are represented for oq. Source data are provided as a Source Data file.
Fig. 5
Fig. 5. Individual phage decision-making occurs in separated subcellular locations.
a Colored arrows represent the transcripts targeted by FISH. The arrow direction corresponds to the transcription direction. The colored line segments on the black line mark the approximate locations of the FISH probes relative to the transcripts. b Decision-making transcripts localize to subcellular locations. Representative infected cells at 15 min post-infection with cells DAPI-stained. Representative cells chosen from four independent infection experiments. All scale bars in this figure are 2 μm. c Average pRE FISH signal is plotted against pR signal (Pearson’s ρ in plot, p value <0.001). dg Phages make different decisions in separate subcellular locations. pR transcripts, separated by DAPI clusters, occupy separate areas. Of 2035 cells, 645 have pRE foci. Of 2035 cells, 439 have pRʹ foci. In all, 504/2035 cells have pRE without pRʹ foci. Of 2035, 298 cells have pRʹ without pRE foci. de Representative cells showing lytic decisions in a subset of different locations (75/2035 cells). fg Representative cells showing conflicting lytic/lysogenic decisions in different locations (48/2035 cells). Representative cells chosen from four independent infection experiments. In total, 141/2035 cells have both pRE and pRʹ in the same cell at any locations. h Model of lambda decision-making in subcellular space. Phage DNAs occupy different subcellular areas, separated by bacterial DNA. Phage DNAs undergo gene expression in their locations, consisting of transcription and translation. It is unknown where key proteins localize after detaching from mRNA. Phage DNAs sequester essential DNA replication resources to their own locations. Phage DNA replication transpires where individual DNAs are, and continued transcription remains localized with phage DNA. Individual units remain separated by bacterial DNA and can differ in composition. Expanding phage DNAs physically push bacterial DNA inside the cell. Individual decisions may be enacted by segregated phage DNAs. Source data are provided as a Source Data file.

Similar articles

Cited by

References

    1. Cooke J. The emergence and regulation of spatial organization in early animal development. Annu. Rev. Biophys. Bioeng. 1975;4:185–217. doi: 10.1146/annurev.bb.04.060175.001153. - DOI - PubMed
    1. Munro S. Organelle identity and the organization of membrane traffic. Nat. Cell Biol. 2004;6:469–472. doi: 10.1038/ncb0604-469. - DOI - PubMed
    1. Shapiro L, McAdams HH, Losick R. Why and how bacteria localize proteins. Science. 2009;326:1225–1228. doi: 10.1126/science.1175685. - DOI - PMC - PubMed
    1. Stracy M, Kapanidis AN. Single-molecule and super-resolution imaging of transcription in living bacteria. Methods. 2017;120:103–114. doi: 10.1016/j.ymeth.2017.04.001. - DOI - PMC - PubMed
    1. Parry BR, et al. The bacterial cytoplasm has glass-like properties and is fluidized by metabolic activity. Cell. 2014;156:183–194. doi: 10.1016/j.cell.2013.11.028. - DOI - PMC - PubMed

Publication types

MeSH terms