. 2020 Jul 30;11(1):3811.
doi: 10.1038/s41467-020-17512-x.

Purine metabolism regulates DNA repair and therapy resistance in glioblastoma

Affiliations

Purine metabolism regulates DNA repair and therapy resistance in glioblastoma

Weihua Zhou et al. Nat Commun. .

Abstract

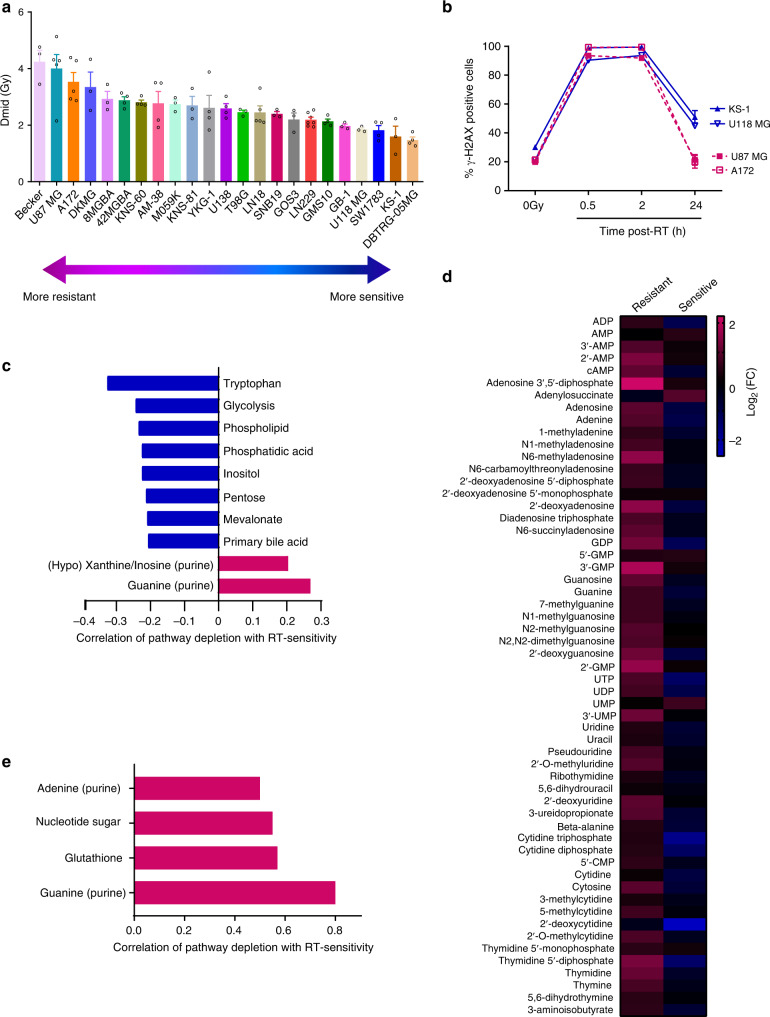
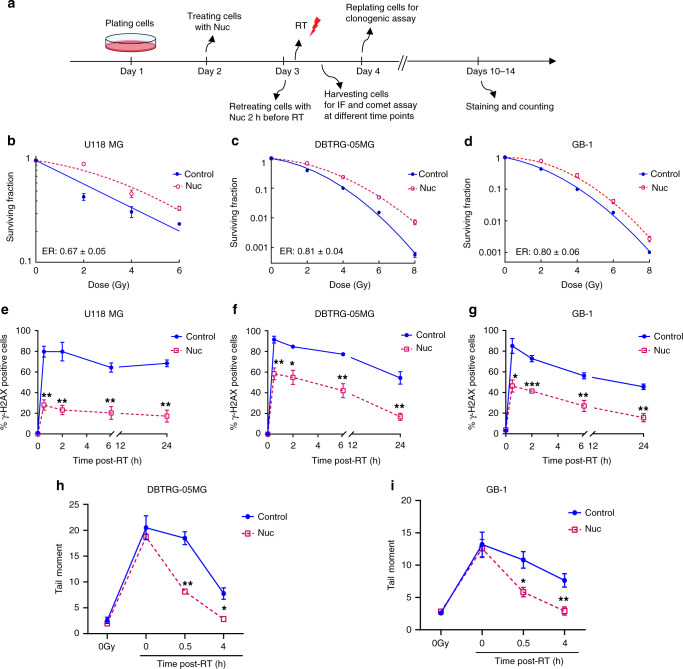
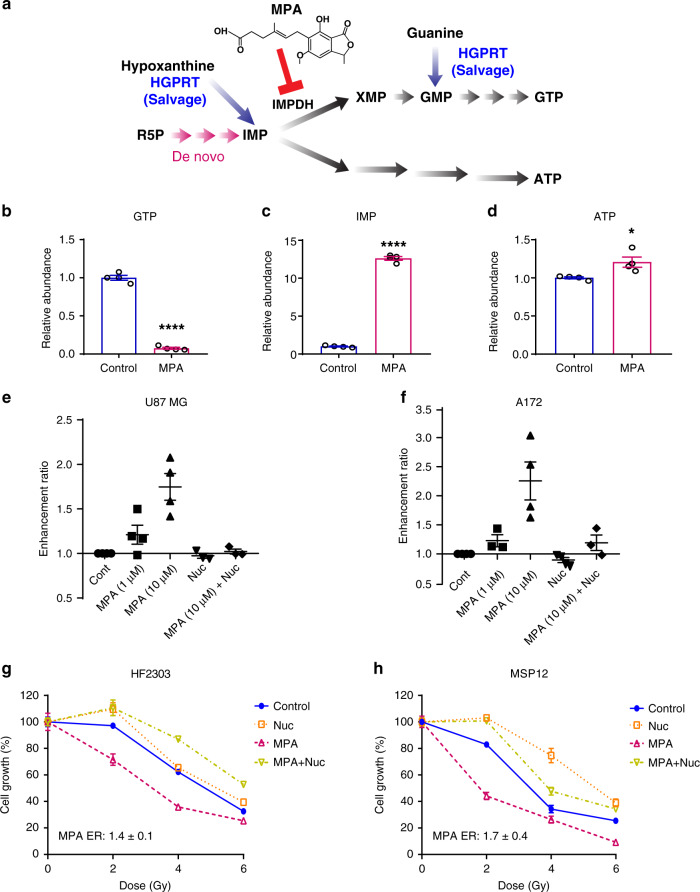
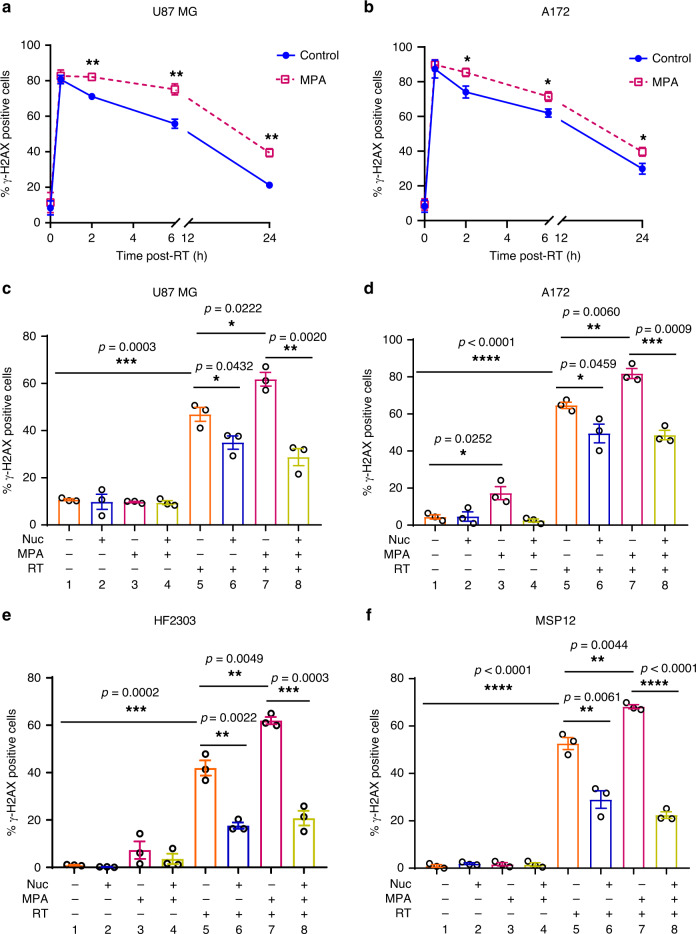
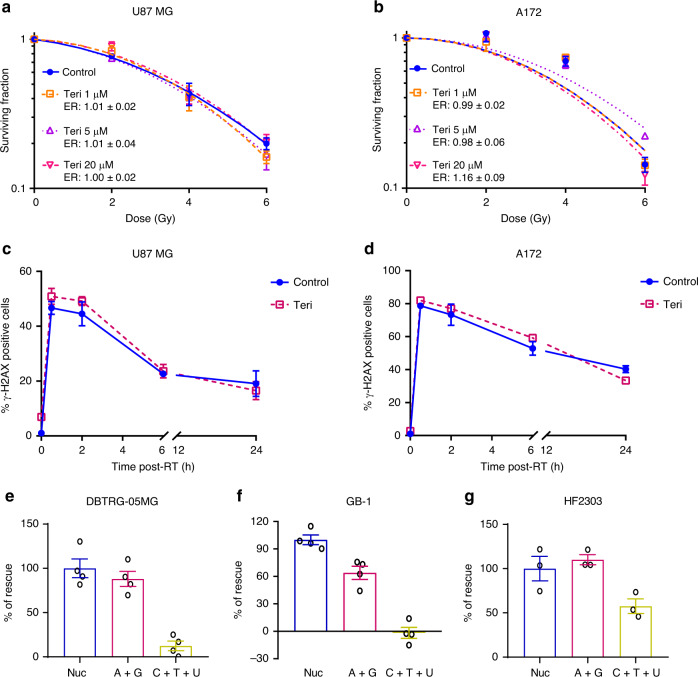
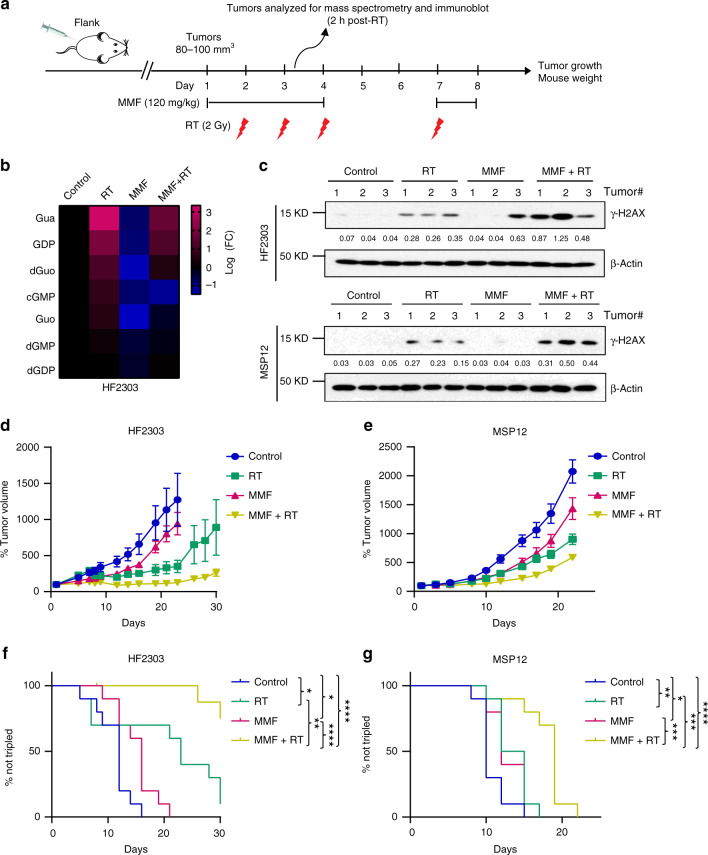
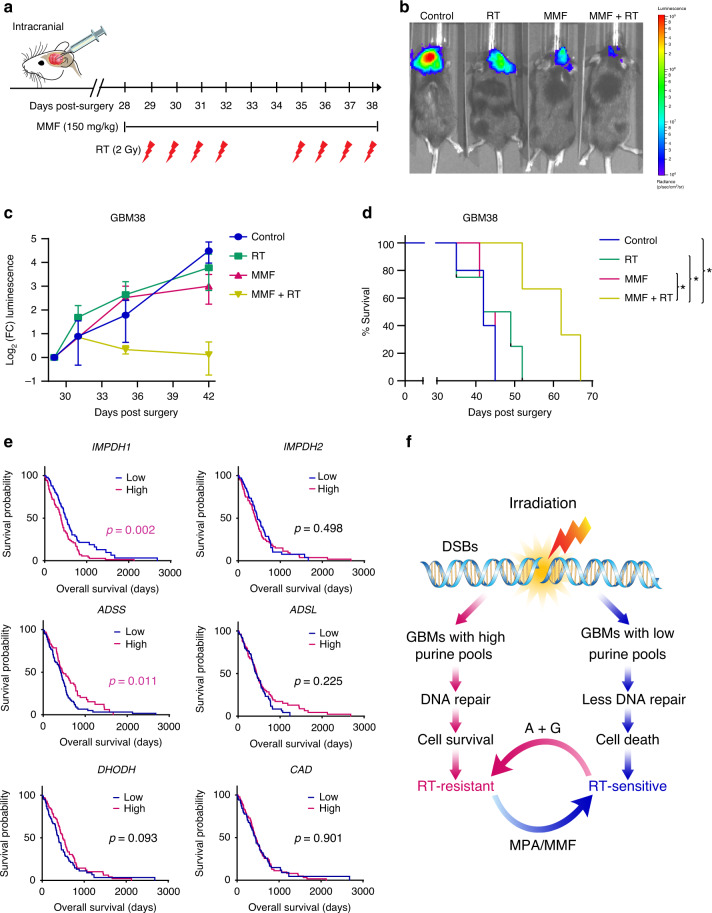
Intratumoral genomic heterogeneity in glioblastoma (GBM) is a barrier to overcoming therapy resistance. Treatments that are effective independent of genotype are urgently needed. By correlating intracellular metabolite levels with radiation resistance across dozens of genomically-distinct models of GBM, we find that purine metabolites, especially guanylates, strongly correlate with radiation resistance. Inhibiting GTP synthesis radiosensitizes GBM cells and patient-derived neurospheres by impairing DNA repair. Likewise, administration of exogenous purine nucleosides protects sensitive GBM models from radiation by promoting DNA repair. Neither modulating pyrimidine metabolism nor purine salvage has similar effects. An FDA-approved inhibitor of GTP synthesis potentiates the effects of radiation in flank and orthotopic patient-derived xenograft models of GBM. High expression of the rate-limiting enzyme of de novo GTP synthesis is associated with shorter survival in GBM patients. These findings indicate that inhibiting purine synthesis may be a promising strategy to overcome therapy resistance in this genomically heterogeneous disease.


Conflict of interest statement

D.R.W. has received research grant support from Innocrin Pharmaceuticals Inc. and Agios Pharmaceuticals Inc. for work unrelated to the content of this manuscript. The other authors have declared that no conflict of interest exists.

Figures

Fig. 1
Fig. 1. Increased levels of nucleobase-containing metabolites are associated with RT-resistance in GBM.
a Clonogenic survival assays were performed on the indicated GBM cell lines to determine Dmid (the linear area under the clonogenic survival curve). Data are presented as mean ± SEM from 3 to 7 biologic replicates. b RT-resistant (U87 MG and A172) and RT-sensitive (KS-1 and U118 MG) GBM cell lines were irradiated with 8 Gy, followed by γ-H2AX flow cytometry analysis at 0, 0.5, 2, or 24 h following RT. Data are presented as mean ± SEM from 3 biologic replicates. c Metabolites were grouped into pathways and an average pathway-level correlation with RT-sensitivity was determined. Only the pathways significantly correlated with RT-sensitivity are shown. d Two RT-resistant (U87 MG and A172) and two RT-sensitive (KS-1 and U118 MG) GBM cell lines were irradiated with 8 Gy, and harvested 2 h after RT and analyzed by targeted LC-MS/MS (4 biologic replicates per cell line). Fold-change values for each metabolite were determined based on unirradiated matched cell line controls and then averaged for the two resistant (left) or sensitive (right) cell lines. e Pathways with downregulated metabolites post-RT that are significantly correlated with RT-sensitivity are shown (Pearson’s correlation; p = 0.0001 for guanylates; p = 0.02 for glutathione; p = 0.03 for nucleotide sugar, p = 0.0495 for adenylates.). Source data are provided as a Source Data file.
Fig. 2
Fig. 2. Supplementing nucleoside pools promotes DNA repair and RT-resistance in GBM.
a A schematic timeline of treatment in the RT-sensitive cell lines. U118 MG, DBTRG-05MG, or GB-1 cells were treated with exogenous pooled nucleosides (Nuc; 8×) for 24 h, and retreated with nucleosides 2 h before RT with indicated doses, followed by IF, comet assay, or clonogenic assay. bd U118 MG, DBTRG-05MG, and GB-1 cells were treated as described in Fig. 2a, followed by clonogenic assay. ER indicates the Enhancement Ratio, which is the ratio of Dmid control and Dmid treatment. ER > 1 indicates radiosensitization while ER < 1 indicates radioprotection. Fig. bd show representative figures from one of three biologic repeats for each cell line, each performed in technical triplicate. Error bars indicate mean ± SEM from technical triplicates from that single representative experiment. In the lower left of each graph, ER (mean ± SEM) from the three biologic replicates is shown. eg Cells were treated as above and harvested for γ-H2AX foci IF staining at indicated times post-RT. Data are presented as mean ± SEM from 3 biologically independent experiments. p values of 0.5, 2, 6, and 24 h are 0.0021, 0.0050, 0.0044, and 0.0035 for Fig. e; 0.0071, 0.0134, 0.0069, and 0.0056 for Fig. f; 0.0140, 0.0007, 0.0093, and 0.0035 for Fig. gi. DBTRG-05MG or GB-1 cells were treated as above and harvested at different time points for alkaline comet assay. Cells were irradiated and harvested on ice for the 0 h time point (4 Gy; 0 h). Data are presented as mean ± SEM from 3 (h) or 4 (i) biologically independent experiments. p values of 0, 0.5 and 4 h are 0.4996, 0.0019, and 0.0145 for Fig. h; 0.8050, 0.0152, and 0.0080 for Fig. i. Fig. ei: *p < 0.05 and **p < 0.01, ***p < 0.001 compared with control. The p values indicated in Fig. ei were obtained by two-tailed unpaired student's t test. Source data are provided as a Source Data file.
Fig. 3
Fig. 3. Inhibiting GTP synthesis radiosensitizes RT-resistant GBM cell lines and patient-derived neurospheres.
a Purine synthesis schematic. R5P: Ribose 5-phosphate; IMP: inosine monophosphate; GTP: Guanosine-5’-triphosphate; ATP: Adenosine triphosphate; IMPDH: Inosine-5’-monophosphate dehydrogenase; HGPRT: hypoxanthine-guanine phosphoribosyltransferase; MPA: mycophenolic acid. bd U87 MG cells were treated with MPA (10 μM) for 24 h, and then harvested and analyzed by targeted LC-MS/MS. Data are presented as mean ± SEM from four biologic replicates. p values are <0.0001, <0.0001, and 0.0237 for Fig. bd, respectively. *p < 0.05, and ****p < 0.0001 compared with control. The p values indicated were obtained by two-tailed unpaired student's t test. e, f After treatment with indicated conditions, cells were replated for colonogenic assay and colonies were stained and counted 10 to 14 days later. Data are presented as mean ± SEM from 4 separate experiments. g, h HF2303 or MSP12 neurospheres were treated as the timeline shown in Supplementary Fig. 3e. In brief, cells were treated with nucleosides or MPA (10 µM), and retreated with nucleosides 2 h before RT. Cells were replated to 96-well plates (2000 cells/well) 24 h post-RT and cell viability were detected by the Celltiter-Glo kit ~7 days after replating. Fig. g and h are representative figures from three biologically independent experiments. Error bars show mean ± SEM from representative experiments, which were performed in five (g) or six (h) technical replicates. ER (mean ± SEM) of MPA from biologic replicates is shown on the lower left of each graph and is calculated as the GI50 of the control-treated cells divided by the GI50 of the MPA-treated cells. Source data are provided as a Source Data file.
Fig. 4
Fig. 4. Inhibiting GTP synthesis impairs DNA repair in a nucleoside-dependent fashion.
ab Cells were treated with 10 µM MPA for 24 h and then irradiated with 4 Gy, and cells were harvested at indicated time point for γ-H2AX foci staining. Data are presented as mean ± SEM from three (a) or six (b) biologic replicates. p values of 2, 6, and 24 h are 0.0074, 0.0088, and 0.0036 for Fig. a; 0.0220, 0.0273, and 0.0355 for Fig. b. RT-resistant cells or neurospheres were treated with MPA (10 µM) and collected for IF γ-H2AX foci staining 6 h post-RT. Data are presented as mean ± SEM from three biologically independent experiments in Fig. cf. Fig. af, *p < 0.05; **p < 0.01; ***p < 0.001; ****p < 0.0001. The p values indicated were obtained by two-tailed unpaired student's t test. Source data are provided as a Source Data file.
Fig. 5
Fig. 5. Modulating pyrimidine pools has minimal effects on GBM DNA repair and RT-resistance.
a, b U87 MG and A172 cells were treated with varying doses of teriflunomide (Teri) for 24 h, and then irradiated. Cells were replated for colonogenic assay 24 h post-RT. Individual plots show data from one of three biologic replicates and error bars indicate mean ± SEM of technical replicates from that experiment. ER show the mean ± SEM from all three biologic replicates. c, d Cells were treated with 20 µM teriflunomide for 24 h and then irradiated with 4 Gy, and cells were harvested at indicated time point post-RT for γ-H2AX foci staining. Data points are averages (mean ± SEM) from three biologic replicates. Cells were treated with pooled nucleosides (Nuc; 8×), or a combination of Adenosine + Guanosine (A + G), or Cytidine + Thymidine + Uridine (C + T + U) for 24 h, and retreated with indicated nucleosides 2 h before RT (4 Gy), followed by IF γ-H2AX foci staining 6 h post-RT. For Fig. eg, data are presented as mean ± SEM from four (e, f) or three (g) biologically independent experiments. Source data are provided as a Source Data file.
Fig. 6
Fig. 6. MMF augments RT efficacy against immortalized GBM xenografts.
a A schematic timeline of HF2303 and MSP12 flank models. HF2303 and MSP12 xenograft GBM models were established and randomized as described in “Methods”. Mycophenolate mofetil (MMF) (120 mg/kg) was administered via oral gavage once daily beginning the day prior to RT and ending the day after. MMF was given 2 h before RT and held on weekends (six total doses). RT (2 Gy/fraction) was administered over four daily fractions on weekdays. b, c A subset of tumors harvested 2 h after receiving the second RT dose were analyzed by LC-MS/MS (b), or were ground and lysed for immunoblotting assay with indicated antibodies. The bands were quantified using Image J 2.0 software and the quantified numbers were labeled under each band (c). Fig. c are representative figures from three biologically independent experiments. d, e Tumor volumes for the indicated treatment groups are normalized to the individual tumor sizes defined on day 1. Error bars indicate mean ± SEM from ten tumors of 5 mice per group. f, g Kaplan–Meier estimates of time to tumor tripling. p values for Control vs. RT are 0.0117 Fig. f and 0.0089 Fig. g; Control vs. MMF are 0.0133 Fig. f and 0.0324 Fig. g; Control vs. MMF + RT are <0.0001 Fig. f, g; RT vs. MMF + RT are 0.0026 Fig. f and 0.0009 Fig. g; MMF vs. MMF + RT are <0.0001 Fig. f and 0.0006 Fig. g; *p < 0.05; **p < 0.01; ***p < 0.001; ****p < 0.0001. The p values were obtained by the log-rank (Mantel–Cox) test. Source data are provided as a Source Data file.
Fig. 7
Fig. 7. Purine metabolism mediates RT resistance in an orthotopic patient-derived GBM model.
a Luciferase-positive RT-resistant GBM38 patient-derived xenograft cells were orthotopically implanted and, 28 days later, brain tumor-bearing mice were randomized to treatment with drug vehicle, RT, MMF, or MMF + RT (3–5 animals per group). MMF was administrated from Day 28 to 38 (11 doses), and RT was given from Day 29 to 32 and Day 35 to 38, respectively. b Mice were treated with 150 mg/kg D-luciferin and imaged 10 min post-injection. c Total flux of equal-area ROIs at each time point were normalized to flux at the first day of treatment and used to approximate tumor progression. Data are presented as mean ± SEM from three (MMF + RT) or four (Control, RT, MMF) independent mice per group. d Kaplan–Meier survival curve. Mice were monitored daily and euthanized when they developed neurologic symptoms. p value for RT vs. MMF + RT is 0.0409; 0.0213 for MMF vs. MMF + RT; 0.0151 for Control vs. MMF + RT; *p < 0.05. The p value was obtained by the log-rank (Mantel–Cox) test. e Kaplan–Meier overall survival curve of 208 patients from the Pan-Cancer Atlas with newly diagnosed IDH wild type GBM. High and low groups are defined by median expression of key rate limiting enzymes of nucleotide synthesis. The p values were obtained using the log-rank (Mantel–Cox) test. f Working model. RT induces DSBs in GBMs. High de novo purine synthesis promotes GBM survival by stimulating dsDNA repair, cell survival and recurrence after RT. Supplementing cells with purines (A + G) promotes RT-resistance while inhibiting de novo purine synthesis with mycophenolic acid (MPA) or mycophenolate mofetil (MMF) promotes RT-sensitivity. Source data are provided as a Source Data file.

References

    1. Cancer Genome Atlas Research N. Comprehensive genomic characterization defines human glioblastoma genes and core pathways. Nature. 2008;455:1061–1068. - PMC - PubMed
    1. Brennan CW, et al. The somatic genomic landscape of glioblastoma. Cell. 2013;155:462–477. - PMC - PubMed
    1. Raizer JJ, et al. A phase II trial of erlotinib in patients with recurrent malignant gliomas and nonprogressive glioblastoma multiforme postradiation therapy. Neuro. Oncol. 2010;12:95–103. - PMC - PubMed
    1. Pitz MW, et al. Phase II study of PX-866 in recurrent glioblastoma. Neuro. Oncol. 2015;17:1270–1274. - PMC - PubMed
    1. Lassman AB, et al. Phase 2 trial of dasatinib in target-selected patients with recurrent glioblastoma (RTOG 0627) Neuro Oncol. 2015;17:992–998. - PMC - PubMed

Publication types