. 2020 Jul 30;11(1):3806.
doi: 10.1038/s41467-020-17395-y.

Autophagy deficiency promotes triple-negative breast cancer resistance to T cell-mediated cytotoxicity by blocking tenascin-C degradation

Affiliations

Autophagy deficiency promotes triple-negative breast cancer resistance to T cell-mediated cytotoxicity by blocking tenascin-C degradation

Zhi-Ling Li et al. Nat Commun. .

Abstract

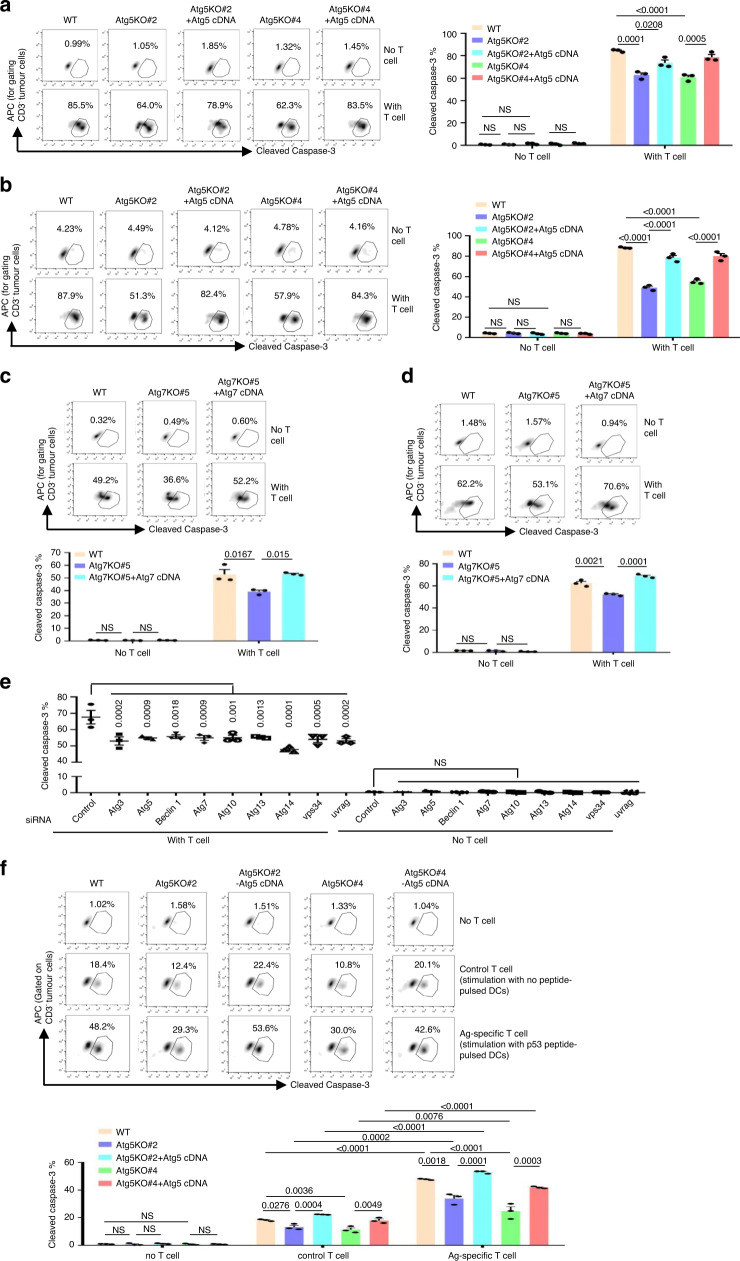
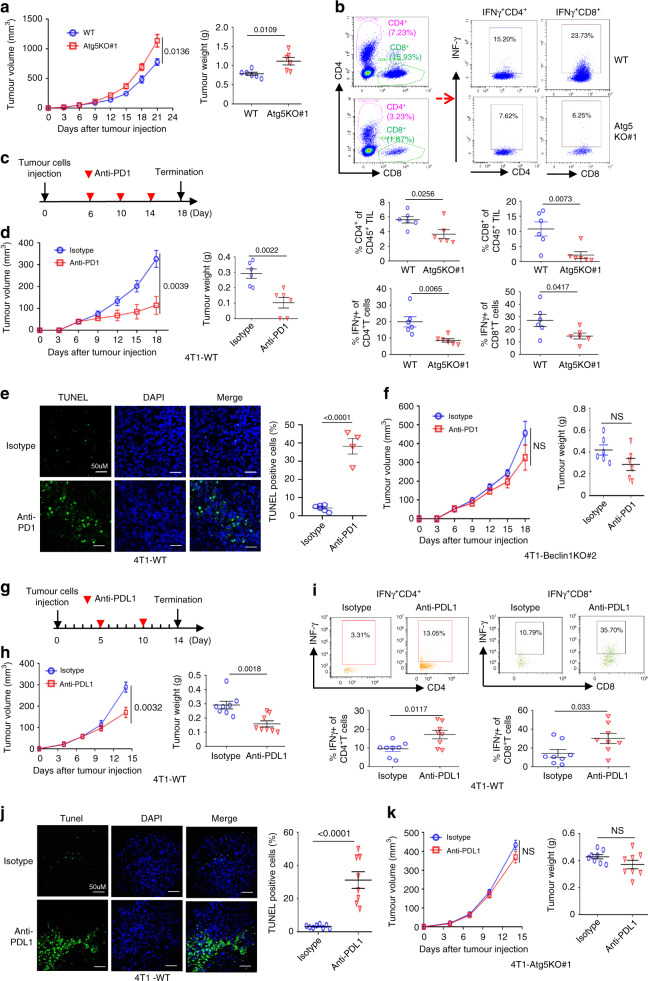
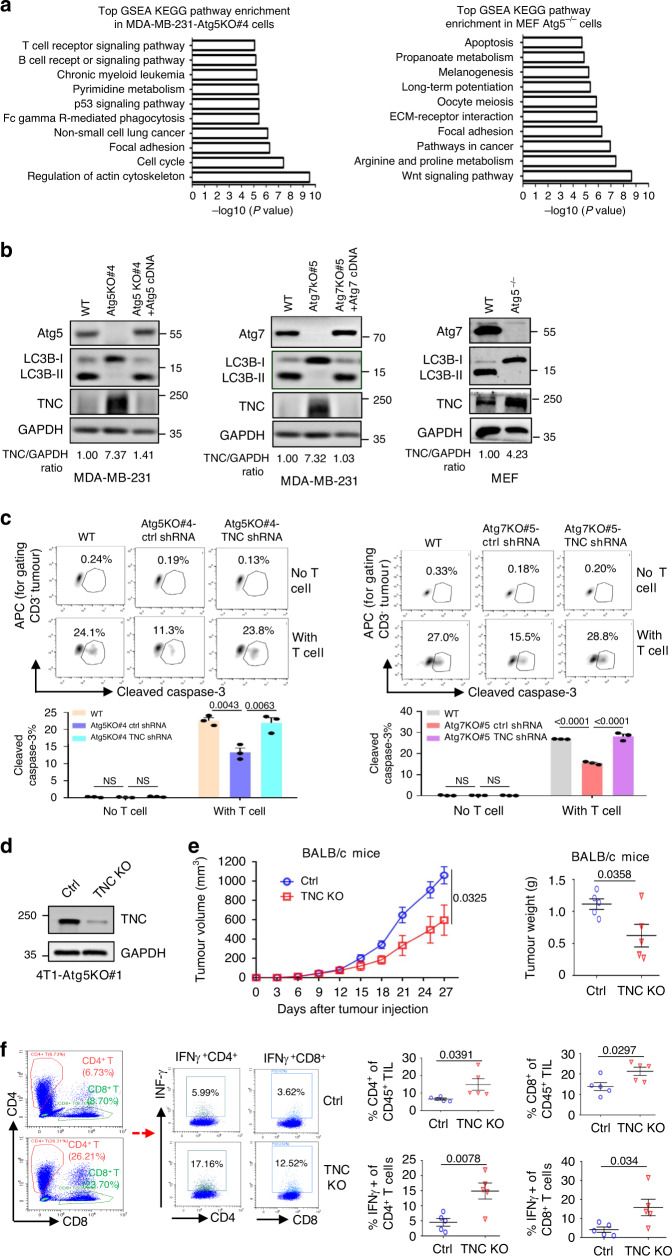
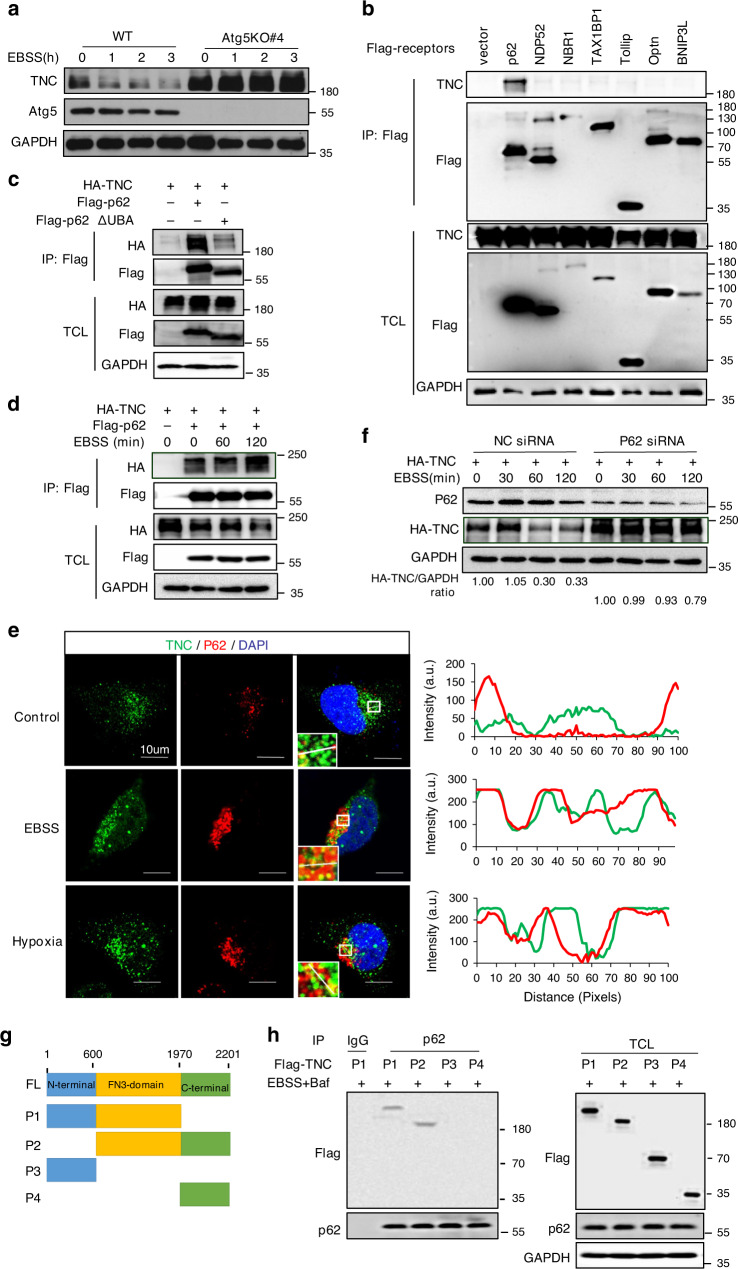
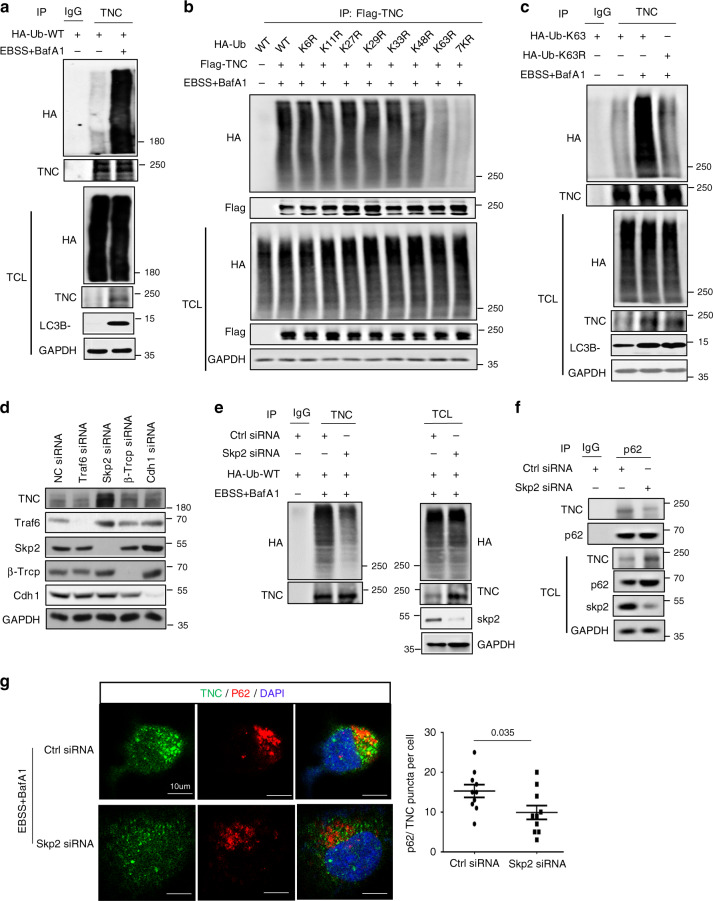
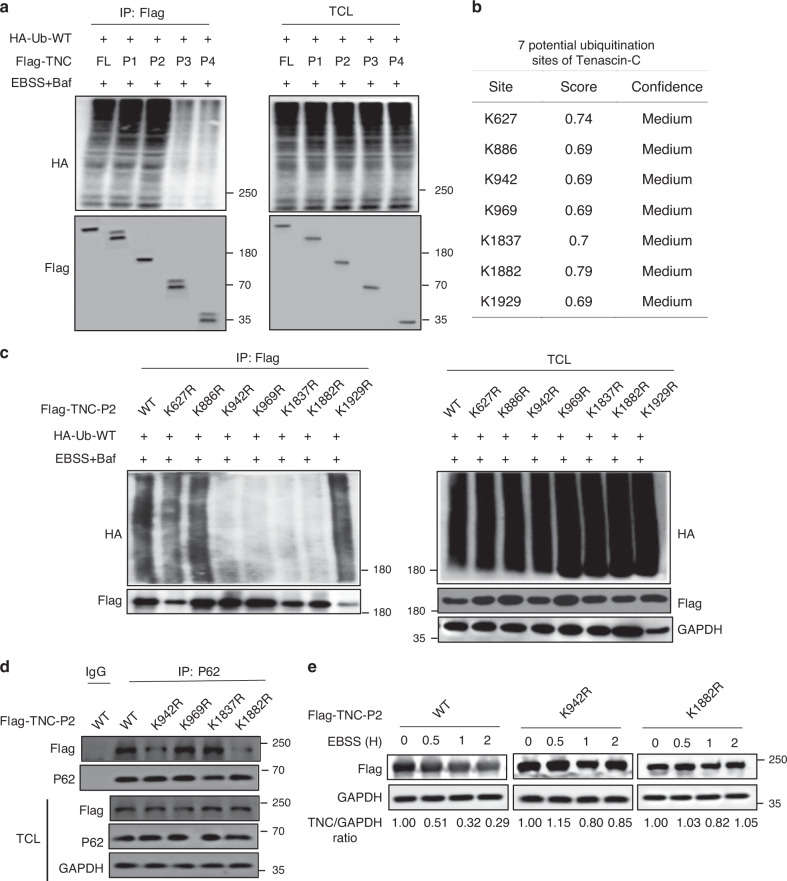
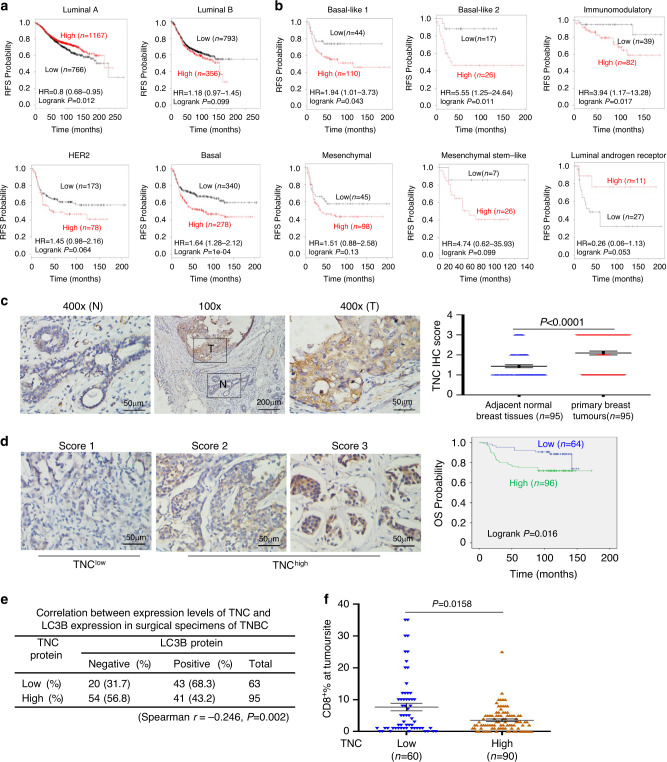
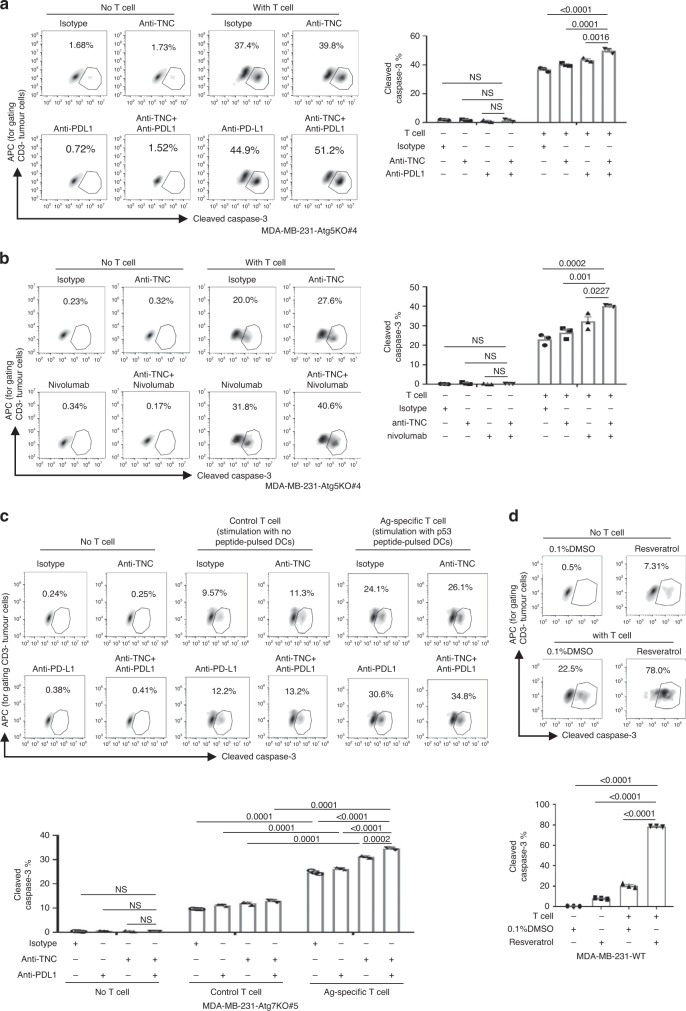
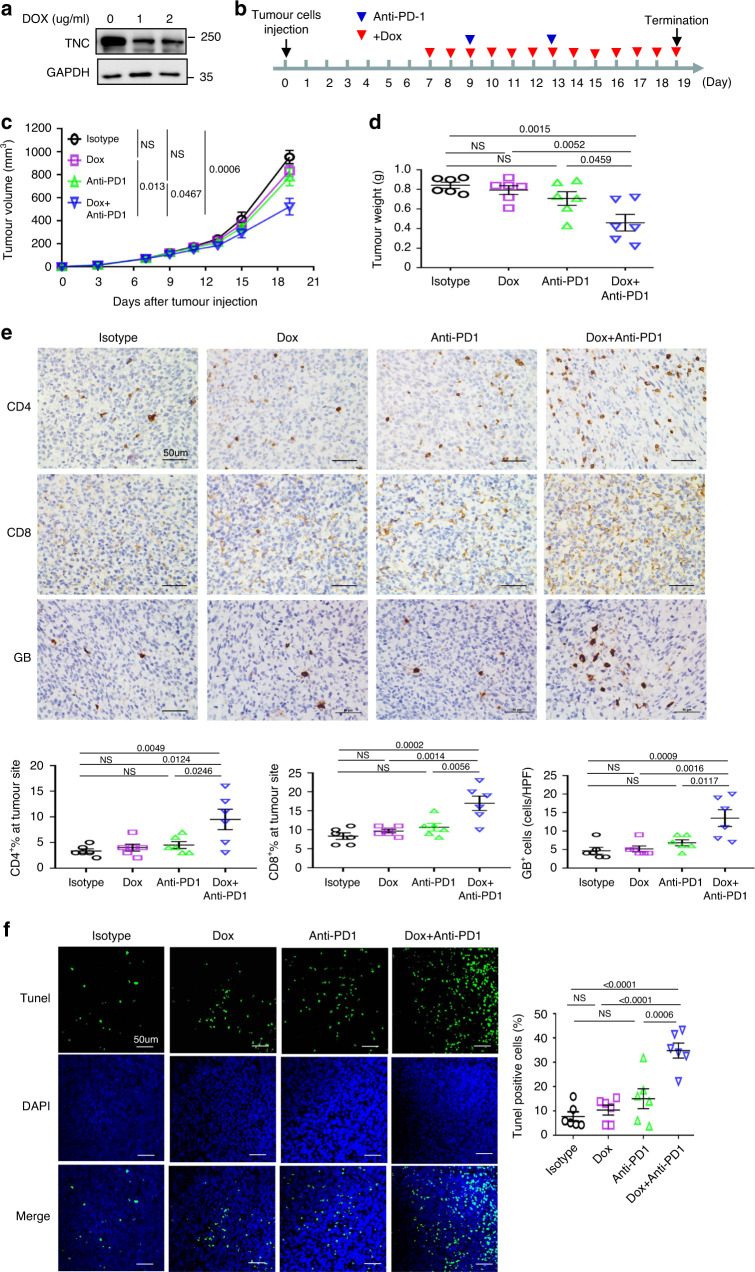
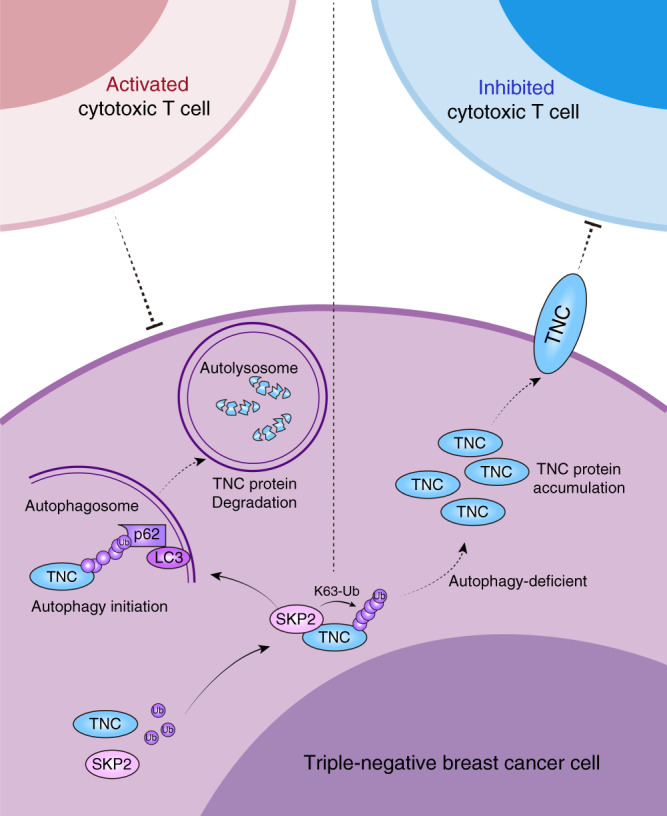
Most triple-negative breast cancer (TNBC) patients fail to respond to T cell-mediated immunotherapies. Unfortunately, the molecular determinants are still poorly understood. Breast cancer is the disease genetically linked to a deficiency in autophagy. Here, we show that autophagy defects in TNBC cells inhibit T cell-mediated tumour killing in vitro and in vivo. Mechanistically, we identify Tenascin-C as a candidate for autophagy deficiency-mediated immunosuppression, in which Tenascin-C is Lys63-ubiquitinated by Skp2, particularly at Lys942 and Lys1882, thus promoting its recognition by p62 and leading to its selective autophagic degradation. High Tenascin-C expression is associated with poor prognosis and inversely correlated with LC3B expression and CD8+ T cells in TNBC patients. More importantly, inhibition of Tenascin-C in autophagy-impaired TNBC cells sensitizes T cell-mediated tumour killing and improves antitumour effects of single anti-PD1/PDL1 therapy. Our results provide a potential strategy for targeting TNBC with the combination of Tenascin-C blockade and immune checkpoint inhibitors.


Conflict of interest statement

The authors declare no competing interests.

Figures

Fig. 1
Fig. 1. Autophagy deficiency in TNBC cells reduces T-cell-mediated killing in vitro.
ab The indicated MDA-MB-231-Atg5KO cells were co-cultured with CD3/CD28-activated human T-lymphocyte cells exposed to normoxic (a) or hypoxic conditions (1% O2) (b). Left, representative dot plots of the cleavage of caspase-3 in tumour cells measured by flow cytometry. Right, percentage of cleaved caspase-3+ tumour cells. c, d The indicated MDA-MB-231-Atg7KO cells were co-cultured with CD3/CD28-activated human T cells exposed to normoxic (c) or hypoxic conditions (d). Upper, representative dot plots of the cleavage of caspase-3 in tumour cells measured by flow cytometry. Bottom, percentage of cleaved caspase-3+ tumour cells. e MDA-MB-231 cells were transiently transfected with siRNAs targeting autophagy-related genes for 48 h. Then, the tumour cells were co-cultured with CD3/CD28-activated human T cells. The percentage of cleaved caspase-3+ tumour cells was determined using flow cytometry. f The indicated MDA-MB-231 cells were co-cultured with bulk populations of p53264-272 peptide-specific human T cells. Upper, representative dot plots of the cleavage of caspase-3 in tumour cells measured by flow cytometry. Bottom, percentage of cleaved caspase-3+ tumour cells. Error bars represent mean ± SEM, n = 3 biological independent samples. The P value in (ad, f) was determined by one-way ANOVA with Tukey’s multiple comparisons test, the P value in (e) was determined by one-way ANOVA with Dunnett’s multiple comparisons test, no adjustments were made for multiple comparisons. NS no significance. All data are representative of three independent experiments.
Fig. 2
Fig. 2. The loss of autophagy promotes resistance to T-cell-mediated anti-tumour activity in vivo.
a, b Tumour growth of mouse 4T1-WT or 4T1-Atg5KO#1 cells in BALB/c mice (n = 6 mice per group). Tumour volumes (left, a) and tumour weights upon autopsy on day 21 (right, a) were calculated. Representative TILs dot plots from a representative mouse for each group were shown (upper, b). The percentage of TILs for each group were calculated (bottom,b). c Tumour growth of 4T1-WT and 4T1-Beclin1KO#2 tumour xenografts in BALB/c mice following treatment with mouse anti-PD1 antibody. The treatment protocol was summarized by the arrows. d, e Tumour growth of 4T1-WT cells in BALB/c mice with anti-PD-1 antibody treatment (n = 6 mice per group). Tumour volumes (left, d) and tumour weights upon autopsy on day 18 (right, d) were calculated. Representative images of TUNEL staining (green) and DAPI-stained nuclei (blue) in xenograft tumour sections were shown (left, e). Quantification of positive TUNEL cells (right, e). f Tumour growth of 4T1- Beclin1KO#2 cells in BALB/c mice with anti-PD-1 antibody treatment (n = 6 mice per group). Tumour volumes (left, f) and tumour weights upon autopsy on day 18 (right, f) were calculated. g Tumour growth of 4T1-WT and 4T1-Atg5KO#1 tumour xenografts in BALB/c mice following treatment with mouse anti-PD-L1 antibody. The treatment protocol was summarized by the arrows. hj Tumour growth of 4T1-WT cells in BALB/c mice with mouse anti-PD-L1 antibody treatment (n = 8 mice per group). Tumour volumes (left, h) and tumour weights upon autopsy on day 14 (right, h) were calculated. Representative TILs dot plots from a representative mouse for each group were shown (upper, i). The percentage of TILs for each group were calculated (bottom, i). Representative images of TUNEL staining (green) and DAPI-stained nuclei (blue) in xenograft tumour sections were shown (left, j). Quantification of positive TUNEL cells (right, j). k Tumour growth of 4T1-Atg5KO#1 cells in BALB/c mice with mouse anti-PD-L1 antibody treatment (n = 8 mice per group). Tumour volumes (left, k) and tumour weights upon autopsy on day 14 (right, k) were calculated. Error bars represent mean ± SEM. The P value was determined by a two-tailed unpaired Student’s t test. Data are representative of two independent experiments.
Fig. 3
Fig. 3. TNC is overexpressed in autophagy-deficient TNBC cells and inhibits T-cell priming.
a The Top10 KEGG pathways enriched for commonly upregulated proteins in MDA-MB-231-Atg5KO#4 cells and MEF-Atg5−/− cells compared to control cells. b Immunoassay of extracts of the indicated MDA-MB-231 cells and MEF cells. c The indicated MDA-MB-231 cells were co-cultured with CD3/CD28- activated human T-lymphocyte cells. Upper, representative dot plots of the cleavage of caspase-3 in tumour cells measured by flow cytometry. Bottom, percentage of the cleaved caspase-3 in tumour cells (n = 3 biological independent samples). d The effect of TNC knockout in 4T1-Atg5KO cells using CRISPR-Cas9 technology. e Tumour growth of indicated mouse 4T1-Atg5KO#1 cells in BALB/c mice (n = 5 mice per group). Tumour volumes were calculated (left), and tumour weights from experiment on autopsy on day 27 (right). f FACS analysis of CD45+CD4+, CD45+CD8+, and IFNγ+ in CD45+CD4+T and CD45+CD8+T-cell populations from the isolated TILs in (e) (n = 5 mice per group, right). Representative dot plots from a representative mouse for each group (left). Error bars represent mean ± SEM. The P value in c was determined by one-way ANOVA with Tukey’s multiple comparisons test, no adjustments were made for multiple comparisons. The P value in e, f was determined by a two-tailed unpaired Student’s t test. NS no significance. All data are representative of three independent experiments.
Fig. 4
Fig. 4. P62 mediates selective autophagic degradation of TNC.
a Immunoblot of MDA-MB-231-WT or MDA-MB-231-Atg5KO#4 cells treated with EBSS for the indicated time points. b HEK293T cells were transfected with Flag-tagged p62, NDP52, NBR1, TAX1BP1, Tollip, OPTN or BNIP3L, followed by immunoprecipitation with anti-Flag beads and immunoblot analysis with anti-TNC. c Coimmunoprecipitation and immunoassay of extracts of HEK293T cells transfected with FLAG-tagged wild-type p62 or its UBA domain deletion mutant, together with HA-tagged TNC. d Immunoprecipitation and immunoassay of extracts HEK293T cells transfected with Flag-p62, HA-TNC, and treated with EBSS for different hours. e Confocal microscopy of MDA-MB-231 cells treated with EBSS for 3 h or exposed to hypoxia for 12 h in the presence of BafA1. Scar bar, 10 µm. Line-scan analysis for each image is also shown. Green, TNC; Red, P62. f HEK293T cells were transiently transfected with p62 siRNA for 12 h, then co-transfected with HA-tagged TNC for another 48 h. Then the cells were treated with EBSS for different hours. g Construct deletion mutants of Flag-TNC according to the conserved domains of TNC. h HEK293T cells were transfected with Flag-tagged TNC or deletion mutants. Endogenous p62 was immunoprecipitated and the bound Flag-TNC proteins examined by immunoblot. All data are representative of three independent experiments.
Fig. 5
Fig. 5. Skp2 mediates autophagic degradation of TNC.
a Coimmunoprecipitation and immunoassay of extracts of HEK293T cells treated with EBSS in the presence of BafA1 for 2 h. b HEK293T cells were transfected with Flag-tagged TNC and HA-tagged wild-type Ub (WT) or ubiquitin mutants (K6R, K11R, K27R, K29R, K33R, K48R, K63R, 7KR) and treated with EBSS in the presence of BafA1 for 2 h, followed by immunoprecipitation with anti-Flag beads and immunoblot analysis with anti-HA. c Coimmunoprecipitation and immunoassay of extracts of HEK293T cells transfected with various combinations of plasmid, then treated with or without EBSS in the presence of BafA1 for 2 h. d Immunoblot analysis of MDA-MB-231 cells transfected with the indicated siRNA oligonucleotides for 48 h. e HEK293T cells were transiently transfected with Skp2 siRNA for 12 h, then co-transfected with HA-Ub-WT for another 48 h. Then the cells were treated with EBSS treatment in the presence of BafA1 for 2 h. f HEK293T cells were transiently transfected with Skp2 siRNA for 48 h, p62 proteins were immunoprecipitated and the bound TNC proteins examined by immunoblot. g Confocal microscopy of MDA-MB-231 cells treated with Skp2 siRNA in the presence of EBSS for 2 h along with BafA1 (left). Scar bar, 10 µm. Statistics of the puncta formation by TNC-p62 were determined in the indicated samples (n = 10 cells per group, right). Error bars represent mean ± SEM. The P value in g was determined by a two-tailed unpaired Student’s t test. All data are representative of three independent experiments.
Fig. 6
Fig. 6. Identification of the ubiquitination site of TNC.
a Full-length Flag-TNC and TNC truncation mutants were co-transfected with HA-Ub-WT into HEK293T cells, then followed by EBSS treatment in the presence of BafA1 for 2 h. Immunoprecipitation analysis of exogenous TNC ubiquitination with the indicated antibodies. b Predict the ubiquitination lysine sites of TNC using Ubpred website (www.ubpred.org). c HEK293T cells transfected with Flag-TNC-P2 and indicated TNC mutants along with HA-Ub, then followed by EBSS treatment in the presence of BafA1 for 2 h. Immunoprecipitation analysis of exogenous TNC ubiquitination. d Coimmunoprecipitation and immunoassay of extracts of HEK293T cells transfected with the indicated plasmids. P62 proteins were immunoprecipitated and the bound exogenous TNC proteins examined by immunoblot. e HEK293T cells were transfected with the indicated plasmids, then treated with EBSS at indicated intervals and analyzed by immunoblot. All data are representative of three independent experiments.
Fig. 7
Fig. 7. TNC is correlated with LC3B and CD8+ T cells in clinical TNBC samples.
a, b Kaplan–Meier analysis of RFS based on TNC (201645_at) mRNA levels using the KM-plotter breast cancer database (http://kmplot.com/analysis). Auto select best cutoff was chosen in the analysis. All patients were stratified according intrinsic subtype as indicated (a). Basal patients were stratified according the known six Pietenpol subtypes (b). c The representative images of strong TNC staining in tumour cells (T) and weak staining in the matched adjacent normal cells (N) (Left). Quantitative IHC analysis of TNC staining of primary breast tumours and adjacent normal breast tissues was shown (n = 95). d The representative images for each IHC score of TNC staining in 160 primary TNBC tumours were shown. Score 1 represnted low TNC expression, Scores 2 and 3 represnted high TNC expression (left). Kaplan–Meier analysis of OS  for  patients.  All patients were stratified by expression of TNC (right). e The correlation of LC3B with TNC expression status in 158 primary TNBC tumours. Spearman's correlation coefficient r and P values were given at the bottom. f The correlation of CD8+ T-cell infiltration with TNC expression status in 150 primary TNBC tumours. Error bars represent mean ± SEM. The P value in c, f was determined by Wilcoxon matched-pairs signed rank test (two-sided). Survival curves in a, b, d were plotted by the Kaplan–Meier method and assessed using the log-rank test, and univariate Cox proportional hazards regression was carried out to identify HR and 95% CI.
Fig. 8
Fig. 8. Blockade of TNC sensitizes checkpoint blockade immunotherapy in vitro.
a MDA-MB-231-Atg5KO#4 cells were pre-treated with anti-TNC (10 µg per ml) or anti-PD-L1 (10 µg/ml) for 2 h, then co-cultured with CD3/CD28-activated human T cells. Left, representative dot plots of the cleavage of caspase-3 in tumour cells measured by flow cytometry. Right, percentage of cleaved caspase-3+ tumour cells. b MDA-MB-231-Atg5KO#4 cells were pre-treated with anti-TNC (10 µg/ml) for 2 h, then co-cultured with CD3/CD28-activated human T cells in the presence of nivolumab (10 µg/ml). Left, representative dot plots of the cleavage of caspase-3 in tumour cells measured by flow cytometry. Right, percentage of cleaved caspase-3+ tumour cells. c MDA-MB-231-Atg7KO#5 cells were pre-treated with anti-TNC (10 µg/ml) or anti-PD-L1 (10 µg/ml) for 2 h, then co-cultured with P53 antigen-specific activated human T cells. Upper, representative dot plots of the cleaved caspase-3 in tumour cells measured by flow cytometry. Bottom, percentage of cleaved caspase-3+ tumour cells. d MDA-MB-231-WT cells were pre-treated with 50 µM Resveratrol for 24 h, then co-cultured with CD3/CD28-activated human T cells. Upper, representative dot plots of the cleavage of caspase-3 in tumour cells measured by flow cytometry. Bottom, percentage of cleaved caspase-3+ tumour cells. Error bars represent mean ± SEM, n = 3 biological independent samples. The P value was determined by one-way ANOVA with the Dunnett’s multiple comparisons test, no adjustments were made for multiple comparisons. NS no significance. All data are representative of three independent experiments.
Fig. 9
Fig. 9. TNC downregulation enhances the antitumour activity of PD1 blockade in vivo.
a 4T1-Atg5KO#1 cells were stably transfected with Tet-on inducible TNC shRNA. Then the cells were treated with DOX for 2 days. bd Tumour growth of 4T1-Atg5KO#1 cells stably expressing Tet-on inducible TNC shRNA in BALB/c mice following treatment with DOX and PD1 antibody. The treatment protocol was summarized by the arrows (b). Tumour volumes (c) and tumour weights from experiment on autopsy on day 19 (d) were calculated. e Representative images of IHC staining of CD4, CD8 and granzyme B (GB) expression in xenograft tumour sections were shown for mice with treatment in (c) (upper). HPF, ×400 magnification. Scar bar, 50 µm. Quantitative IHC analysis of CD4, CD8 and granzyme B expression (bottom). f Representative images of TUNEL staining (green) and DAPI-stained nuclei (blue) in xenograft tumour sections were shown for mice with treatment in (c) (left). Scar bar, 50 µm. Quantification of positive TUNEL cells (right). Error bars represent mean ± SEM, n = 6 mice per group. The P value in cf was determined by one-way analysis of ANOVA with Tukey’s multiple comparisons test, no adjustments were made for multiple comparisons. NS no significance. The data are representative of two independent experiments.
Fig. 10
Fig. 10. Proposed model of regulation and immunosuppression of TNC in TNBC.
Skp2 is able to catalyze the formation of the Lys63-linked polyubiquitin chains targeting TNC, which facilitats the recognition of TNC by the autophagy receptor p62, followed by further degradation by the autophagy-lysosome system. In autophagy-deficient TNBC cells, TNC is accumulated due to an abnormal autophagy-lysosome degradation pathway, resulting in TNBC cells resistance to T-cell-mediated immune attack.

Similar articles

Cited by

References

    1. Marra A, Viale G, Curigliano G. Recent advances in triple negative breast cancer: the immunotherapy era. BMC Med. 2019;17:90. - PMC - PubMed
    1. Qin G, et al. NPM1 upregulates the transcription of PD-L1 and suppresses T cell activity in triple-negative breast cancer. Nat. Commun. 2020;11:1669. - PMC - PubMed
    1. Stagg J, Allard B. Immunotherapeutic approaches in triple-negative breast cancer: latest research and clinical prospects. Therapeutic Adv. Med. Oncol. 2013;5:169–181. - PMC - PubMed
    1. Schmid P, et al. Atezolizumab and Nab-Paclitaxel in advanced triple-negative breast cancer. N. Engl. J. Med. 2018;379:2108–2121. - PubMed
    1. Keenan TE, Tolaney SM. Role of immunotherapy in triple-negative breast cancer. J. Natl Compr. Cancer Netw. 2020;18:479–489. - PubMed

Publication types

MeSH terms