. 2020 Jul 30;30(1):32.
doi: 10.1038/s41533-020-00190-z.

Capnovolumetry in combination with clinical history for the diagnosis of asthma and COPD

Affiliations

Capnovolumetry in combination with clinical history for the diagnosis of asthma and COPD

C Kellerer et al. NPJ Prim Care Respir Med. .

Abstract

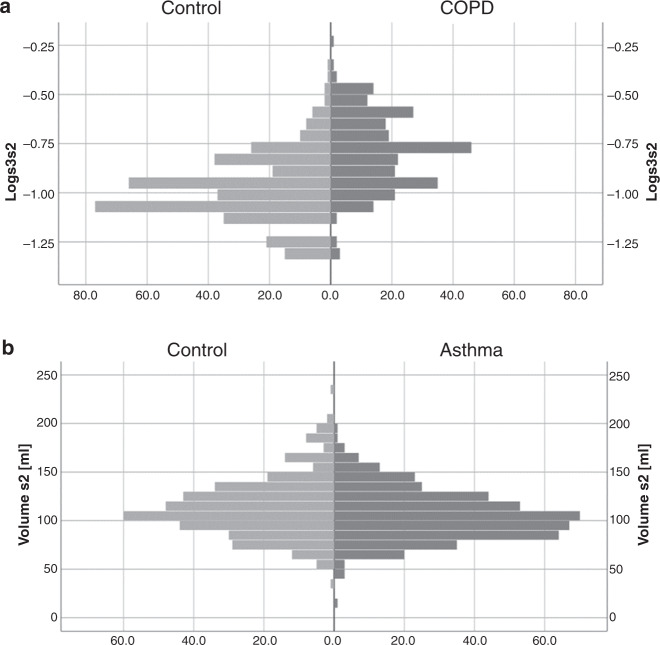
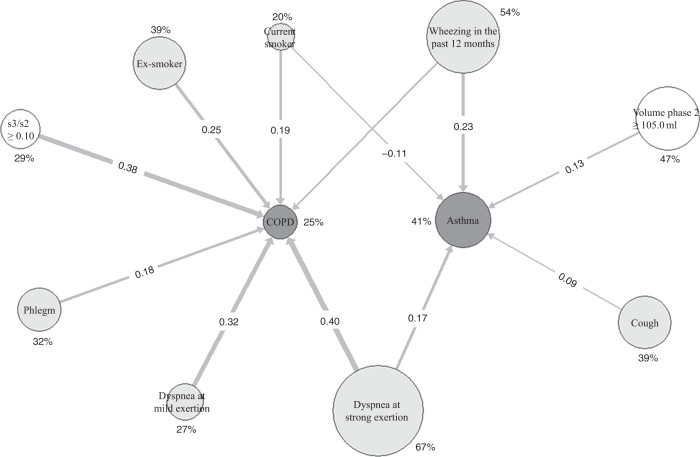
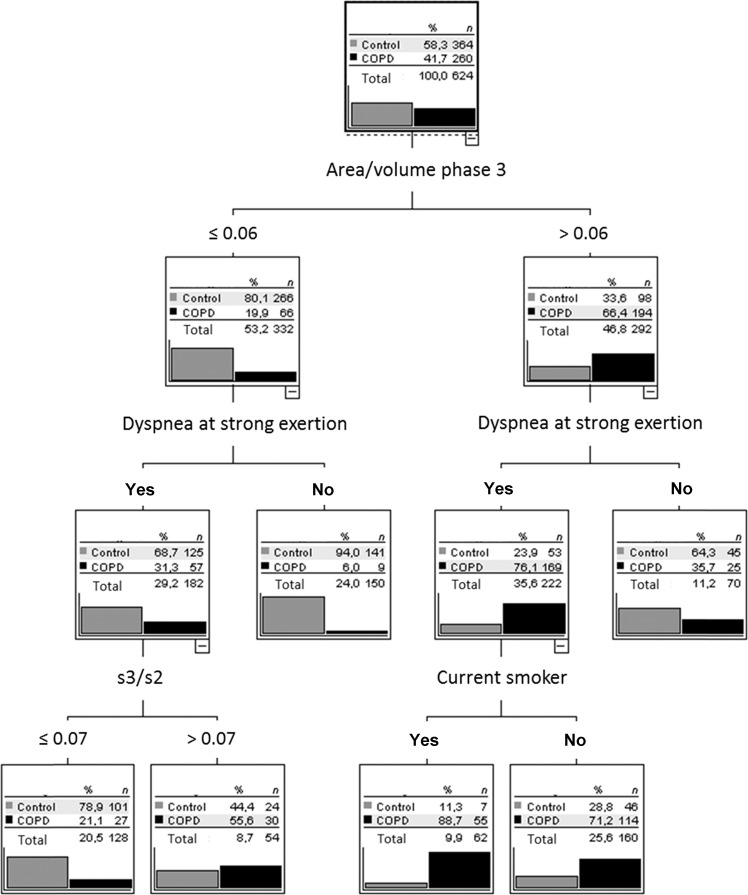
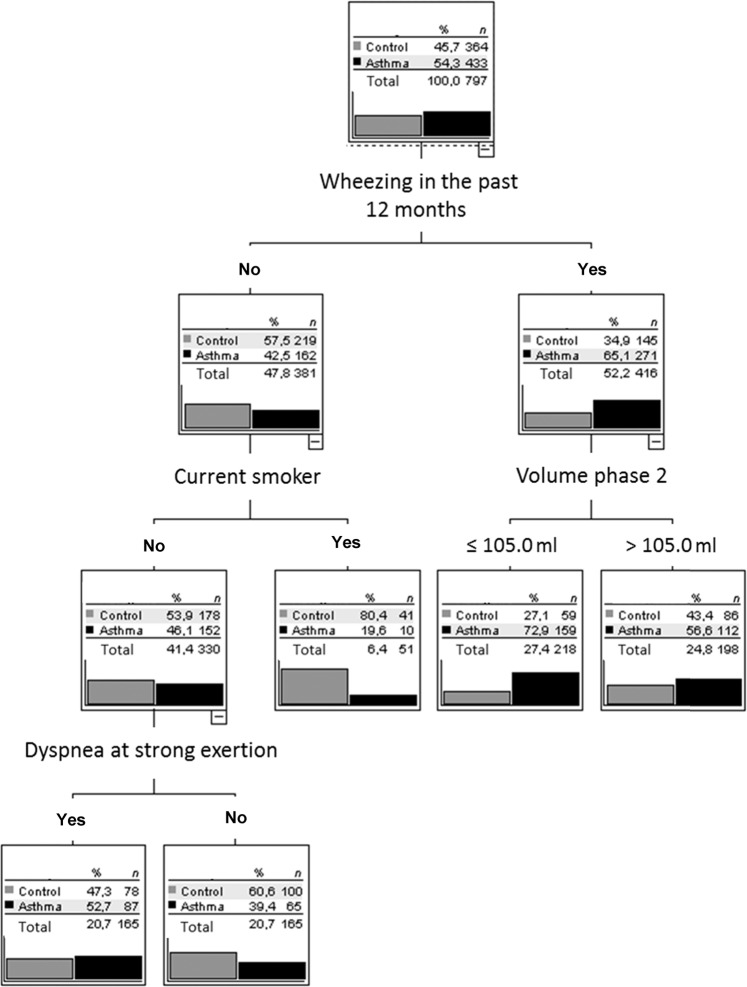
Capnovolumetry performed during resting ventilation is an easily applicable diagnostic tool sensitive to airway obstruction. In the present analysis, we investigated in which way capnovolumetric parameters can be combined with basic anamnestic information to support the diagnosis of asthma and COPD. Among 1400 patients of a previous diagnostic study, we selected 1057 patients with a diagnosis of asthma (n = 433), COPD (n = 260), or without respiratory disease (n = 364). Besides performing capnovolumetry, patients answered questions on symptoms and smoking status. Logistic regression analysis, single decision trees (CHAID), and ensembles of trees (random forest) were used to identify diagnostic patterns of asthma and COPD. In the random forest approach, area/volume of phase 3, dyspnea upon strong exertion, s3/s2, and current smoking were identified as relevant parameters for COPD vs control. For asthma vs control, they were wheezing, volume of phase 2, current smoking, and dyspnea at strong exertion. For COPD vs asthma, s3/s2 was the primary criterion, followed by current smoking and smoking history. These parameters were also identified as relevant in single decision trees. Regarding the diagnosis of asthma vs control, COPD vs control, and COPD vs asthma, the area under the curve was 0.623, 0.875, and 0.880, respectively, in the random forest approach. Our results indicate that for the diagnosis of asthma and COPD capnovolumetry can be combined with basic anamnestic information in a simple, intuitive, and efficient manner. As capnovolumetry requires less cooperation from the patient than spirometry, this approach might be helpful for clinical practice.


Conflict of interest statement

The Institute of General Practice and Health Services Research (Munich, Germany) received a grant from Ganshorn Medizin Electronic GmbH (Niederlauer, Germany) during the conduct of the study. The funders did not play any role in the design of the study, data evaluation and interpretation of the results.

Figures

Fig. 1
Fig. 1. Frequency distributions of capnovolumetric parameters.
Frequency distributions of the ratio s3/s2 for COPD vs control, shown as logarithm to base 10 (a) and of the volume of phase 2 for asthma vs control (b). Before taking the logarithm of the ratio s3/s2, the value of 0.05 was added to account for zero values and achieve a distribution as closely to normal as possible.
Fig. 2
Fig. 2. Multiple relationships of capnovolumetric parameters and clinical signs and symptoms.
Quantitative network diagram comprising two capnovolumetric parameters and patients’ clinical history and symptoms. The area of the circles indicates the frequency of positive answers or positive conditions of capnovolumetric parameters compared to the cut-off values (see text). The thickness of the arrows is proportional to the respective phi-coefficients as measures of the strength of association, ranging in absolute values from 0.09 (thin line) to 0.40 (thick line) if significantly different from zero. The numerical values of phi-coefficients are given in Supplementary Table S2; the frequency of positive answers to anamnestic questions or positive capnovolumetric conditions in Supplementary Table S3. Both are indicated in the diagram.
Fig. 3
Fig. 3. Decision tree for the comparison of COPD with control.
Only patients with COPD and the control group were included. Anamnestic questions (wheezing in the past 12 months, dyspnea at strong or mild exertion, cough, phlegm, current smoker, ex-smoker) and capnovolumetric parameters (s3/s2, volume phase 2, area/volume phase 3, slope of phase 3) were offered to the algorithm (CHAID), which selected the optimal criteria. The figure shows the average result of a tenfold cross-validation.
Fig. 4
Fig. 4. Decision tree for the comparison of asthma with control.
Only patients with asthma and the control group were included. Anamnestic questions (wheezing in the past 12 months, dyspnea at strong or mild exertion, cough, phlegm, current smoker, ex-smoker) and capnovolumetric parameters (s3/s2, volume phase 2, area/volume phase 3, slope of phase 3) were offered to the algorithm (CHAID), which selected the optimal criteria. The figure shows the average result of a tenfold cross-validation.
Fig. 5
Fig. 5. Decision tree for the comparison of asthma with COPD.
Only patients with asthma or COPD were included. Anamnestic questions (wheezing in the past 12 months, dyspnea at strong or mild exertion, cough, phlegm, current smoker, ex-smoker) and capnovolumetric parameters (s3/s2, volume phase 2, area/volume phase 3, slope of phase 3) were offered to the algorithm (CHAID), which selected the optimal criteria. The figure shows the average result of a tenfold cross-validation.

References

    1. Kellerer C, et al. Diagnostic accuracy of capnovolumetry for the identification of airway obstruction - results of a diagnostic study in ambulatory care. Respir. Res. 2019;20:p. 92. doi: 10.1186/s12931-019-1067-1. - DOI - PMC - PubMed
    1. Steiss J, Rudloff S, Landmann E, Zimmer K, Lindemann H. Capnovolumetry: a new tool for lung function testing in children with asthma. Clin. Physiol. Funct. imaging. 2008;28:332–336. doi: 10.1111/j.1475-097X.2008.00815.x. - DOI - PubMed
    1. Hoffbrand B. The expiratory capnogram: a measure of ventilation-perfusion inequalities. Thorax. 1966;21:518–523. doi: 10.1136/thx.21.6.518. - DOI - PMC - PubMed
    1. Ponto S, Aufderhaar M, Bauer J. Kapnovolumetrie als mitarbeitsfreie methode für die diagnostik und überwachung von COPD. Pneumologie. 2016;70:826–830. - PubMed
    1. Schneider A, et al. Diagnostic accuracy of spirometry in primary care. BMC Pulm. Med. 2009;9:31. doi: 10.1186/1471-2466-9-31. - DOI - PMC - PubMed