

Immune network dysregulation precedes clinical diagnosis of asthma
- PMID: 32732938
- PMCID: PMC7393349
- DOI: 10.1038/s41598-020-69494-x
Immune network dysregulation precedes clinical diagnosis of asthma
Abstract
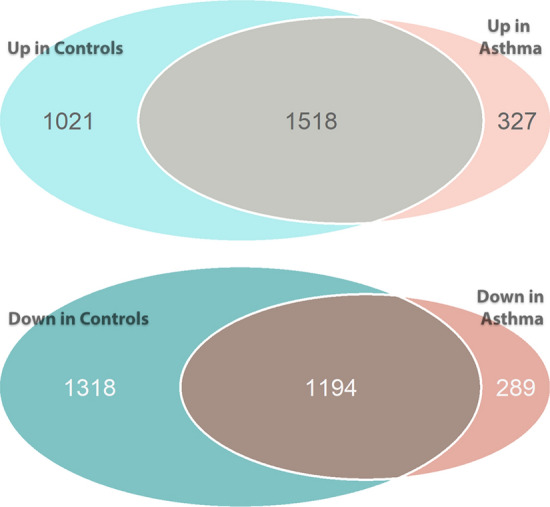
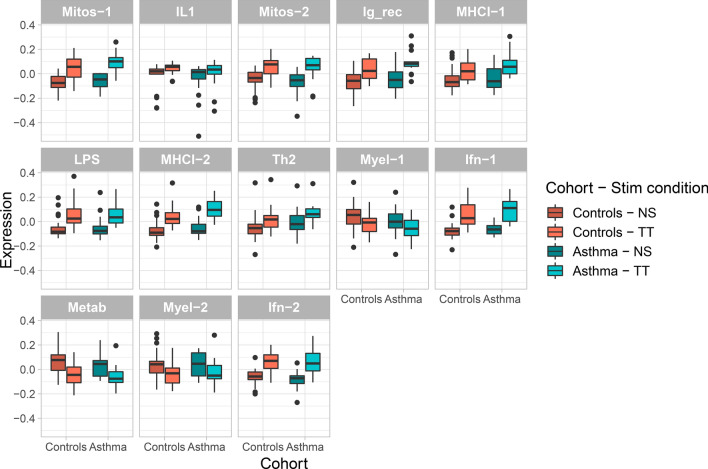
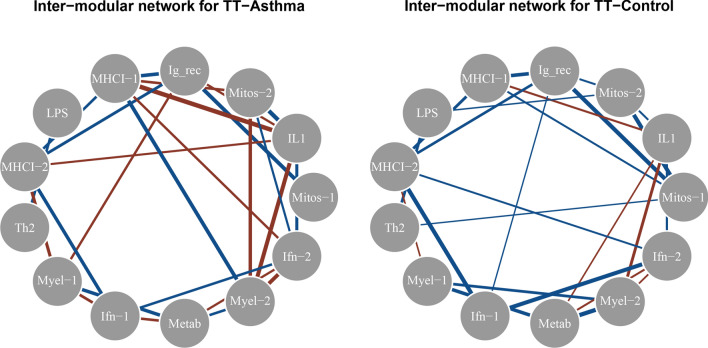
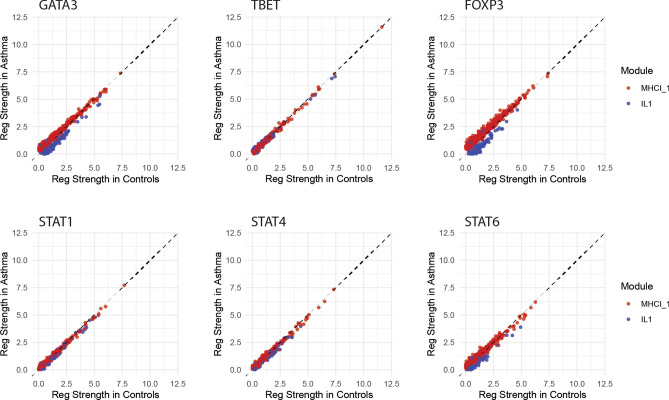
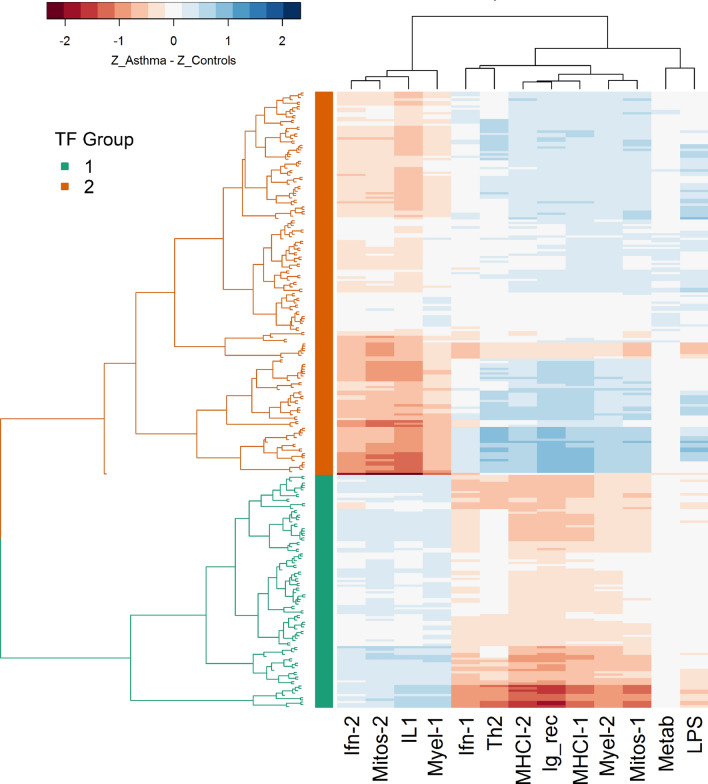
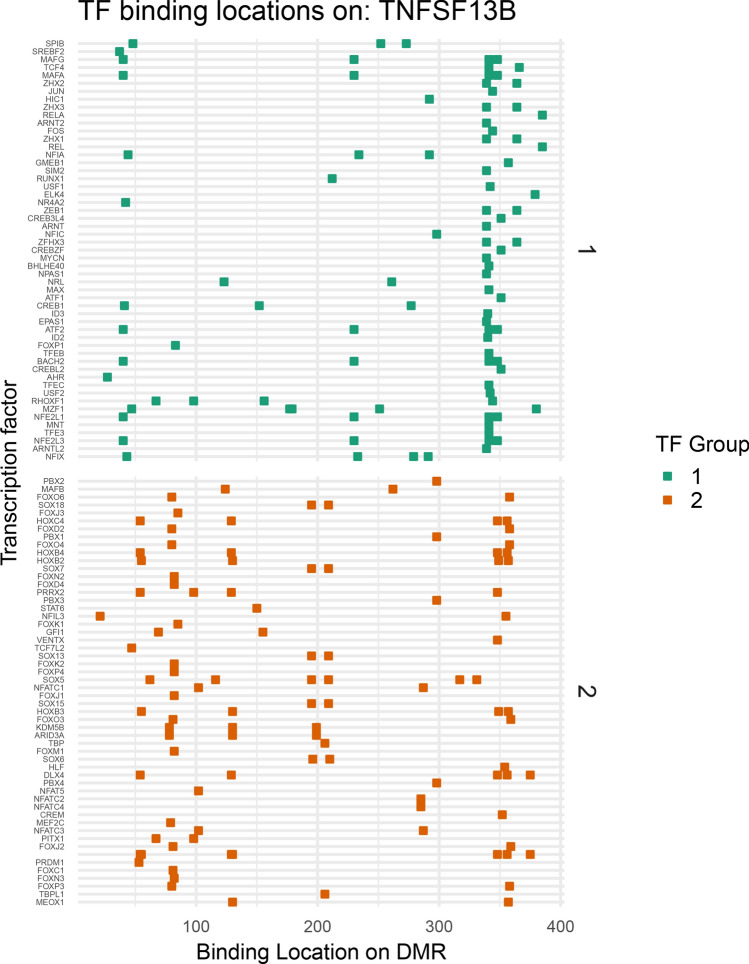
Allergic asthma is a chronic disease beginning in childhood that is characterized by dominant T-helper 2 cell activation without adequate counter-regulation by T-helper 1 cell and regulatory T cell activity. Prior transcriptomic studies of childhood asthma have primarily investigated subjects who already have a disease diagnosis, and have generally taken an approach of differential gene expression as opposed to differential gene interactions. The immune states that predispose towards allergic sensitization and disease development remain ill defined. We thus characterize immune networks of asthmatic predisposition in children at the age of 2, prior to the diagnosis of allergic asthma, who are subsequently diagnosed with asthma at the age of 7. We show extensive differences of gene expression networks and gene regulatory networks in children who develop asthma versus those who do not using transcriptomic data from stimulated peripheral blood mononuclear cells. Moreover, transcription factors that bind proximally to one another share patterns of dysregulation, suggesting that network differences prior to asthma diagnosis result from altered accessibility of gene targets. In summary, we demonstrate non-allergen-specific immune network dysregulation in individuals long before clinical asthma diagnosis.
Conflict of interest statement
The authors declare no competing interests.
Figures
Similar articles
-
Genetic profiles of transcriptomic clusters of childhood asthma determine specific severe subtype.Clin Exp Allergy. 2018 Sep;48(9):1164-1172. doi: 10.1111/cea.13175. Epub 2018 Jun 5. Clin Exp Allergy. 2018. PMID: 29758111
-
[Changes of regulatory T cells and T helper cells in peripheral blood and their roles in the severity evaluation in children with asthma].Zhongguo Dang Dai Er Ke Za Zhi. 2011 Jun;13(6):482-6. Zhongguo Dang Dai Er Ke Za Zhi. 2011. PMID: 21672423 Chinese.
-
Transcriptional Profiling of Th2 Cells Identifies Pathogenic Features Associated with Asthma.J Immunol. 2016 Jul 15;197(2):655-64. doi: 10.4049/jimmunol.1600397. Epub 2016 Jun 6. J Immunol. 2016. PMID: 27271570 Free PMC article.
-
T-lymphocyte dysregulation in asthma.Proc Soc Exp Biol Med. 1994 Dec;207(3):243-53. doi: 10.3181/00379727-207-43813a. Proc Soc Exp Biol Med. 1994. PMID: 7800679 Review.
-
T-cell subsets in the pathogenesis of human asthma.Curr Allergy Asthma Rep. 2006 Mar;6(2):91-6. doi: 10.1007/s11882-006-0045-0. Curr Allergy Asthma Rep. 2006. PMID: 16566857 Review.
Cited by
-
BORN TO WHEEZE OR LEARNED WHEN WE WERE YOUNG: MATERNAL AND ENVIRONMENTAL FACTORS INFLUENCE ATOPIC RISK.Trans Am Clin Climatol Assoc. 2023;133:181-192. Trans Am Clin Climatol Assoc. 2023. PMID: 37701609 Free PMC article.
-
Childhood asthma phenotypes and endotypes: a glance into the mosaic.Mol Cell Pediatr. 2023 Aug 30;10(1):9. doi: 10.1186/s40348-023-00159-1. Mol Cell Pediatr. 2023. PMID: 37646843 Free PMC article. Review.
-
Risk of long covid in patients with pre-existing chronic respiratory diseases: a systematic review and meta-analysis.BMJ Open Respir Res. 2025 Jan 30;12(1):e002528. doi: 10.1136/bmjresp-2024-002528. BMJ Open Respir Res. 2025. PMID: 39884720 Free PMC article.
