

Nested whole-genome duplications coincide with diversification and high morphological disparity in Brassicaceae
- PMID: 32732942
- PMCID: PMC7393125
- DOI: 10.1038/s41467-020-17605-7
Nested whole-genome duplications coincide with diversification and high morphological disparity in Brassicaceae
Abstract
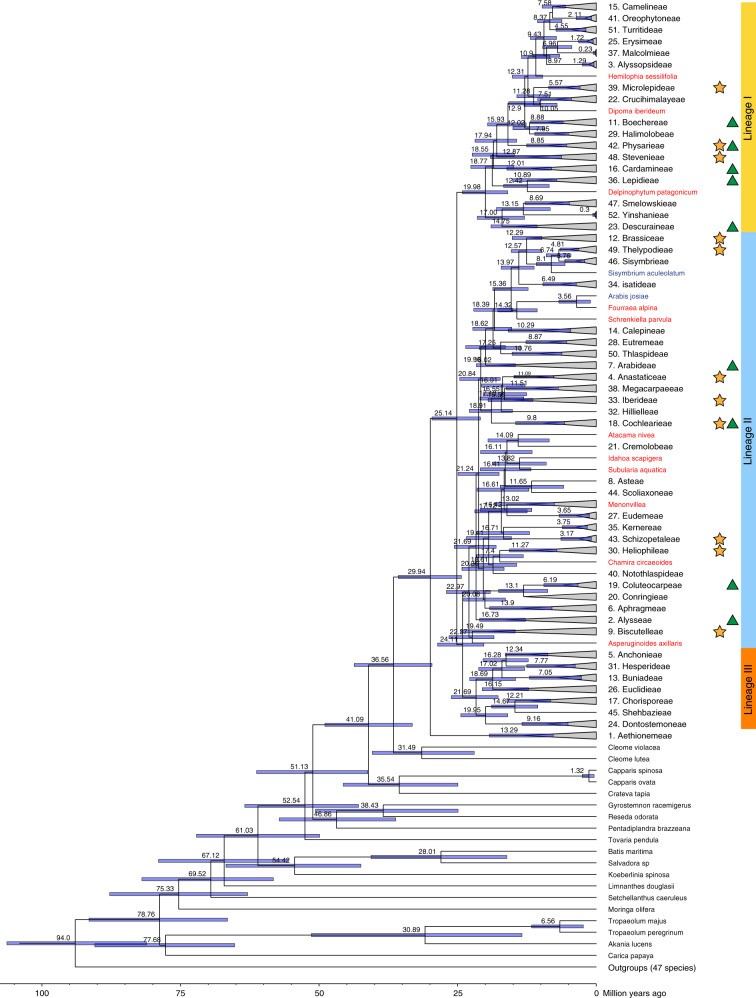
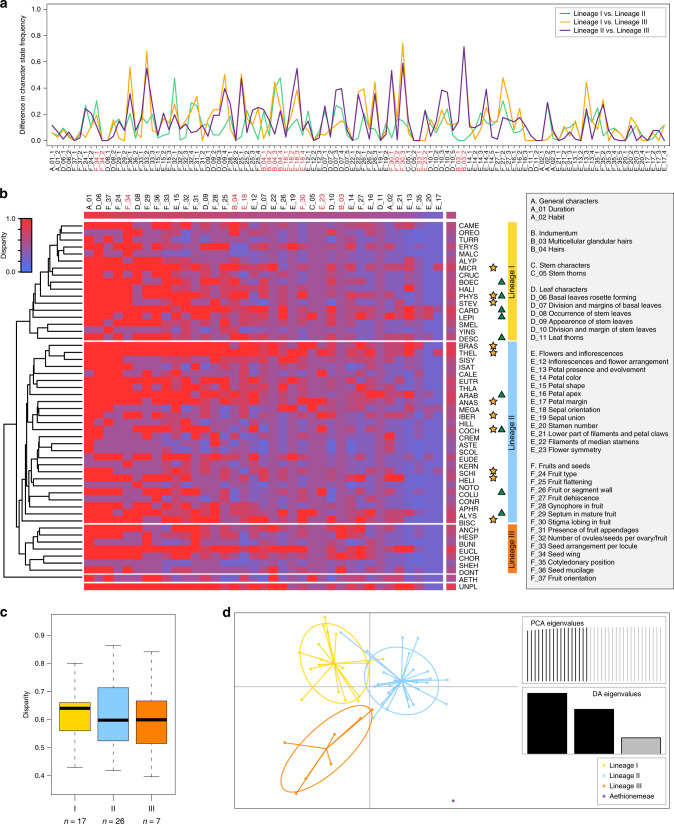
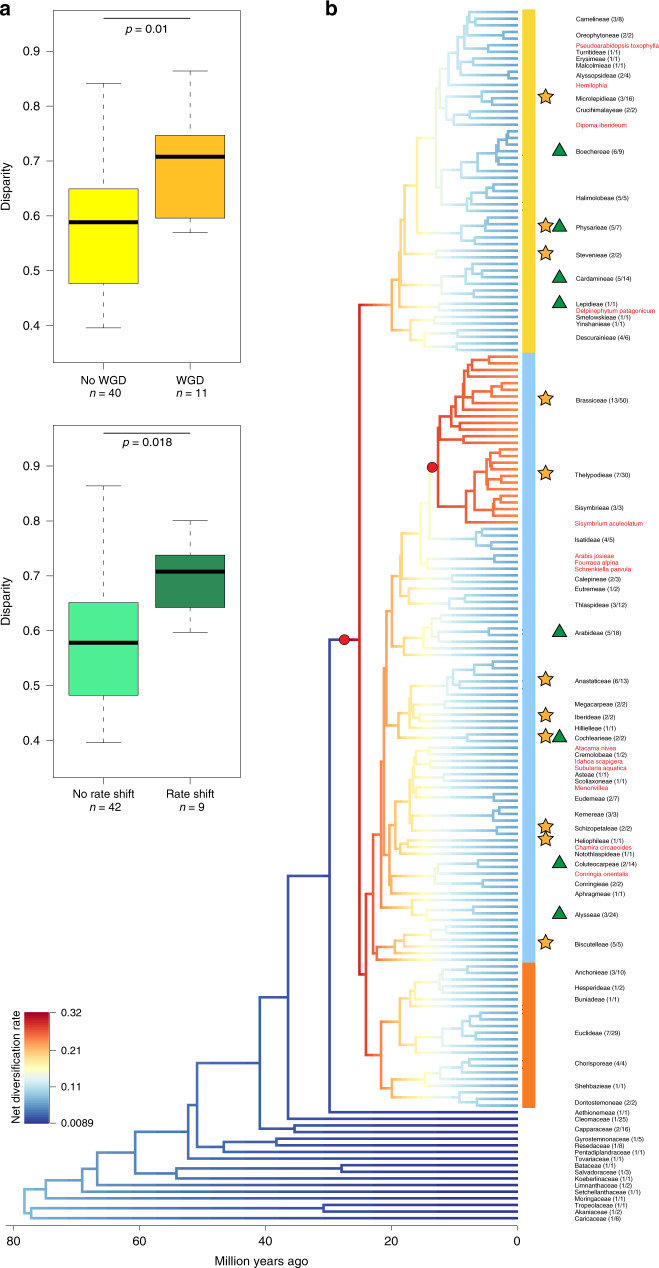
Angiosperms have become the dominant terrestrial plant group by diversifying for ~145 million years into a broad range of environments. During the course of evolution, numerous morphological innovations arose, often preceded by whole genome duplications (WGD). The mustard family (Brassicaceae), a successful angiosperm clade with ~4000 species, has been diversifying into many evolutionary lineages for more than 30 million years. Here we develop a species inventory, analyze morphological variation, and present a maternal, plastome-based genus-level phylogeny. We show that increased morphological disparity, despite an apparent absence of clade-specific morphological innovations, is found in tribes with WGDs or diversification rate shifts. Both are important processes in Brassicaceae, resulting in an overall high net diversification rate. Character states show frequent and independent gain and loss, and form varying combinations. Therefore, Brassicaceae pave the way to concepts of phylogenetic genome-wide association studies to analyze the evolution of morphological form and function.
Conflict of interest statement
The authors declare no competing interests.
Figures
Similar articles
-
Diverse genome organization following 13 independent mesopolyploid events in Brassicaceae contrasts with convergent patterns of gene retention.Plant J. 2017 Jul;91(1):3-21. doi: 10.1111/tpj.13553. Epub 2017 May 11. Plant J. 2017. PMID: 28370611
-
Temporal patterns of diversification in Brassicaceae demonstrate decoupling of rate shifts and mesopolyploidization events.Ann Bot. 2020 Jan 8;125(1):29-47. doi: 10.1093/aob/mcz123. Ann Bot. 2020. PMID: 31314080 Free PMC article.
-
Lessons from Cleomaceae, the Sister of Crucifers.Trends Plant Sci. 2018 Sep;23(9):808-821. doi: 10.1016/j.tplants.2018.06.010. Epub 2018 Jul 11. Trends Plant Sci. 2018. PMID: 30006074 Review.
-
Resolution of Brassicaceae Phylogeny Using Nuclear Genes Uncovers Nested Radiations and Supports Convergent Morphological Evolution.Mol Biol Evol. 2016 Feb;33(2):394-412. doi: 10.1093/molbev/msv226. Epub 2015 Oct 29. Mol Biol Evol. 2016. PMID: 26516094 Free PMC article.
-
Ancient whole genome duplications, novelty and diversification: the WGD Radiation Lag-Time Model.Curr Opin Plant Biol. 2012 Apr;15(2):147-53. doi: 10.1016/j.pbi.2012.03.011. Epub 2012 Apr 3. Curr Opin Plant Biol. 2012. PMID: 22480429 Review.
Cited by
-
Evolutionary Dynamics of FLC-like MADS-Box Genes in Brassicaceae.Plants (Basel). 2023 Sep 15;12(18):3281. doi: 10.3390/plants12183281. Plants (Basel). 2023. PMID: 37765445 Free PMC article.
-
Gene duplications and phylogenomic conflict underlie major pulses of phenotypic evolution in gymnosperms.Nat Plants. 2021 Aug;7(8):1015-1025. doi: 10.1038/s41477-021-00964-4. Epub 2021 Jul 19. Nat Plants. 2021. PMID: 34282286
-
Underestimated diversity in high elevations of a global biodiversity hotspot: two new endemic species of Aethionema (Brassicaceae) from the alpine zone of Iran.Front Plant Sci. 2023 May 26;14:1182073. doi: 10.3389/fpls.2023.1182073. eCollection 2023. Front Plant Sci. 2023. PMID: 37304726 Free PMC article.
-
A story from the Miocene: Clock-dated phylogeny of Sisymbrium L. (Sisymbrieae, Brassicaceae).Ecol Evol. 2021 Mar 2;11(6):2573-2595. doi: 10.1002/ece3.7217. eCollection 2021 Mar. Ecol Evol. 2021. PMID: 33767822 Free PMC article.
-
Charting the genomic landscape of seed-free plants.Nat Plants. 2021 May;7(5):554-565. doi: 10.1038/s41477-021-00888-z. Epub 2021 Apr 5. Nat Plants. 2021. PMID: 33820965 Review.
References
-
- Foote M. The evolution of morphological diversity. Annu. Rev. Ecol. Syst. 1997;28:129–152.
-
- Clark JW, Donoghue PCJ. Whole-genome duplication and plant macroevolution. Trends Plant Sci. 2018;23:933–945. - PubMed
Publication types
MeSH terms
Associated data
LinkOut - more resources
Full Text Sources
