

Exploiting graphlet decomposition to explain the structure of complex networks: the GHuST framework
- PMID: 32732972
- PMCID: PMC7393148
- DOI: 10.1038/s41598-020-69795-1
Exploiting graphlet decomposition to explain the structure of complex networks: the GHuST framework
Abstract
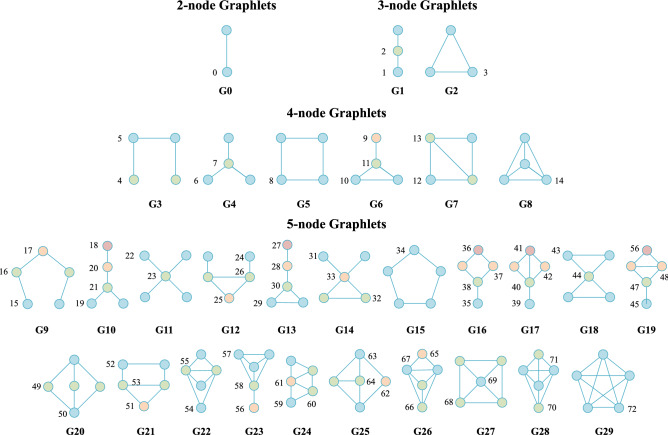
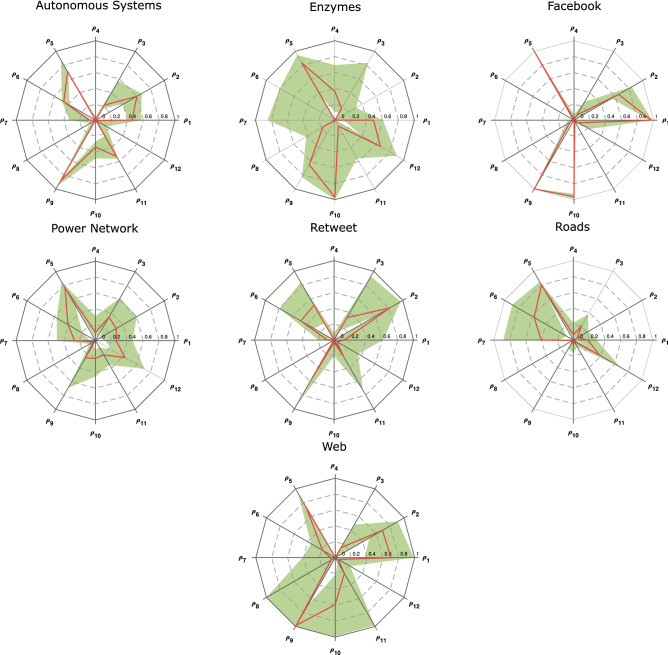
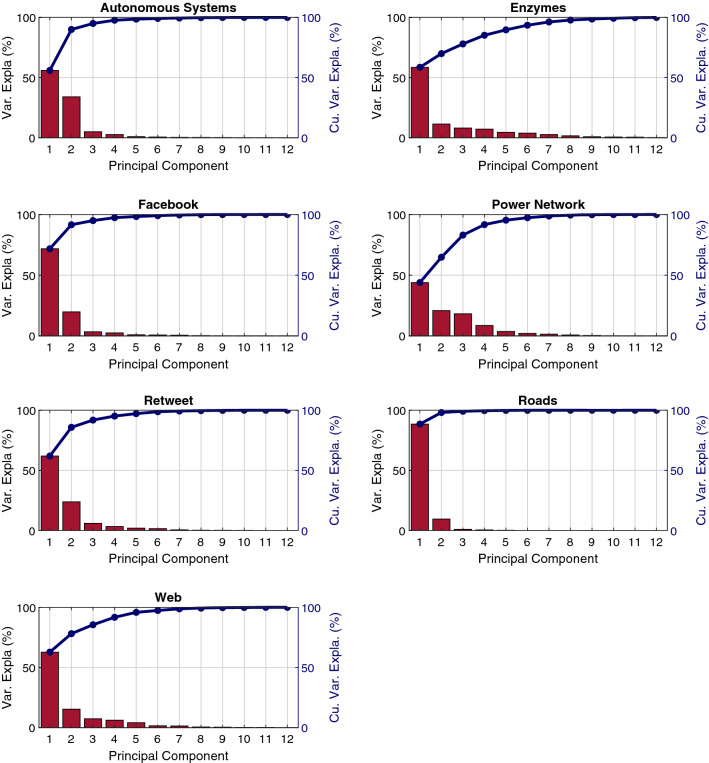
The characterization of topology is crucial in understanding network evolution and behavior. This paper presents an innovative approach, the GHuST framework to describe complex-network topology from graphlet decomposition. This new framework exploits the local information provided by graphlets to give a global explanation of network topology. The GHuST framework is comprised of 12 metrics that analyze how 2- and 3-node graphlets shape the structure of networks. The main strengths of the GHuST framework are enhanced topological description, size independence, and computational simplicity. It allows for straight comparison among different networks disregarding their size. It also reduces the complexity of graphlet counting, since it does not use 4- and 5-node graphlets. The application of the novel framework to a large set of networks shows that it can classify networks of distinct nature based on their topological properties. To ease network classification and enhance the graphical representation of them, we reduce the 12 dimensions to their main principal components. Furthermore, the 12 dimensions are easily interpretable. This enables the connection between complex-network analyses and diverse real applications.
Conflict of interest statement
The authors declare no competing interests.
Figures


Similar articles
-
LoTo: a graphlet based method for the comparison of local topology between gene regulatory networks.PeerJ. 2017 Feb 28;5:e3052. doi: 10.7717/peerj.3052. eCollection 2017. PeerJ. 2017. PMID: 28265516 Free PMC article.
-
IncGraph: Incremental graphlet counting for topology optimisation.PLoS One. 2018 Apr 26;13(4):e0195997. doi: 10.1371/journal.pone.0195997. eCollection 2018. PLoS One. 2018. PMID: 29698494 Free PMC article.
-
Graphlet Laplacians for topology-function and topology-disease relationships.Bioinformatics. 2019 Dec 15;35(24):5226-5234. doi: 10.1093/bioinformatics/btz455. Bioinformatics. 2019. PMID: 31192358
-
Comparison of tissue/disease specific integrated networks using directed graphlet signatures.BMC Bioinformatics. 2017 Mar 22;18(Suppl 4):135. doi: 10.1186/s12859-017-1525-z. BMC Bioinformatics. 2017. PMID: 28361704 Free PMC article.
-
Evaluating network inference methods in terms of their ability to preserve the topology and complexity of genetic networks.Semin Cell Dev Biol. 2016 Mar;51:44-52. doi: 10.1016/j.semcdb.2016.01.012. Epub 2016 Feb 3. Semin Cell Dev Biol. 2016. PMID: 26851626 Review.
Cited by
-
Disentangling microbial networks across pelagic zones in the tropical and subtropical global ocean.Nat Commun. 2024 Jan 2;15(1):126. doi: 10.1038/s41467-023-44550-y. Nat Commun. 2024. PMID: 38168083 Free PMC article.
References
-
- Boccaletti S, Latora V, Moreno Y, Chavez M, Hwang D-U. Complex networks: Structure and dynamics. Phys. Rep. 2006;424:175–308. doi: 10.1016/j.physrep.2005.10.009. - DOI
-
- Newman M. Networks: An Introduction. Oxford: Oxford University Press; 2010.
Grants and funding
LinkOut - more resources
Full Text Sources
