. 2020 Jul 30;10(1):12840.
doi: 10.1038/s41598-020-69709-1.

Fluorescence-assisted sequential insertion of transgenes (FASIT): an approach for increasing specific productivity in mammalian cells

Affiliations

Fluorescence-assisted sequential insertion of transgenes (FASIT): an approach for increasing specific productivity in mammalian cells

Felipe E Bravo et al. Sci Rep. .

Abstract

Currently, the generation of cell lines for the production of recombinant proteins has the limitation of unstable gene expression due to the repeat-induced gene silencing or the loss of transgene copies resulting from recombination events. In this work, we developed a new strategy based on the sequential insertion of transgenes for generating stable clones producing high levels of a chimeric human follicle-stimulating hormone (hscFSH). Gene insertion was done by transducing HEK-293 cells with a lentiviral vector containing a bicistronic transcriptional unit for expressing hscFSH and GFP genes. Clone selection was performed by flow cytometry coupled to cell sorting, and the GFP gene was further removed by CRE-mediated site-specific recombination. High-producing clones of hscFSH were obtained after three rounds of lentiviral transduction. Expression levels increased in a step-wise manner from 7 to 23 pg/cell/day, with a relatively constant rate of 7 pg/cell/day in each round of transduction. The GFP gene was successfully removed from the cell genome without disturbing the hscFSH gene expression. Clones generated using this approach showed stable expression levels for more than two years. This is the first report describing the sequential insertion of transgenes as an alternative for increasing the expression levels of transformed cell lines. The methodology described here could notably impact on biotechnological industry by improving the capacity of mammalian cells to produce biopharmaceuticals.


Conflict of interest statement

The authors declare no competing interests.

Figures

Figure 1
Figure 1
Diagram of genetic arrangements and molecular events governing the general strategy for sequential insertion of transgenes. CMVp early/immediate citomegalovirus promoter, ChI Chimeric intron, hscFSH human single-chain Follicle-stimulating hormone, IRES internal ribosome entry site, GFP green fluorescent protein, PA poly-adenylation sequence, LoxP Target site for the CRE recombinase.
Figure 2
Figure 2
Photomicrographs and histograms of clones selected after the transfection of HEK-293 cells with the plasmid pEntry-hscFSH. Variable expression levels of GFP were detected in the different clones by observation at the fluorescence microscope.
Figure 3
Figure 3
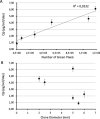
Relationship among the Qp of hscFSH, the GFP expression levels, and the size of clones after their selection with G418. (A) Association between the Qp of hscFSH and the fluorescence intensity designated as number of green pixels. (B) Relationship between the Qp of hscFSH and the clone diameter. Bars represent the standard deviation.
Figure 4
Figure 4
Insertion of the first hscFSH copy by lentiviral transduction. (A) Bright field and dark field photomicrographs of HEK-293 cells transduced with the lentiviral vector LCW-hscFSH at a MOI of 0.01. (B) Forward versus side scatter plots of HEK-293 cells transduced with the lentiviral vector LCW-hscFSH. Cells were gated (P1) and analyzed for GFP expression. (C) Histogram of HEK-293 cells expressing GFP. Highly fluorescent cells (P1) were sorted directly into a 96 well plate. (D) Bright and dark field photomicrographs of the clone FSH3 selected by flow cytometry and cell sorting. (E) Qp of hscFSH from seven fluorescent clones. Bars represent the standard deviation. Qp values from different clones were compared by the Kruskal–Wallis test and the Dunn post-test.
Figure 5
Figure 5
Removal of GFP gene by site-specific recombination using the recombinase CRE. (A) Bright and dark field photomicrographs of the clone FSH3 transfected with the plasmid pAEC-CRE. Arrows in the dark field show cells without GFP expression. (B) Analysis of the GFP expression by flow cytometry. The sorted gate is indicated as P2. (C) Bright and dark field photomicrographs of the non-fluorescent clone FSH3III selected by flow cytometry and cell sorting. (D) Qp of hscFSH from seven non-fluorescent clones. Bars represent the standard deviation. Qp values from different clones were compared by the Kruskal–Wallis test and the Dunn post-test. (E) Western-blot of the hscFSH protein from the clone FSH3 before and after removing the GFP gene (clone FSH3III). Non-transduced cells were used as a negative control (C−). The reaction was visualized using the imaging system ODYSSEY CLx and the software Image Studio version 3.1 (https://www.licor.com/bio/image-studio-lite/download).
Figure 6
Figure 6
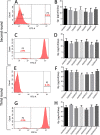
Sequential insertion and deletion of transgenes from the HEK-293 genome. The FSH3III clone was subjected to two additional rounds of transgene insertion. Histograms of the GFP expression are shown in panels A, C, E and G. The gate and the percentage of sorted cells are shown. Seven clones were amplified in every round of selection. The Qp of these clones is shown in graphs B, D, F and H. Bars represent the standard deviation. Qp values from different clones were compared by the Kruskal–Wallis test and the Dunn post-test.
Figure 7
Figure 7
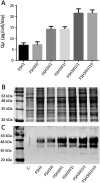
Increase of the hscFSH expression levels in clones with several rounds of lentiviral transduction. (A) Quantification of hscFSH Qp from three clones with one, two or three rounds of hscFSH gene insertion and GFP gene deletion. Bars represent the standard deviation. Qp values corresponding to the clones with and without the fluorescent marker were compared by the Mann Whitney test. Detection of the hscFSH protein by SDS-PAGE (B) and Western-blot (C) from the supernatant of the previous clones. The hscFSH protein was immunoidentified using a mouse anti-human FSH-beta antibody and a goat anti-mouse IgG [H&L] conjugated to IRDye 800. Non-transduced cells were used as a negative control (C−). The reaction was visualized using the imaging system ODYSSEY CLx and the software Image Studio version 3.1 (https://www.licor.com/bio/image-studio-lite/download).

Similar articles

Cited by

References

    1. Sanchez-Garcia L, et al. Recombinant pharmaceuticals from microbial cells: A 2015 update. Microb. Cell Fact. 2016 doi: 10.1186/s12934-016-0437-3. - DOI - PMC - PubMed
    1. Butler M. Animal cell cultures: Recent achievements and perspectives in the production of biopharmaceuticals. Appl. Microbiol. Biotechnol. 2005 doi: 10.1007/s00253-005-1980-8. - DOI - PubMed
    1. Kwaks THJ, Otte AP. Employing epigenetics to augment the expression of therapeutic proteins in mammalian cells. Trends Biotechnol. 2006 doi: 10.1016/j.tibtech.2006.01.007. - DOI - PubMed
    1. Lattenmayer C, et al. Identification of transgene integration loci of different highly expressing recombinant CHO cell lines by FISH. Cytotechnology. 2006 doi: 10.1007/s10616-006-9029-0. - DOI - PMC - PubMed
    1. Schimke RT, Roos DS, Brown PC. Amplification of genes in somatic mammalian cells. Methods Enzymol. 1987 doi: 10.1016/S0076-6879(87)51010-2. - DOI - PubMed

Publication types

Substances