. 2020 Jul 30;3(1):404.
doi: 10.1038/s42003-020-01130-w.

A gain of function mutation in SlNRC4a enhances basal immunity resulting in broad-spectrum disease resistance

Affiliations

A gain of function mutation in SlNRC4a enhances basal immunity resulting in broad-spectrum disease resistance

Lorena Pizarro et al. Commun Biol. .

Abstract

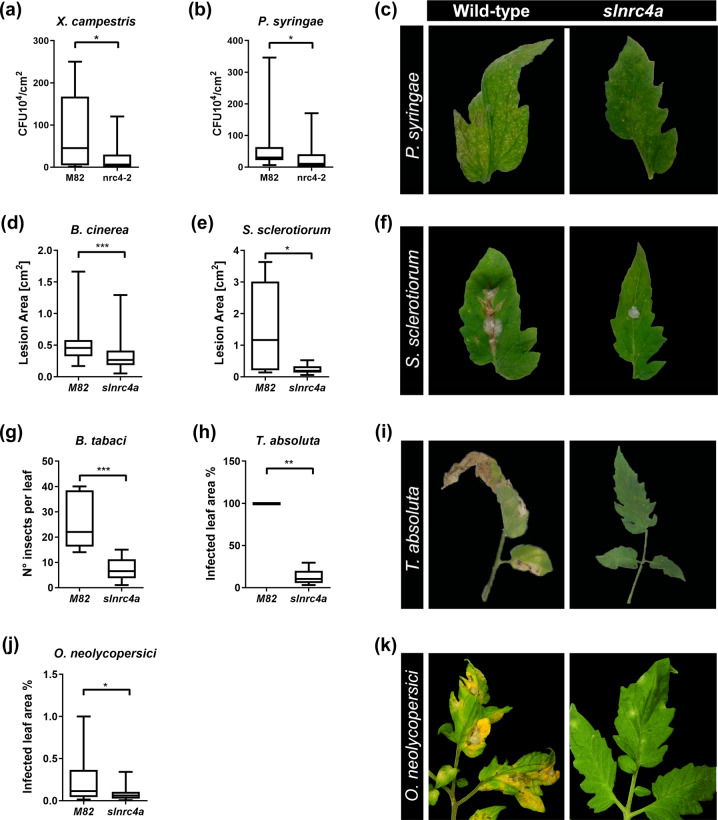
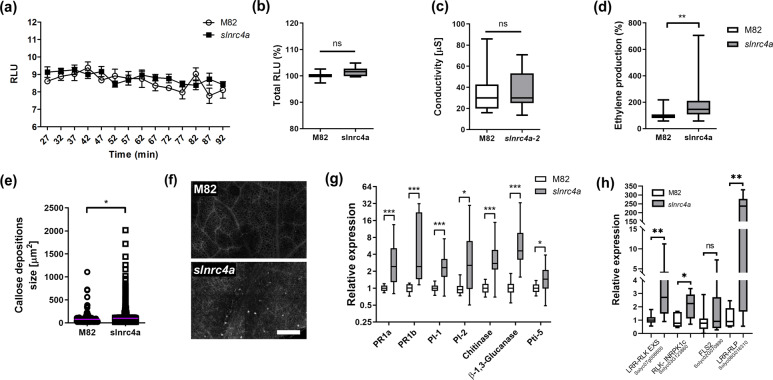
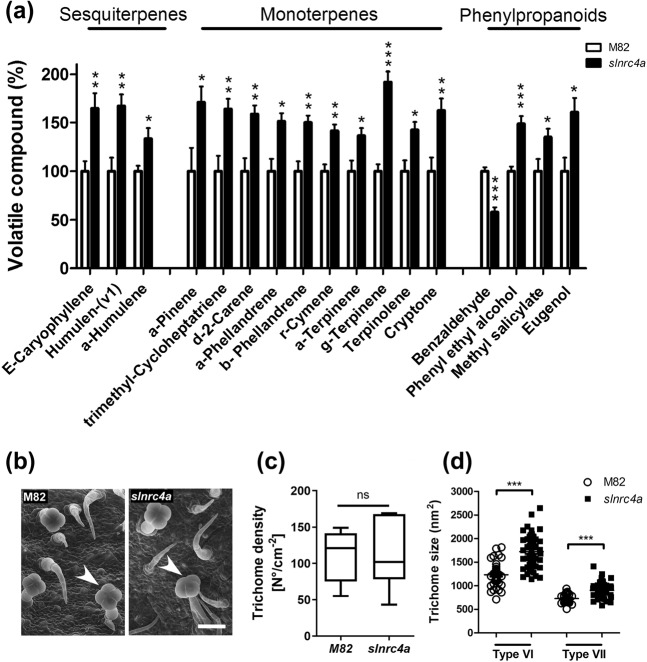
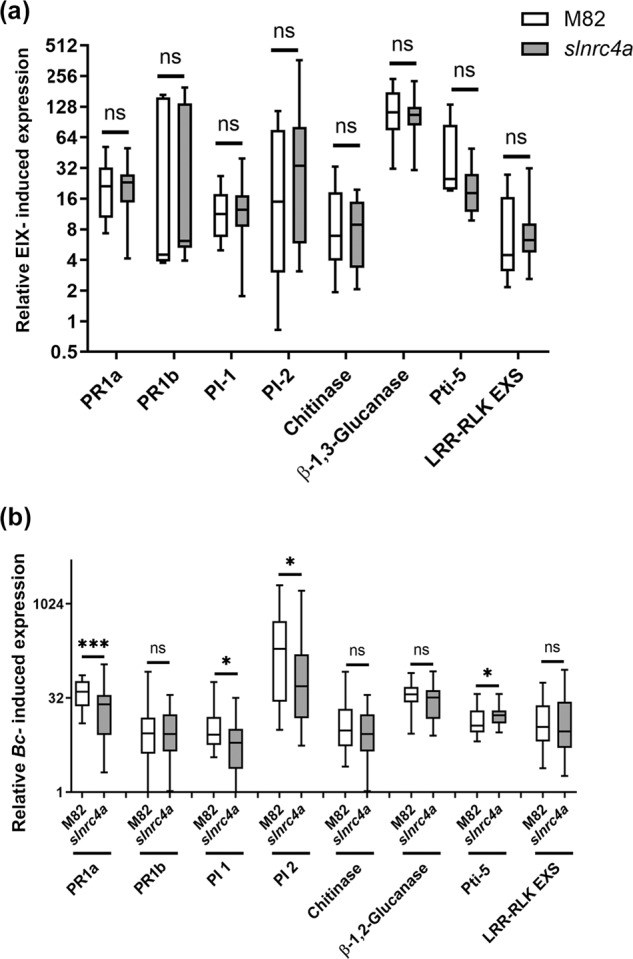
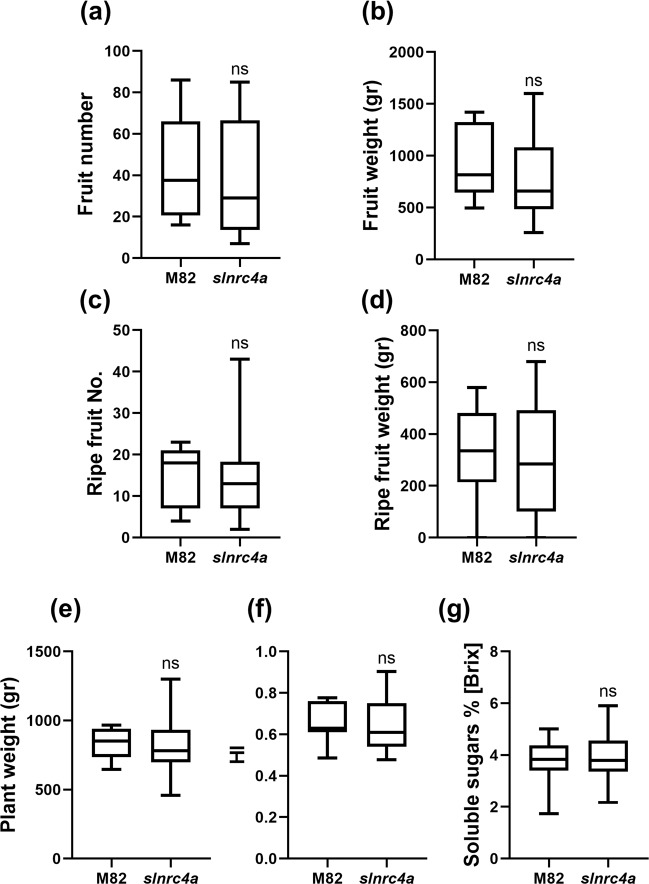
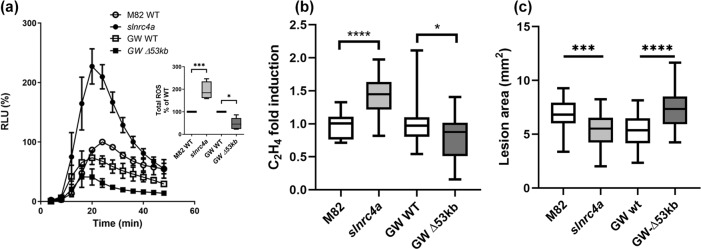
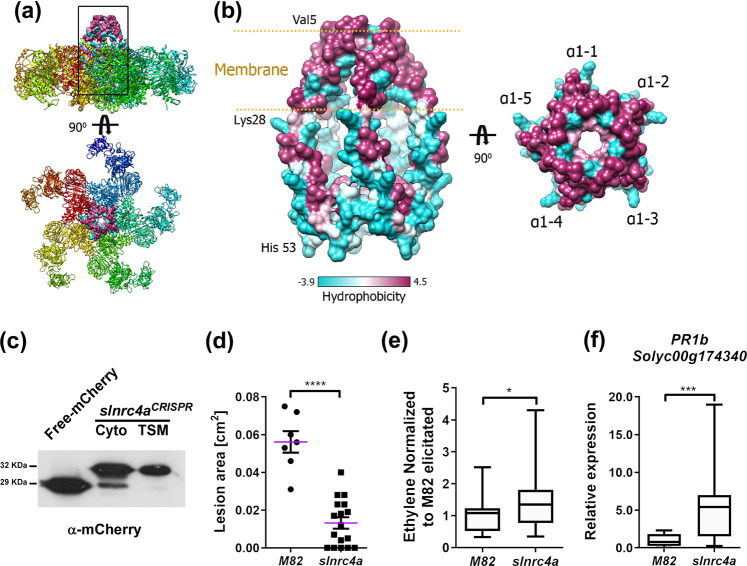
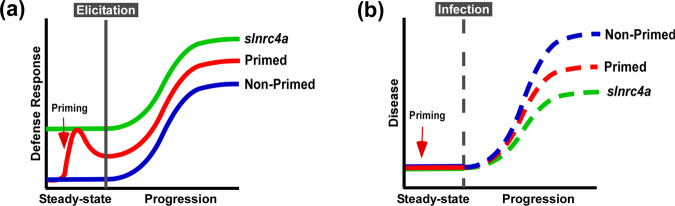
Plants rely on innate immunity to perceive and ward off microbes and pests, and are able to overcome the majority of invading microorganisms. Even so, specialized pathogens overcome plant defenses, posing a persistent threat to crop and food security worldwide, raising the need for agricultural products with broad, efficient resistance. Here we report a specific mutation in a tomato (S. lycopersicum) helper nucleotide-binding domain leucine-rich repeat H-NLR, SlNRC4a, which results in gain of function constitutive basal defense activation, in absence of PRR activation. Knockout of the entire NRC4 clade in tomato was reported to compromise Rpi-blb2 mediated immunity. The SlNRC4a mutant reported here possesses enhanced immunity and disease resistance to a broad-spectrum of pathogenic fungi, bacteria and pests, while lacking auto-activated HR or negative effects on plant growth and crop yield, providing promising prospects for agricultural adaptation in the war against plant pathogens that decrease productivity.


Conflict of interest statement

The authors declare no competing interests.

Figures

Fig. 1
Fig. 1. slnrc4a gain of function mutant presents enhanced resistance to diverse plant pathogens and pests.
WT (cv M82) and slnrc4a plants were challenged with several pathogens and pests. Bacterial growth (CFU) was measured 3 days after inoculation with (a) X. campestris (10X5 CFU/mL) and (b) P. syringae (10X5 CFU/mL). c Representative images of P. syringae symptomatic leaves. The lesion area was measured 3 days after inoculation with (d) B. cinerea (10X6 spores/mL) (e) S. sclerotium (10X6 spores/mL). f Representative images of S. sclerotium symptomatic leaves. Infestation was determined by counting number of insects per leaf and measuring % of infected leaf area two-weeks after (g) B. tabaci and (h) T. absoluta exposure, respectively. i Representative images of T. absoluta symptomatic leaves. jO. neolycopersici infection was measured as percentage of infected leaf out of total leaf area. k Representative images of O. neolycopersici symptomatic leaves. Average ± SEM of 3–4 independent replicates is shown. a, b, d, e, g, h, j Boxplots are shown with the inter-quartile-ranges (box), medians (black line in box) and outer quartile whiskers, minimum to maximum values. Asterisks represent statistical significance in t-test with welch correction (*p-value <0.05; **p-value < 0.01; ***p-value < 0.001).
Fig. 2
Fig. 2. slnrc4a gain of function mutant has elevated defense parameters in steady state condition.
a ROS production was measured every 5 min for 90 min in WT (cv M82) and slnrc4a line using the HRP-luminol method. Average ± SEM of four independent replicates is shown (two-way ANOVA, no significant difference). b Total ROS production presented in a. Average ± SEM of four independent replicates is shown (one-way ANOVA, no significant difference). c Conductivity levels of M82 and slnrc4a samples immersed in water for 24 h was measured. Average ± SEM of four independent replicates is shown (one-way ANOVA, no significant difference). d Ethylene production of M82 and slnrc4a samples was measured using gas chromatography. M82 average ethylene production is defined as 100%. Average ± SEM of five independent experiments is presented. Asterisks represent statistical significance in t-test with welch correction (**p-value < 0.01). e Callose deposition was observed by confocal microscopy after aniline blue staining of M82 and slnrc4a leaf discs. Callose deposit size was measured using the object counting tool of ImageJ. Average ± SEM of three independent replicates is shown, all individual values presented, line indicates mean. Asterisks represent statistical significance in t-test with welch correction (*p-value <0.05). f Callose deposition representative images. Scale bar = 200 µm. g Gene expression analysis of pathogen responsive genes in M82 and slnrc4a plants was measured by RT-qPCR. Relative expression normalized to M82. Average ± SEM of three independent replicates is shown. Asterisks represent statistical significance in t-test with welch correction comparing each gene (*p-value < 0.05; ***p-value < 0.001). h Gene expression analysis of PRR genes in M82 and slnrc4a plants was measured by RT-qPCR. Relative expression normalized to M82. Average ± SEM of three independent replicates is shown. Asterisks represent statistical significance in t-test with Welch’s correction comparing each gene (*p-value < 0.05; **p-value < 0.01). bd, g, h Boxplots are shown with the inter-quartile-ranges (box), medians (black line in box) and outer quartile whiskers, minimum to maximum values.
Fig. 3
Fig. 3. slnrc4a gain of function mutant has elevated defense metabolites and increased trichome head size.
a Volatile metabolome was performed for M82 and slnrc4a. Compound level was normalized to M82. Significantly different Sesquiterpenes, monoterpenes and phenylpropanoids are shown. Average ± SEM of three independent replicates is shown. Asterisks represent statistical significance in t-test with welch correction for each compound (*p-value < 0.05; **p-value < 0.01; ***p-value < 0.001). b Scanning electron microscope images of young M82 and slnrc4a leaves of Type VI glandular trichomes with four head cells. Arrowheads indicated type VI glandular trichome. Scale bar = 50 µm. c, d Trichome density and size was determined using ImageJ. Average ± SEM of three independent replicates is shown. Asterisks represent statistical significance in t-test with welch correction for each trichome type (***p-value < 0.001). c Boxplot with inter-quartile-ranges (box), medians (black line in box) and outer quartile whiskers, minimum to maximum values. d All individual values presented, line indicates mean.
Fig. 4
Fig. 4. Defense gene induction is similar in M82 and slnrc4a in response to MAMP elicitation and pathogen inoculation.
a Gene expression analysis of pathogen responsive genes was measured by RT-qPCR in M82 and slnrc4a plants 24 h after petiole application of EIX. Relative expression normalized to control M82 (mock). Average ± SEM of three independent experiments is shown. No statistically significant differences were observed among WT and slnrc4a (t-test, welch correction). b Gene expression analysis of pathogen responsive genes was measured by RT-qPCR in M82 and slnrc4a samples 24 h after Bc inoculation. Relative expression normalized to M82 (mock). Average ± SEM of three independent experiments is shown. Asterisks represent statistical significance in t-test with welch correction comparing each gene (*p-value < 0.05; ***p-value < 0.001). Boxplots are shown with inter-quartile-ranges (box), medians (black line in box) and outer quartile whiskers, minimum to maximum values.
Fig. 5
Fig. 5. slnrc4a gain of function mutant line has similar yield production to WT.
Phenotypic parameters of yield were measured in M82 and slnrc4a plants. a Total fruit number is presented as number of tomato fruits produced by plant. b Total fruit weight per plant was measured. c, d Same as a, b, but ripe fruit only. e Total plant fresh weight (aerial tissues only). f Harvest index (HI) of plants was calculated as the ratio between the total fruit yield mass and total biomass. g Total soluble sugars were measured by refractometry expressed as °Brix. Average ± SEM of three independent replicates is shown. No statistically significant differences were observed among WT and slnrc4a (t-test, welch correction). Boxplots are shown with inter-quartile-ranges (box), medians (black line in box) and outer quartile whiskers, minimum to maximum values.
Fig. 6
Fig. 6. Comparison of the NRC4 clade 53Kb deletion and the gain of function slnrc4a mutant.
Defense responses elicited by the MAMP EIX and disease susceptibility to B. cinerea were compared between the gain of function slnrc4a mutant and the recently reported 53 Kb near-full NRC4 clade genomic deletion. a ROS production was measured every 5 min for 50 min in WT M82, slnrc4a, WT GW, and GW∆53Kb lines using the HRP-luminol method. Average ± SEM of five independent replicates is shown, N > 48 per genotype. Results were analyzed for statistical significance in a two-way ANOVA, (p < 0.0001). Inset: total ROS production presented in a. Average ± SEM of five independent replicates is shown, asterisks represent statistically significant differences in a one-way ANOVA (p < 0.0001) with a Bonferroni post hoc test (*p-value < 0.05; ***p-value < 0.001). b Ethylene production of WT M82, slnrc4a, WT GW and GW∆53Kb samples was measured using gas chromatography. M82 or GW-WT average ethylene production is defined as 1. Average ± SEM of three independent experiments is presented, N > 10 per genotype. Asterisks represent statistical significance in one-way ANOVA (p < 0.0001) with a Dunnett post hoc test (****p < 0.0001; *p < 0.05). c Lesion area was measured seven days after inoculation with B. cinerea (10X6 spores/mL). Average ± SEM of three experiments (N > 24 per genotype). Asterisks represent statistical significant in a one-way ANOVA with a Tukey post-hoc test, p < 0.0001. ***p < 0.001, ****p < 0.0001. Boxplots are shown with inter-quartile-ranges (box), medians (black line in box) and outer quartile whiskers, minimum to maximum values.
Fig. 7
Fig. 7. slnrc4a can reside in the membrane and does not require PRR activation.
a The complex structure of ZAR1 (PDB:6J5T) represented as a ribbon in which each distinct color represents a different protein chain. The square box marks the position of the derived peptide in the surface representation. b Left, the modeled 3D assembly of SlNRC4a1–67 peptide based on the ZAR1 structure, in surface representation colored by hydrophobicity. The predicted membrane insertion site is marked by the two gold lines. Right, a top view of the SlNRC4a1–67 peptide structure with the marked five α1 helices (α1,1-5). c Biochemical protein fractionation of SlNRC4a1–67‐mCherry transiently expressed in N. benthamiana. Cytosolic (Cyto) or Triton X‐100 soluble membrane (TSM) protein fractions were subjected to SDS‐PAGE followed by α-mCherry immunoblot. Cytosolic fraction of free-mCherry transiently expressed in N. benthamiana is shown. d M82 and slnrc4a tomato lines were grown in-vitro for 3-weeks, leaves were inoculated with B. cinerea (10X6 spores/mL) and lesion area was measured after 3 days. Individual values are all presented line indicates mean. e Ethylene induction after EIX elicitation in M82 and slnrc4a samples was measured using gas chromatography. M82 average ethylene production after elicitation is defined as 1, average ± SEM is presented (NM82 = 17 and Nslnrc4a = 29). Asterisks represent statistical significance in t-test with welch correction (**p-value < 0.01). f M82 and slnrc4a tomato lines were grown in-vitro for 3-weeks and PR1b expression was measured by RT-qPCR in steady state conditions. Relative expression normalized to M82 (mock). For d, f 4–8 individuals were analyzed, average ± SEM is shown. Statistical significance in t-test with welch correction (***p-value < 0.001). e, f Boxplots are shown with inter-quartile-ranges (box), medians (black line in box) and outer quartile whiskers, minimum to maximum values.
Fig. 8
Fig. 8. Representative model of MAMP-elicitation and disease response.
a Plants deploy defense responses after MAMP-elicitation (blue), which can be enhanced by priming, triggering a stronger and/or faster response (red). We propose that in slnrc4, plant defense responses are pre-activated, and this leads to stronger responses to MAMP-elicitation (green). b Plant disease progression in natural conditions (blue), can be retarded when plants are pre-treated with priming agents (red). We propose that in slnrc4, disease progression is lower due its pre-activated basal condition, in a manner which may be superior to primed plants (green).

References

    1. Kachroo A, Vincelli P, Kachroo P. Signaling mechanisms underlying resistance responses: what have we learned, and how is it being applied? Phytopathology. 2017;107:1452–1461. - PubMed
    1. Boutrot F, Zipfel C. Function, discovery, and exploitation of plant pattern recognition receptors for broad-spectrum disease resistance. Annu. Rev. Phytopathol. 2017;55:257–286. - PubMed
    1. Bigeard J, Colcombet J, Hirt H. Signaling mechanisms in pattern-triggered immunity (PTI) Mol. Plant. 2015;8:521–539. - PubMed
    1. Couto D, Zipfel C. Regulation of pattern recognition receptor signalling in plants. Nat. Rev. Immunol. 2016;16:537–552. - PubMed
    1. Win J, et al. Effector biology of plant-associated organisms: concepts and perspectives. Cold Spring Harb. Symp. Quant. Biol. 2012;77:235–247. - PubMed

Publication types

MeSH terms