. 2020 Jul 30;11(1):3793.
doi: 10.1038/s41467-020-17641-3.

Strategies to enable large-scale proteomics for reproducible research

Affiliations

Strategies to enable large-scale proteomics for reproducible research

Rebecca C Poulos et al. Nat Commun. .

Abstract

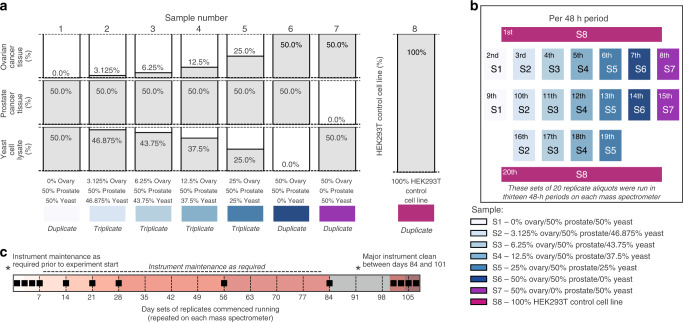
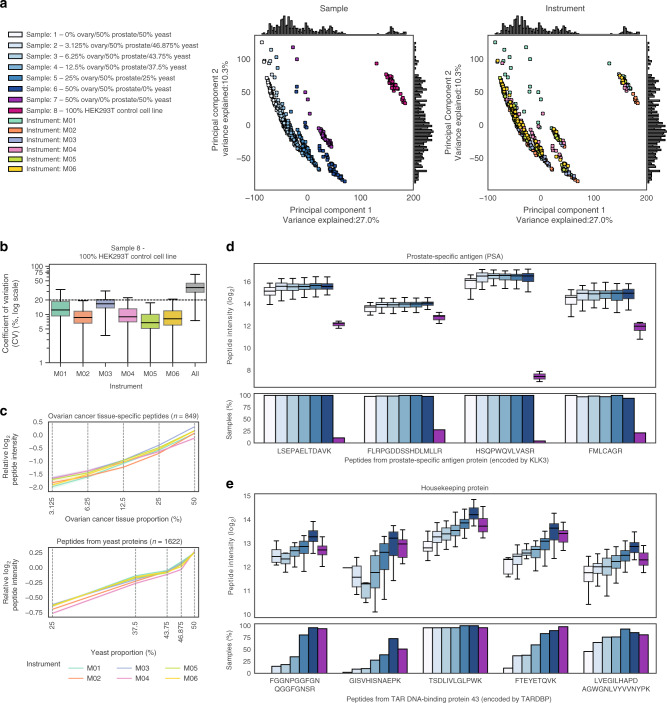
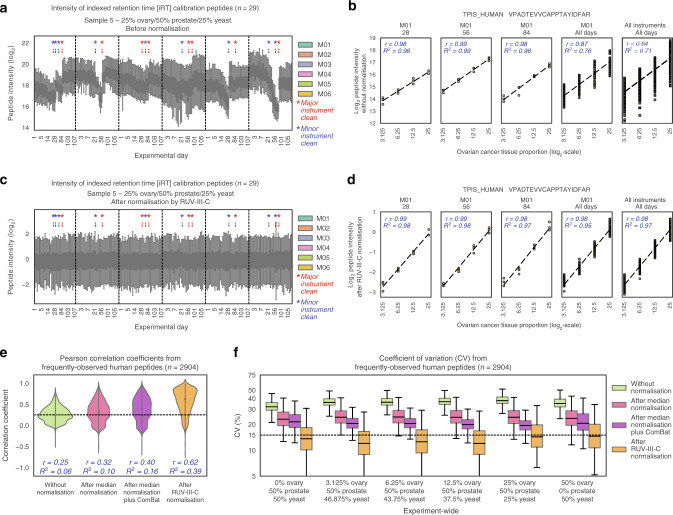
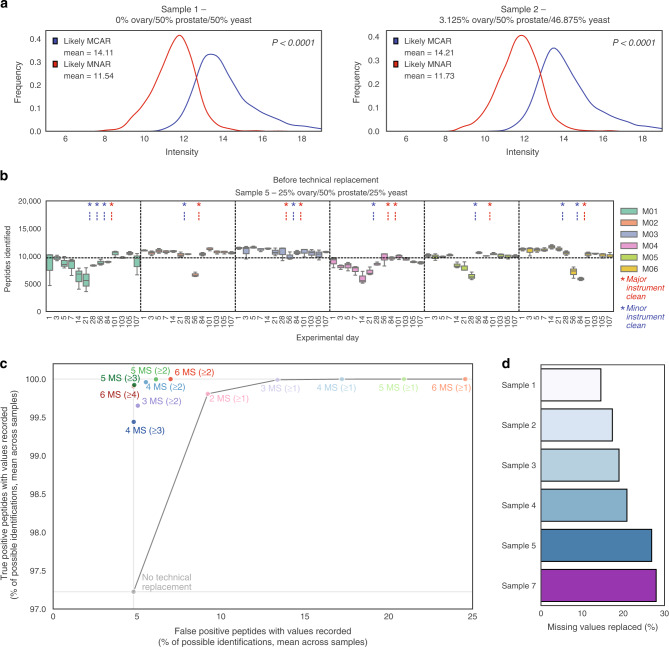
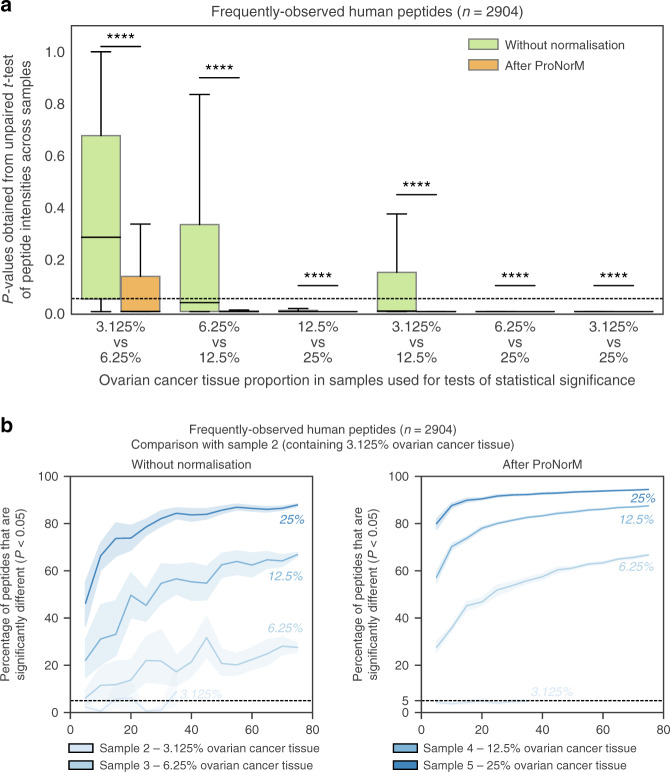
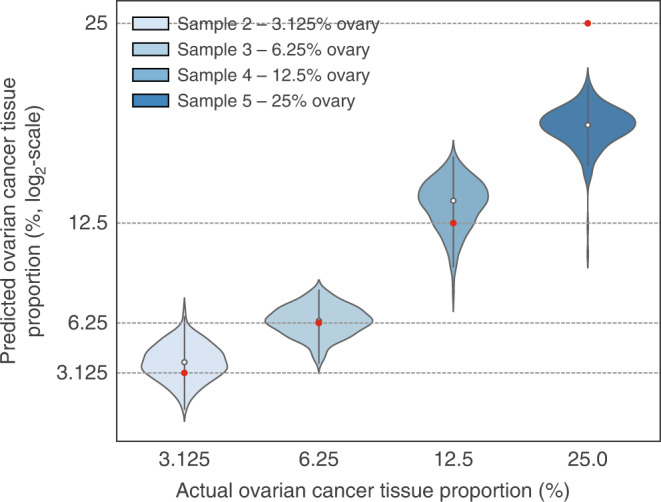
Reproducible research is the bedrock of experimental science. To enable the deployment of large-scale proteomics, we assess the reproducibility of mass spectrometry (MS) over time and across instruments and develop computational methods for improving quantitative accuracy. We perform 1560 data independent acquisition (DIA)-MS runs of eight samples containing known proportions of ovarian and prostate cancer tissue and yeast, or control HEK293T cells. Replicates are run on six mass spectrometers operating continuously with varying maintenance schedules over four months, interspersed with ~5000 other runs. We utilise negative controls and replicates to remove unwanted variation and enhance biological signal, outperforming existing methods. We also design a method for reducing missing values. Integrating these computational modules into a pipeline (ProNorM), we mitigate variation among instruments over time and accurately predict tissue proportions. We demonstrate how to improve the quantitative analysis of large-scale DIA-MS data, providing a pathway toward clinical proteomics.


Conflict of interest statement

K.A. is an employee of SCIEX, which operates in the field covered by the article. R.A. holds shares of Biognosys AG which operates in the field covered by the article. The remaining authors declare no competing interests.

Figures

Fig. 1
Fig. 1. Study design.
a Composition of the eight samples analysed repeatedly throughout the study. b Twenty mass spectrometry runs during thirteen 48-h periods on each of six instruments. Each run is represented by a coloured panel corresponding to each of the eight samples (labelled S1–S8), with the run order indicated in the upper left corner. Four samples were run in duplicate and four in triplicate during each 48-h period. c Mass spectrometer scheduling. Days on which 48-h periods of data collection commenced are indicated with a black bar, and the intended instrument cleaning schedule is also indicated.
Fig. 2
Fig. 2. Baseline DIA-MS data reproducibility.
Data shown in all plots were acquired during the experimental week after instrument cleaning (days 101, 103, 105 and 107) and were not normalised. a Principal component analysis of log2-transformed experimental data, with data points coloured by sample (left) and instrument (right). Missing values were filled with zeros. b Coefficient of variation (CV) per instrument in the HEK293T control cell line (Sample 8). CV was calculated using frequently observed peptides (n = 2950 peptides). A black dashed line marks a CV of 20% for reference. c Relative log2-transformed intensities per sample of ovarian cancer-tissue specific peptides (upper) and peptides from yeast proteins (lower), coloured by instrument. The mean peptide intensity from each sample was adjusted so that relative intensities are comparable, by dividing each value by the overall mean peptide intensity measured on a given instrument during the period. Ovarian cancer tissue and yeast proportions are plotted on the log2-scale. d, e Intensities of all peptides identified from d the prostate-specific antigen (PSA) protein encoded by KLK3 and e the housekeeping protein encoded by TARDBP. Boxplots show peptide intensity, with bar plots indicating the proportion of replicate samples in which each peptide was observed. Plots are coloured according to sample, using colour-codes as shown in a. For replicate numbers n, refer to Supplementary Data 2. In b, d and e, the box indicates quartiles and the whiskers indicate the rest of the distribution, with outliers not shown. Source data are provided as a Source data file.
Fig. 3
Fig. 3. Peptide intensity variation during the experimental period and normalisation approaches.
a, c Intensities of indexed retention time calibration peptides (n = 29) in replicate runs of Sample 5 (containing 25% ovarian cancer tissue/50% prostate cancer tissue/25% yeast), a before normalisation and c after RUV-III-C normalisation. Boxplots are coloured by instrument, within which data are ordered from earliest experimental day (left) to latest experimental day (right). Maintenance schedules of major (red) and minor (blue) instrument cleaning are indicated. Only every sixth experimental day is labelled on the horizontal axis. b, d Intensity of a single human peptide b before normalisation and d after RUV-III-C normalisation. Pearson correlation (r) and R2 are shown in italicised blue text, and the black dashed line indicates the predicted association from a linear regression model. e Correlation coefficients from Pearson correlation of each frequently observed human peptide (n = 2904) with ovarian cancer tissue proportions. Median Pearson correlation (r) and R2 from each distribution are shown in italicised blue text. A black dashed line indicates the median correlation coefficient before normalisation. Correlations were calculated using log2-transformed peptide intensities and ovarian cancer tissue proportions. f Coefficient of variation (CV) of frequently observed human peptide intensities, calculated for each sample during the experimental period across all instruments. A black dashed line marks a CV of 15% for reference. In a, c and f, the box indicates quartiles and the whiskers indicate the rest of the distribution, with outliers not shown. Source data are provided as a Source data file.
Fig. 4
Fig. 4. Missing values and results from technical replacement.
a Distribution of median non-missing intensity of each peptide designated as likely missing completely at random (MCAR) and missing not at random (MNAR) in Samples 1 and 2. P-value determined by two-sided unpaired t-test. b Peptides identified in each replicate per experimental day in replicate runs of Sample 5 (containing 25% ovarian cancer tissue/50% prostate cancer tissue/25% yeast). Boxplots are coloured by instrument, within which data are ordered from earliest experimental day (left) to latest experimental day (right). Maintenance schedules of major (red) and minor (blue) instrument cleaning are indicated by asterisks. The box indicates quartiles and the whiskers indicate the rest of the distribution, with outliers not shown. A horizontal dashed line indicates the mean number of identifications across the experimental period. For replicate numbers n, refer to Supplementary Data 2. c Mean percentage of possible true and false positive peptide identifications across samples after each method of technical replacement. Each method is denoted by first indicating the number of instruments (MS) and then the number of replicates in which a peptide must have been observed for technical replacement to occur (bracketed). d Proportion of missing values replaced in each sample after technical replacement. Data are shown for triplicates, with missing values replaced when a peptide was observed in two of three replicates, i.e., 3 MS (≥2 MS). Source data are provided as a Source data file.
Fig. 5
Fig. 5. Simulation of cohort analyses for discovery proteomics.
a Distribution of p-values obtained from unpaired two-sided t-test of intensities of frequently observed human peptides (n = 2904). Boxplots show p-values obtained when comparing samples containing the ovarian cancer tissue proportions indicated (ranging from 3.125% to 25%). Results are shown before normalisation (green) and after ProNorM (orange). The box indicates quartiles and the whiskers indicate the rest of the distribution, with outliers not shown. A black dashed line indicates a p-value of 0.05 and **** denotes P < 0.0001. b Percentage of frequently observed human peptides that were significantly different (vertical axis) in simulated cohorts of varying sizes (horizontal axis). Plots show comparison between Sample 2 (containing 3.125% ovarian cancer tissue) and Samples 2–5 (containing 3.125–25% ovarian cancer tissue), without normalisation (left) and after ProNorM (right). Shading denotes 95% confidence intervals derived from ten iterations of random selections of replicates of each sample. For statistical tests in both (a, b), the mean of each peptide was first calculated within each set of assigned technical triplicates. Source data are provided as a Source data file.
Fig. 6
Fig. 6. Proportion of ovarian cancer tissue predicted by a multilayer perceptron regressor.
Violin plots indicate the ovarian cancer tissue proportions predicted by a multilayer perceptron regressor model. The expected ovarian cancer tissue proportion for each sample is marked by a red data point. Source data are provided as a Source Data file.

References

    1. Harbeck N, Gnant M. Breast cancer. Lancet. 2017;389:1134–1150. - PubMed
    1. Ludwig C, et al. Data-independent acquisition-based SWATH-MS for quantitative proteomics: a tutorial. Mol. Syst. Biol. 2018;14:e8126. - PMC - PubMed
    1. Aebersold R, Mann M. Mass-spectrometric exploration of proteome structure and function. Nature. 2016;537:347–355. - PubMed
    1. Tully, B. et al. Addressing the challenges of high-throughput cancer tissue proteomics for clinical application: ProCan®. Proteomics. 10.1002/pmic.201900109 (2019) - PubMed
    1. Zhang B, et al. Proteogenomic characterization of human colon and rectal cancer. Nature. 2014;513:382–387. - PMC - PubMed

Publication types

LinkOut - more resources