. 2021 Jan;14(1):242-252.
doi: 10.1038/s41385-020-0330-6. Epub 2020 Jul 30.

Microbiota-dependent expansion of testicular IL-17-producing Vγ6+ γδ T cells upon puberty promotes local tissue immune surveillance

Affiliations

Microbiota-dependent expansion of testicular IL-17-producing Vγ6+ γδ T cells upon puberty promotes local tissue immune surveillance

Anneke Wilharm et al. Mucosal Immunol. 2021 Jan.

Erratum in

Abstract

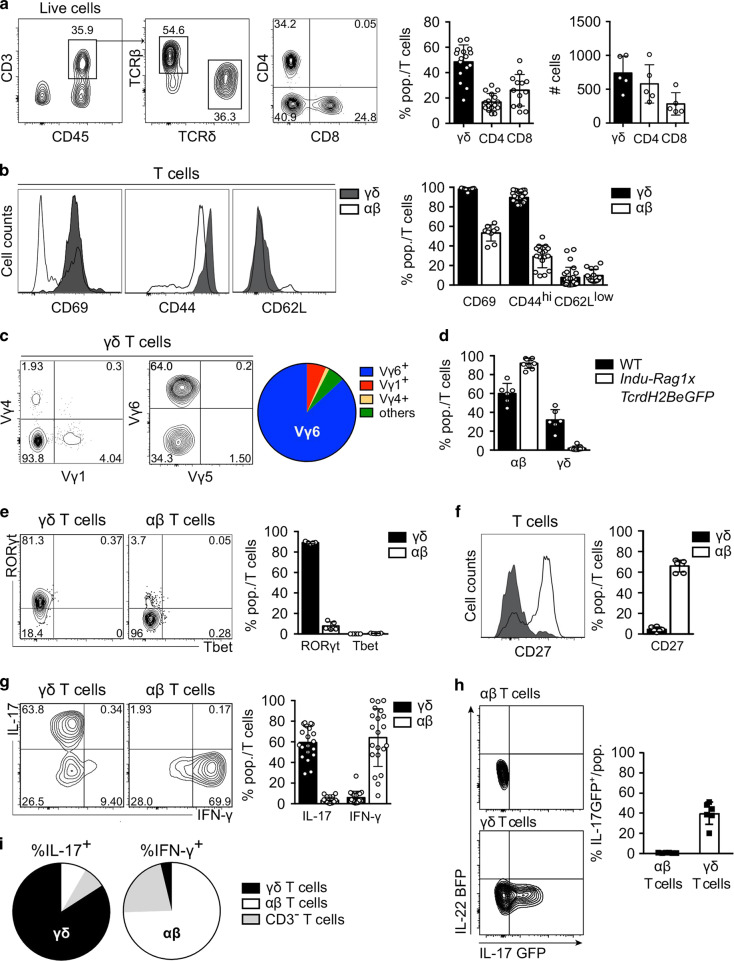
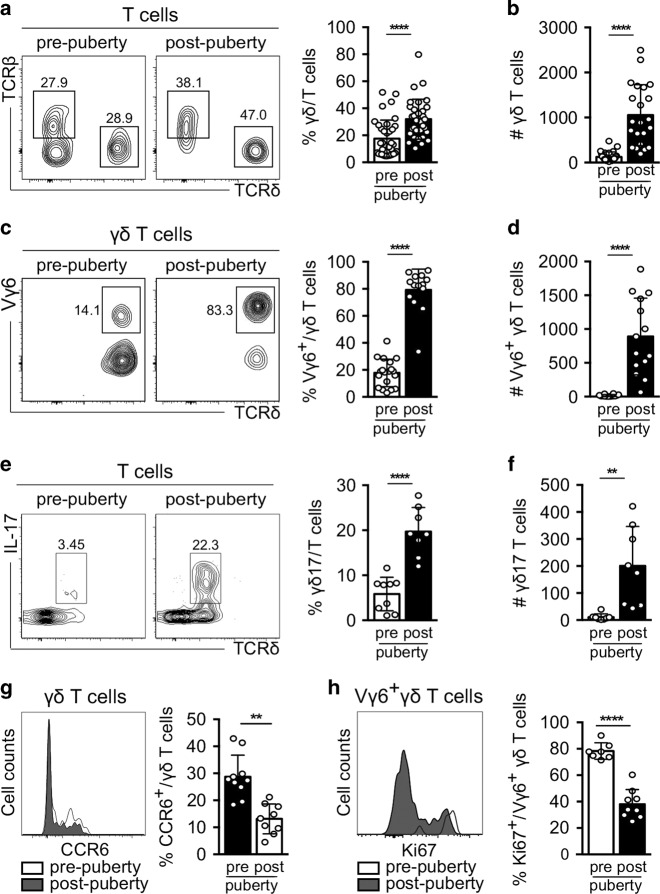
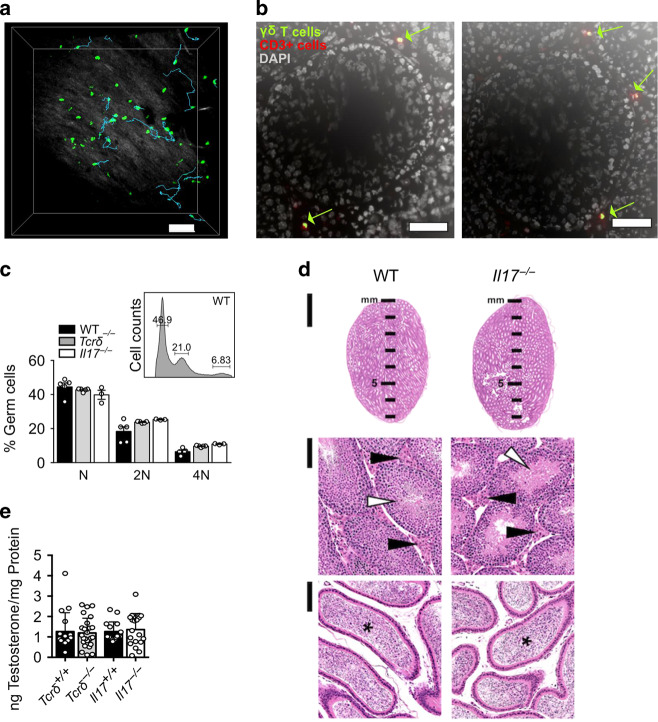
γδT cells represent the majority of lymphocytes in several mucosal tissues where they contribute to tissue homoeostasis, microbial defence and wound repair. Here we characterise a population of interleukin (IL) 17-producing γδ (γδ17) T cells that seed the testis of naive C57BL/6 mice, expand at puberty and persist throughout adulthood. We show that this population is foetal-derived and displays a T-cell receptor (TCR) repertoire highly biased towards Vγ6-containing rearrangements. These γδ17 cells were the major source of IL-17 in the testis, whereas αβ T cells mostly provided interferon (IFN)-γ in situ. Importantly, testicular γδ17 cell homoeostasis was strongly dependent on the microbiota and Toll-like receptor (TLR4)/IL-1α/IL-23 signalling. We further found that γδ17 cells contributed to tissue surveillance in a model of experimental orchitis induced by intra-testicular inoculation of Listeria monocytogenes, as Tcrδ-/- and Il17-/- infected mice displayed higher bacterial loads than wild-type (WT) controls and died 3 days after infection. Altogether, this study identified a previously unappreciated foetal-derived γδ17 cell subset that infiltrates the testis at steady state, expands upon puberty and plays a crucial role in local tissue immune surveillance.


Conflict of interest statement

The authors declare no competing interests.

Figures

Fig. 1
Fig. 1. Testicular γδ T cells display a typical phenotype biased for IL-17 production.
a Representative contour plots depicting γδ (middle) and CD4 and CD8 αβ (right) T cells gated on CD3+CD45+ cells (left) in testes of C57BL/6 mice (8–12 weeks old). Scatter plot shows frequencies and absolute numbers of γδ, CD4 and CD8 T cells among CD45+CD3+ cells (n = 5–16, two to five independent experiments). b Representative histogram of CD69, CD44 and CD62L expression of γδ (dark grey) and αβ (white) T cells. Scatter plot displays frequencies of indicated cell populations among γδ (black) and αβ (white) T cells (n = 8–17, two to five independent experiments). c Representative contour plot and pie chart depicting mean frequencies of Vγ1 + , Vγ4+, Vγ5+ and Vγ6+ γδ T cells in testes (n = 6–12, three independent experiments). d Scatter plot shows frequencies of αβ and γδ T cells in testes of WT (black) and Indu-Rag1×TcrdH2BeGFP (white) mice (n = 5–9, three independent experiments). e Representative contour plot and scatter plot of RORγt and T-bet expression in testicular γδ (left, black) and αβ (right, white) T cells (n = 5, one independent experiment). f Representative histogram of CD27 expression on γδ (grey) and αβ (white) T cells. Scatter plot with frequencies of CD27+ cells among γδ (black) and αβ (white) T cells (n = 6, two independent experiments). g Representative contour plot and scatter plot of IL-17 versus IFN-γ expression in testicular γδ (left, black) and αβ (right, white) T cells (n = 20–21, five independent experiments) after ex vivo stimulation of testicular lymphocytes with PMA and ionomycin. h Representative contour plot and scatter plot of IL-17 versus IL-22 expression in IL-17GFP/IL-22-BFP reporter mice, without prior stimulation by PMA and ionomycin (n = 3–6). i Pie chart depicting indicated immune cell subsets contributing to IL-17 (left) or IFN-γ (right) production in the testis after ex vivo stimulation by PMA and ionomycin (n = 12, three independent experiments). Data are represented as mean ± SD.
Fig. 2
Fig. 2. Vγ6+ IL-17+ γδ T cells accumulate specifically in the testis during puberty.
a Representative contour plots depicting testicular γδ and αβ T cells gated on CD3+CD45+ cells before puberty (3–5-week-old (wo) mice) and post puberty (7–12-week-old mice). Scatter plot shows frequencies of γδ T cells among CD3+CD45+ cells in pre-pubertal (white) and post-pubertal (black) mice (n = 32–36, seven independent experiments). b Number (#) of γδ T cells in pre- (white) and post-pubertal (black) mice (n = 22–27, five independent experiments). c Representative contour plots depicting Vγ6+ γδ T cells before and after puberty. Scatter plot shows frequencies of Vγ6+ γδ T cells among lymphocytes in pre-pubertal (white) and post-pubertal (black) mice (n = 14–19, three independent experiments). d Number of Vγ6+ γδ T cells in pre- (white) and post-pubertal (black) mice (n = 14, three independent experiments). e Representative contour plots depicting IL-17-producing γδ T (γδ17) cells before and after puberty. Scatter plot shows frequencies of γδ17 cells in pre-pubertal (white) and post-pubertal (black) mice (n = 8–9, two independent experiments). f Number of γδ17 cells in pre- (white) and post-pubertal (black) mice (n = 8, two independent experiments). g Representative histogram of CCR6 expression of γδ in pre- (white) and post-pubertal (dark grey) mice. Scatter plot shows frequencies of CCR6+ γδ in pre-pubertal (white) and post-pubertal (black) mice (n = 8–9, two independent experiments). h Representative histogram of Ki67 expression of Vγ6+ γδ T cells in pre- (white) and post-pubertal (dark grey) mice (n = 7–9, three independent experiments). Data are represented as mean ± SD as evaluated by unpaired Student’s t test, **P < 0.01, ***P < 0.001, ****P < 0.0001.
Fig. 3
Fig. 3. Accumulation of γδ T cells in the testis is dependent on microbiota, IL-23 and TLR4 signalling.
a Representative contour plots depicting IL-17-producing γδ T cells gated on CD3+CD45+ cells in testes of specific pathogen-free (SPF) (left) and germ-free (GF) (right) mice. Scatter plot shows frequencies of γδ and γδ17 T cells among lymphocytes in testes of SPF (black) and GF (white) mice (n = 18–22, five independent experiments). b Number of testicular γδ and γδ17 cells of SPF (black) and GF (white) mice (n = 11–12, three independent experiments). c Representative contour plots depicting testicular Vγ6+ γδ T cells gated on CD3+CD45+ cells of SPF and GF mice. Scatter plot displays frequencies of Vγ6+ γδ T cells among all T cells in testes of SPF (black) and GF (white) mice (n = 11–14, four independent experiments). d Number of Vγ6+ γδ T cells from SPF and GF in pre- and post-pubertal mice (n = 6, two independent experiments) (n = 7–8, three independent experiments). e Scatter plot shows frequencies of γδ17 T cells among lymphocytes of WT (black), Tlr2−/−, Tlr4−/− and Myd88−/− (white) mice (n = 4–9, one to two independent experiments). f Representative histogram of γδ (dark grey) and αβ (white) T cells expressing IL-1 receptor (R) in WT mice (left) and IL-23R in Il23rgfp/gfp mice (right) and scatter plot with mean fluorescence intensity (MFI) (n = 5–10, one to three independent experiments). g Scatter plot depicts frequencies of γδ17 among all T cells in testes of WT (black), Il1r−/−, Il23r−/−, Il1α−/− and Il1β/− (white) (n = 5–29, one to three independent experiments). h Scatter plot displays picogram (pg) per mg protein of IL-1α, IL-1β and IL-23 in the testis (n = 9, two independent experiments). Data are represented as mean ± SD as evaluated by Kruskal–Wallis test followed by Dunn’s multiple-comparison test or one-way ANOVA followed by Holm–Sidak’s multiple-comparison test. **P < 0.01, ***P < 0.001, ****P < 0.0001.
Fig. 4
Fig. 4. γδ T cells do not impact on testicular steady-state physiology.
a Two-photon microscopy of the testis of adult TcrdH2BeGFP mice demonstrating γδ T cells (green) and collagen structures (white–grey). Using IMARIS software, motile γδ T cells were tracked (cyan lines). Scale bar represents 70 μM (n = 6 movies). b Representative immunofluorescence staining of cross sections from the testis of adult TcrdH2BeGFP mice against CD3 (red) and DAPI (white) for nuclear visualisation. Scale bars represent 50 μM (n = 4). c Representative histogram of germ cells in a WT mouse. Plot shows frequencies of germ cells of WT, Tcrδ−/− and Il17−/− mice (n = 3–5, one to two independent experiments). d Representative microphotographs of the testis of WT and Il17/− mice. Organs are alike in aspect, proportion and volume, with similar contribution of seminiferous tubules (white arrowhead), Leydig cells in the stromal compartment (black arrowhead) and with numerous spermatozoa in the lumen of the epididymis (asterisk). Haematoxylin and eosin staining. Original magnification ×1.25 (top column, bar, 2 mm) and ×20 (middle and lower columns, bar, 100 µm) (n = 3). e Scatter plot displays ng of testosterone/mg of protein in Tcrδ/− and Il17−/ mice compared with the respective littermate controls (n = 16–25, four independent experiments). Data represented as mean ± SD.
Fig. 5
Fig. 5. Testicular γδ17 promotes testis surveillance against Listeria monocytogenes.
a, b Scatter plots show frequencies and numbers of γδ and αβ T cells among CD3+CD45+ cells after intra-testicular infection with L. monocytogenes (L. mon) (2 × 103 CFU) (white) or PBS (black) in mature testis (n = 10–13, three independent experiments) (a) and spleen (n = 5–8, two independent experiments) (b). c Representative contour plots depicting IL-17+ or IFN-γ+ γδ (left) and αβ (right) T cells 3 days after intra-testicular injection of PBS (top) or L. monocytogenes (bottom). Scatter plots show frequencies of IFN-γ+ (white) and IL-17+ (black) γδ (top) and αβ (bottom) T cells (n = 10–13, three independent experiments). d Pie charts displaying the Vγ1+, Vγ4+ and Vγ1Vγ4 usage of IL-17+ γδ (top) and IFN-γ+ (bottom) γδ T cells 3 days after intra-testicular injection of L. mon (n = 8, two independent experiments). e Scatter plots show numbers of IFN-γ+ CD4 (left), CD8 (middle) and γδ (right) T cells in mature testis of WT (black), Tcrδ/− (grey) and Il17−/− (white) mice after intra-testicular infection with L. monocytogenes (2 × 103 CFU) or PBS (n = 8–19, three independent experiments). f Survival curve of WT (white), Ifnγ−/− (red), Il17−/ (white) and Tcrδ/− (grey) mice after intra-testicular injection of L. monocytogenes (2 × 103 CFU) (n = 6–7, three independent experiments). g Bacterial burden (CFU per testis) of WT (black), Tcrδ/− (grey) and Il17/− (white) mice analysed 72 h after intra-testicular injection of L. mon (2 × 103 CFU) (n = 11–12, three independent experiments). h Survival curve of WT (white), Il17−/− (black) and Tcrδ/− (grey) mice after intra-testicular injection of L. monocytogenes (4 × 103 CFU) (n = 5–7). Data pooled are represented as mean ± SD as evaluated by Kruskal–Wallis test followed by Dunn’s multiple-comparison test or one-way ANOVA followed by Holm–Sidak’s multiple-comparison test. *P < 0.05, **P < 0.01. i Bacterial burden (CFU per testis) of WT (black), Tcrδ–/– (grey) and Il17−/− (white) mice analysed 48 h after intra-testicular injection of L. monocytogenes (4 × 103 CFU) (n = 3–5 animals/group). When possible, Tcrδ+/+ and Il17+/+ littermate controls were used and referred as WT animals.

References

    1. Fijak M, Meinhardt A. The testis in immune privilege. Immunol. Rev. 2006;213:66–81. doi: 10.1111/j.1600-065X.2006.00438.x. - DOI - PubMed
    1. Tung KSK, et al. Egress of sperm autoantigen from seminiferous tubules maintains systemic tolerance. J. Clin. Invest. 2017;127:1046–1060. doi: 10.1172/JCI89927. - DOI - PMC - PubMed
    1. Wang M, et al. Characterization of the micro-environment of the testis that shapes the phenotype and function of testicular macrophages. J. Immunol. 2017;198:4327–4340. doi: 10.4049/jimmunol.1700162. - DOI - PubMed
    1. Hales DB. Testicular macrophage modulation of Leydig cell steroidogenesis. J. Reprod. Immunol. 2002;57:3–18. doi: 10.1016/S0165-0378(02)00020-7. - DOI - PubMed
    1. Redgrove, K. A. & McLaughlin, E. A. The role of the immune response in Chlamydia trachomatis infection of the male genital tract: a double-edged sword. Front. Immunol.5, 534 (2014). - PMC - PubMed

Publication types

MeSH terms