. 2020 Jul 7:14:673.
doi: 10.3389/fnins.2020.00673. eCollection 2020.

Ketogenic Diet Provided During Three Months Increases KCC2 Expression but Not NKCC1 in the Rat Dentate Gyrus

Affiliations

Ketogenic Diet Provided During Three Months Increases KCC2 Expression but Not NKCC1 in the Rat Dentate Gyrus

Leticia Granados-Rojas et al. Front Neurosci. .

Abstract

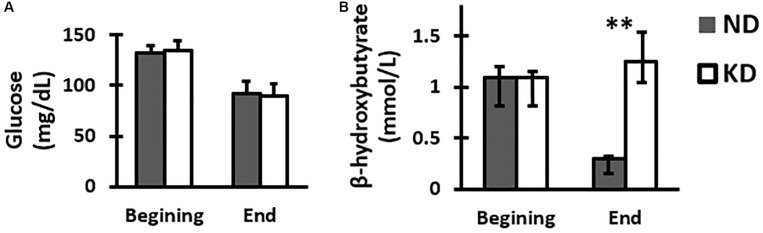
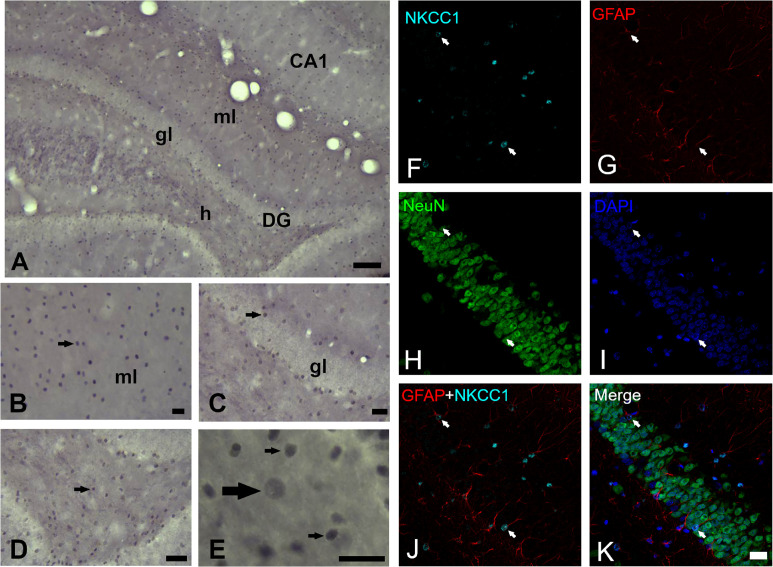
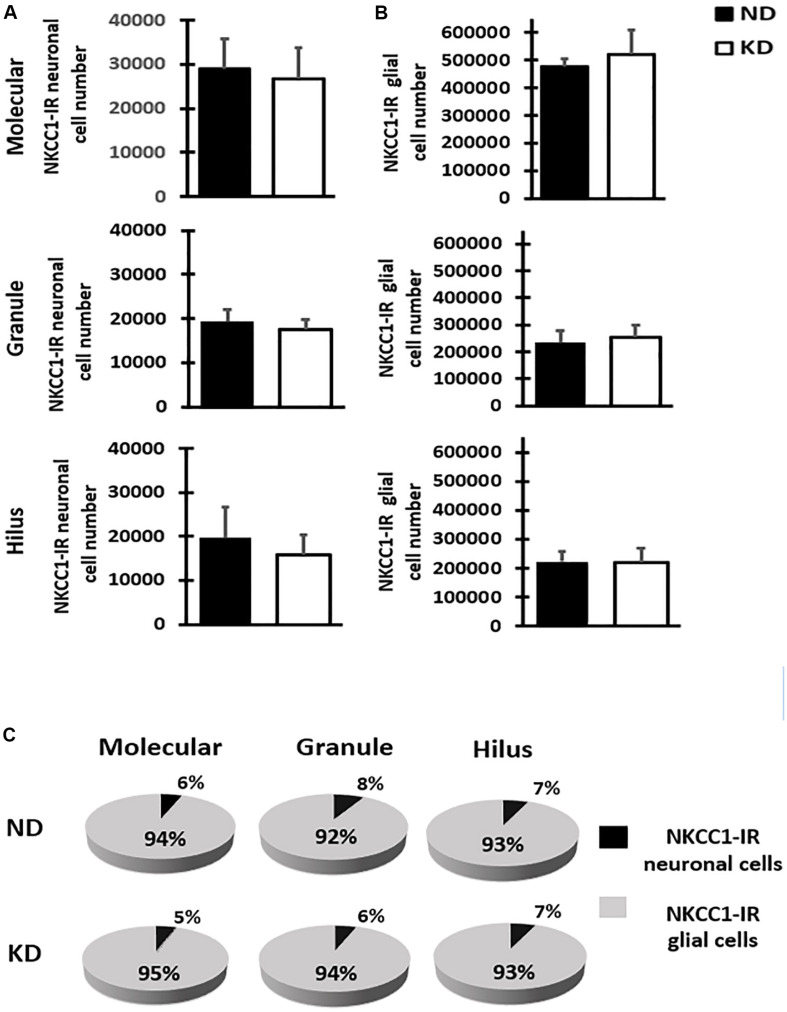
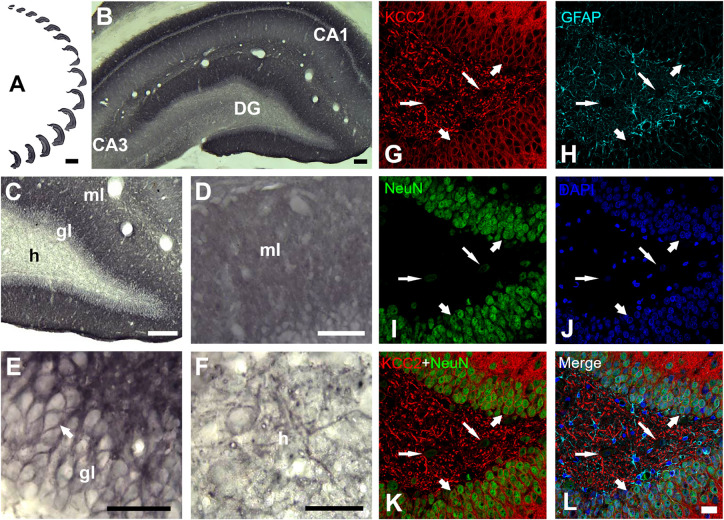
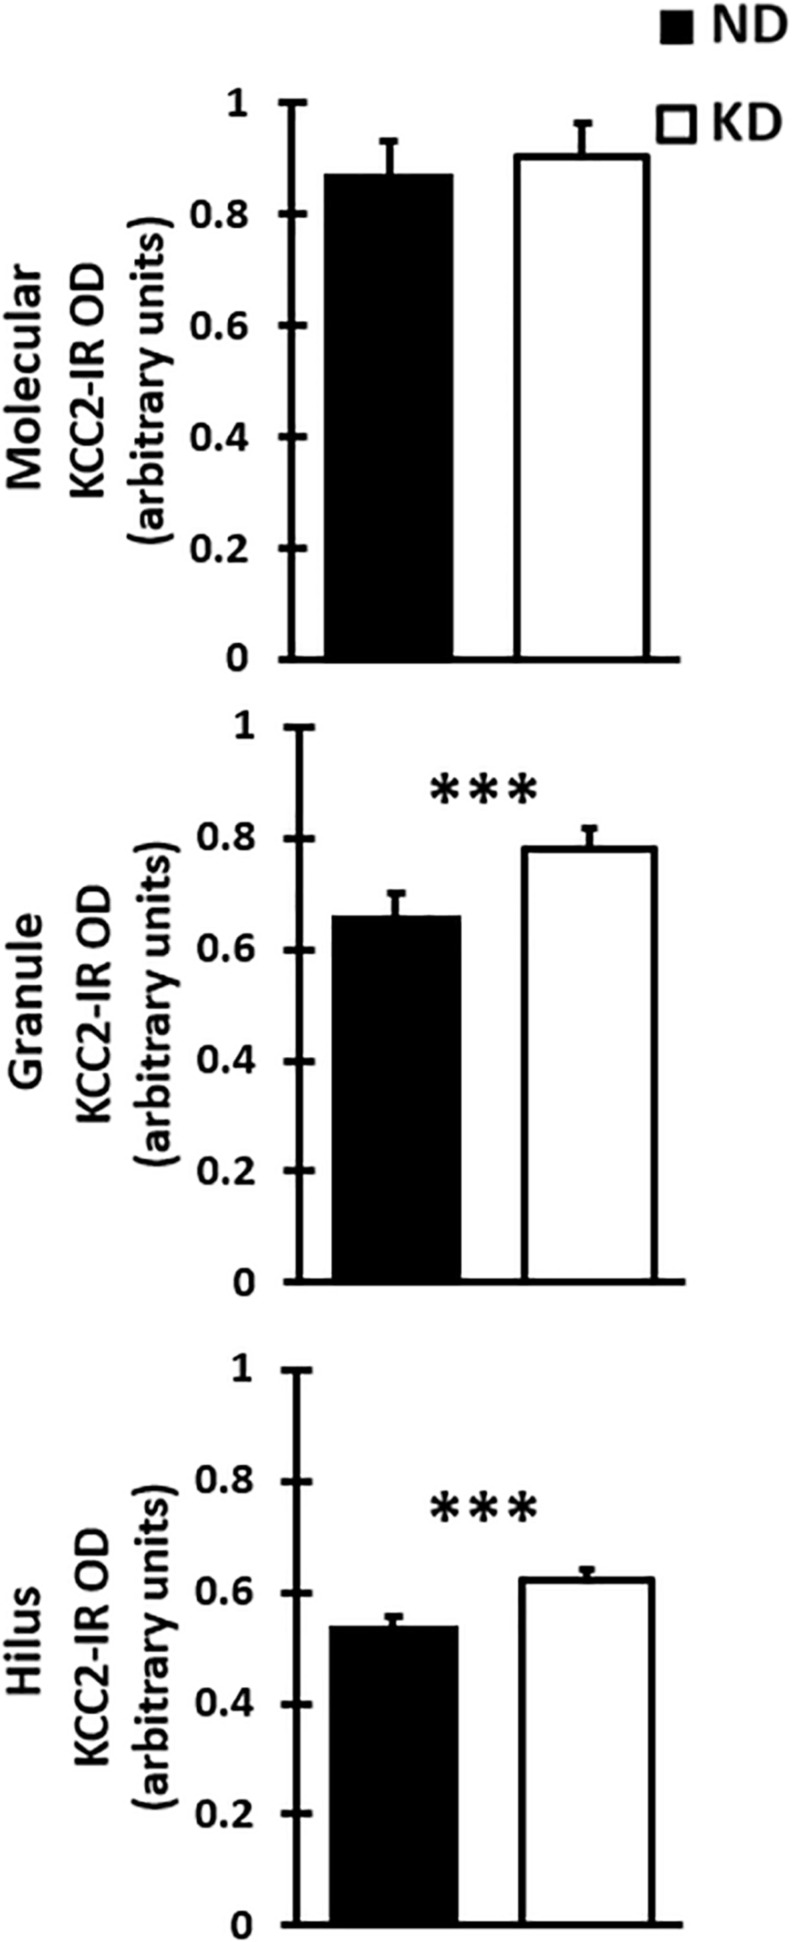
Ketogenic diet, a high fat and low carbohydrate diet, has been used as a non-pharmacological treatment in refractory epilepsy since 1920. In recent years, it has demonstrated to be effective in the treatment of numerous neurological and non-neurological diseases. Some neurological and neuropsychiatric disorders are known to be caused by gamma-aminobutyric acid (GABA)-mediated neurotransmission dysfunction. The strength and polarity of GABA-mediated neurotransmission are determined by the intracellular chloride concentration, which in turn is regulated by cation-chloride cotransporters NKCC1 and KCC2. Currently, it is unknown if the effect of ketogenic diet is due to the modulation of these cotransporters. Thus, we analyzed the effect of a ketogenic diet on the cation-chloride cotransporters expression in the dentate gyrus. We estimated the total number of NKCC1 immunoreactive (NKCC1-IR) neuronal and glial cells by stereology and determined KCC2 labeling intensity by densitometry in the molecular and granule layers as well as in the hilus of dentate gyrus of rats fed with normal or ketogenic diet for 3 months. The results indicated that ketogenic diet provided during 3 months increased KCC2 expression, but not NKCC1 in the dentate gyrus of the rat. The significant increase of KCC2 expression could explain, at least in part, the beneficial effect of ketogenic diet in the diseases where the GABAergic system is altered by increasing its inhibitory efficiency.

Keywords: KCC2; NKCC1; dentate gyrus; ketogenic diet; optical density; optical fractionator; rat.


Figures

FIGURE 1
FIGURE 1
Graph of the mean and SD of glucose (A) and median with IQR of β-hydroxybutyrate (B) concentrations in peripheral blood of group feed with normal diet (ND) or ketogenic diet (KD) at the beginning and end of treatment, n = 8 in each group. There were no significant differences between the two groups at beginning and end in the glucose levels. However, there was a significant increase in the β-hydroxybutyrate KD group when compared with ND group at the end of treatment (p < 0.01, Mann-Whitney U-test).
FIGURE 2
FIGURE 2
NKCC1 expression in dentate gyrus of rats fed with a normal diet. (A) NKCC1-IR cells in the molecular (ml) and granule (gl) layer and hilus (h) of dentate gyrus (−3.3 mm posterior to Bregma). (B–E) NKCC1-IR cells (arrows) were found distributed through all dentate gyrus. (E) Higher magnification of hilus, NKCC1 immunostaining showed predominantly small, abundant and intensely stained cells, presumptive glial cells (thin arrows) and some scarce, large and weakly stained cells, presumptive neuronal cells (thick arrow). Quadruple immunofluorescence labeling of NKCC1 with NeuN (a neuron-specific marker), GFAP (a marker for astrocytes) and DAPI (a marker for nuclei) (F–K). NKCC1-IR cells were mainly astrocyte-type glial cells, abundant, small and intensely stained cells (arrows indicate on all panels, NKCC1 and GFAP immunopositive astrocytes, except in NeuN panel where arrows indicate their absence). Scale bar: 100 μm (A), 25 μm (B–D), 10 μm (E) and 20 μm (F–K).
FIGURE 3
FIGURE 3
Bar graphs show mean and SD of NKCC1-IR neuronal (A) and glial (B) cells number estimated by stereology in the three layers of dentate gyrus of rats fed with normal diet (ND) or ketogenic diet (KD), n = 8 in each group. The estimate of cell number showed that KD does not significantly change the NKCC1-IR neuronal or glial cell number when compared with ND rats in the molecular and granule layers, and hilus of the dentate gyrus. (C) Fractional composition of NKCC1-IR neuronal and glial cells in the three layers of dentate gyrus in control group (ND) and ketogenic group (KD). The data are presented as a percentage of total of NKCC1-IR neuronal and glial cells in each layer.
FIGURE 4
FIGURE 4
KCC2 expression in dentate gyrus of a rat fed with normal diet. (A) Serial sections of the whole dentate gyrus of the right hemisphere. (B) Panoramic and (C), higher magnification view of dentate gyrus, ml, molecular layer; gl, granule layer and h, hilus. Higher magnification of molecular layer (D), granule layer (E) and hilus (F). KCC2 immunoreactivity in the granule layer was observed in the plasmalemmal region of the granule cell body (perisomal) (E). In the hilus (F), KCC2 expression was observed around the polymorphic cells and in neural processes. (G–L), quadruple fluorescent labeling of KCC2 with NeuN (a neuron-specific marker), GFAP (a marker for astrocytes) and DAPI (a marker for nuclei) of a rat feed with normal diet. KCC2 immunoreactivity (thick arrows) was mainly observed in both cytoplasmic projections and plasmalemmal region of the granule cell body (perisomal), indicating that KCC2 is present in granular neurons (G–L). KCC2-IR was also observed in neural fibers and NeuN weakly – stained cells of the hilus, probably mossy cells or hilar interneurons (thin arrows). Scale bar: 1,000 μm (A), 100 μm (B), 50 μm (C), 25 μm (D–F), 20 μm (G–L).
FIGURE 5
FIGURE 5
Bar graph shows mean and SD of optical density (OD) of KCC2 expression in the three layer of the dentate gyrus of rats fed with normal diet (ND) or ketogenic diet (KD), n = 8 in each group. The KD does not significantly change the OD when compared with ND rats in the molecular layer. However, there was a significant increase in optical density of KD group when compared with DN group in the granule layer and hilus of dentate gyrus (∗∗p < 0.000, Student’s t-test).

References

    1. Ahn Y., Narous M., Tobias R., Rho J. M., Mychasiuk R. (2014). The ketogenic diet modifies social and metabolic alterations identified in the prenatal valproic acid model of autism spectrum disorder. Dev. Neurosci. 36 371–380. 10.1159/000362645 - DOI - PubMed
    1. Alkadhi K. A. (2019). Cellular and molecular differences between CA1 and the dentate gyrus of the hippocampus. Mol. Neurobiol. 56 6566–6580. 10.1007/s12035-019-1541-2 - DOI - PubMed
    1. Appelberg K. S., Hovda D. A., Prins M. L. (2009). The effects of a ketogenic diet on behavioral outcome after controlled cortical impact injury in the juvenile and adult rat. J. Neurotrauma 26 497–506. 10.1089/neu.2008.0664 - DOI - PMC - PubMed
    1. Ari C., Kovács Z., Juhasz G., Murdun C., Goldhagen C. R., Koutnik A. M., et al. (2016). Exogenous ketone supplements reduce anxiety-related behaviour in Sprague-Dawley and Wistar Albino Glaxo/Rijswijk rats. Front. Mol. Neurosci. 9:137. 10.3389/fnmol.2016.00137 - DOI - PMC - PubMed
    1. Arroyo J. P., Kahle K. T., Gamba G. (2013). The SLC12 family of electroneutral cation-coupled chloride cotransporters. Mol. Aspects Med. 34 288–298. 10.1016/j.mam.2012.05.002 - DOI - PubMed

LinkOut - more resources