. 2020 Jul 7:14:31.
doi: 10.3389/fnsys.2020.00031. eCollection 2020.

Experimental and Computational Study on Motor Control and Recovery After Stroke: Toward a Constructive Loop Between Experimental and Virtual Embodied Neuroscience

Affiliations

Experimental and Computational Study on Motor Control and Recovery After Stroke: Toward a Constructive Loop Between Experimental and Virtual Embodied Neuroscience

Anna Letizia Allegra Mascaro et al. Front Syst Neurosci. .

Abstract

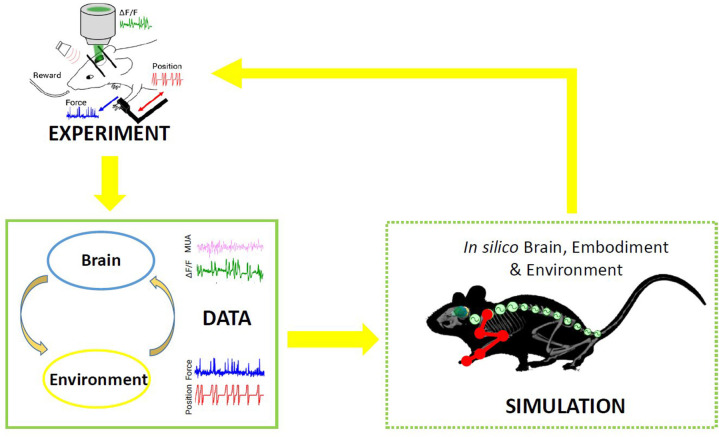
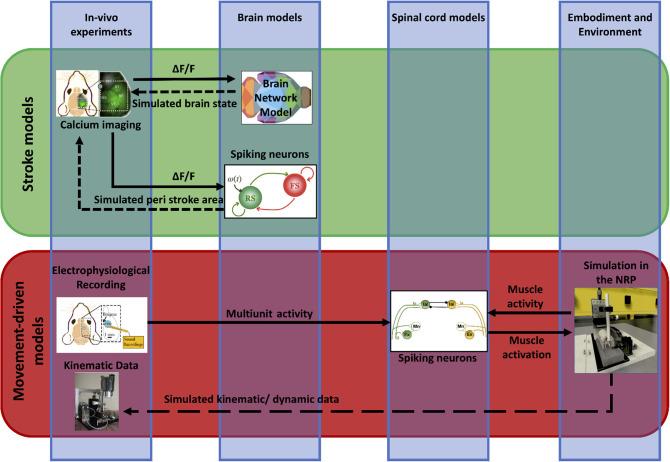
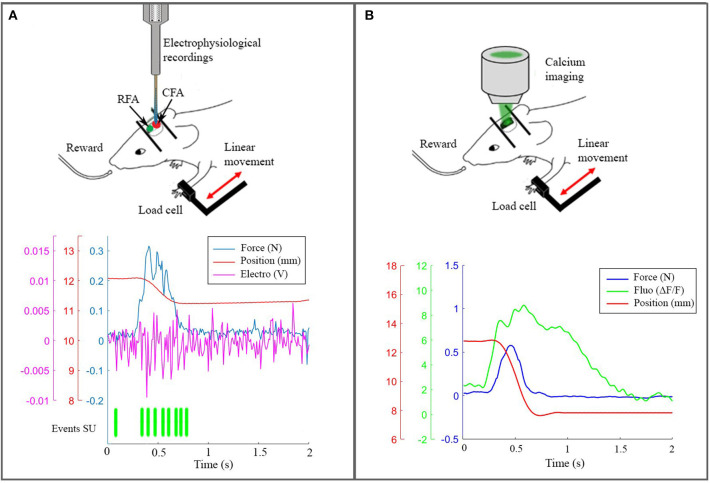
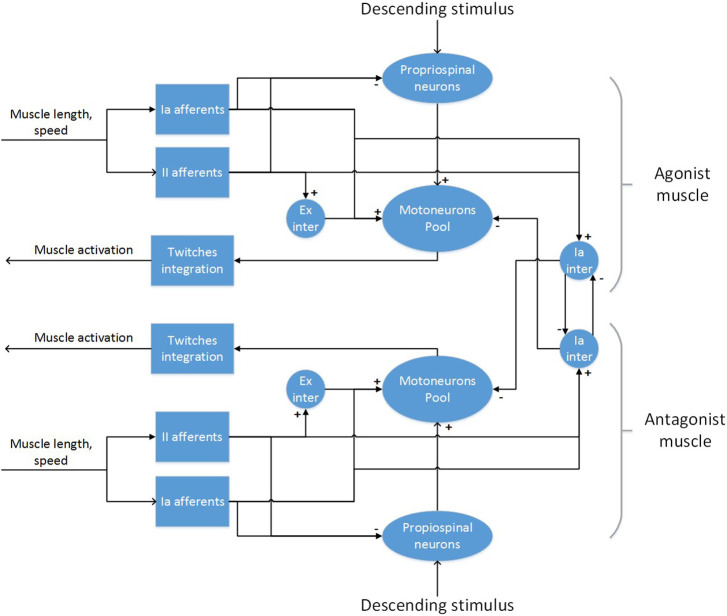
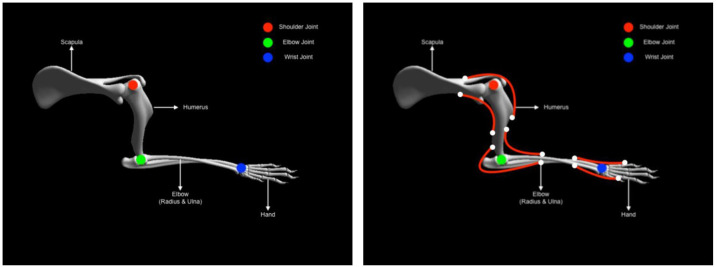
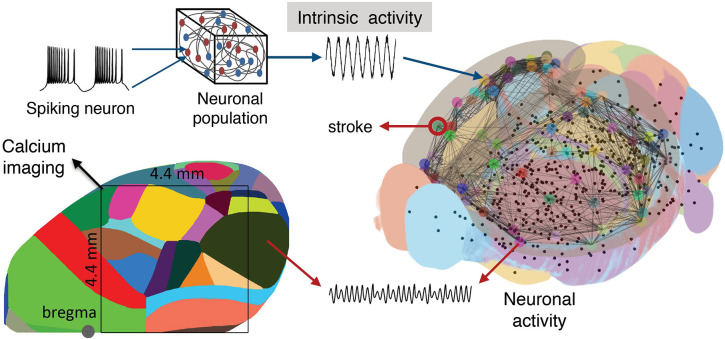
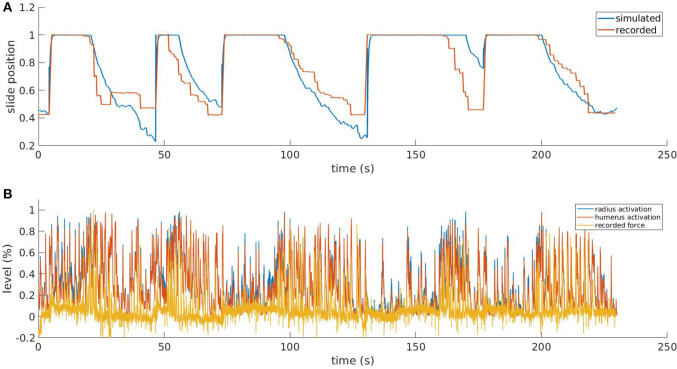
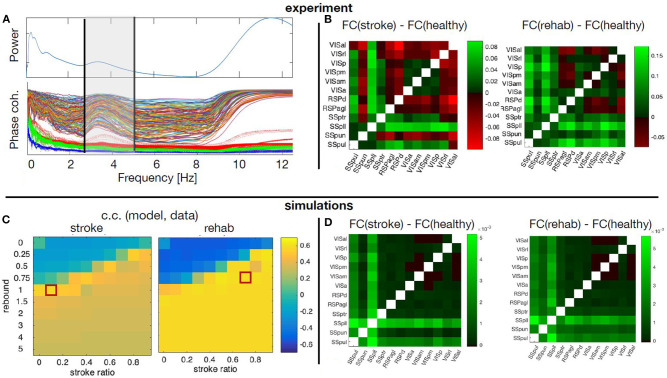
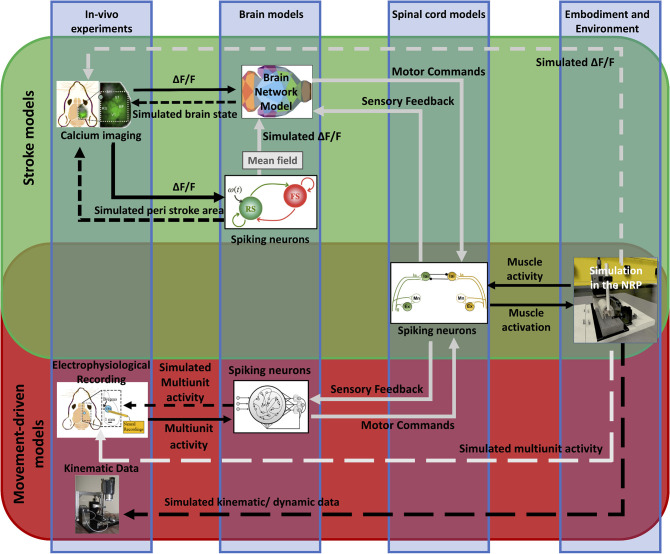
Being able to replicate real experiments with computational simulations is a unique opportunity to refine and validate models with experimental data and redesign the experiments based on simulations. However, since it is technically demanding to model all components of an experiment, traditional approaches to modeling reduce the experimental setups as much as possible. In this study, our goal is to replicate all the relevant features of an experiment on motor control and motor rehabilitation after stroke. To this aim, we propose an approach that allows continuous integration of new experimental data into a computational modeling framework. First, results show that we could reproduce experimental object displacement with high accuracy via the simulated embodiment in the virtual world by feeding a spinal cord model with experimental registration of the cortical activity. Second, by using computational models of multiple granularities, our preliminary results show the possibility of simulating several features of the brain after stroke, from the local alteration in neuronal activity to long-range connectivity remodeling. Finally, strategies are proposed to merge the two pipelines. We further suggest that additional models could be integrated into the framework thanks to the versatility of the proposed approach, thus allowing many researchers to achieve continuously improved experimental design.

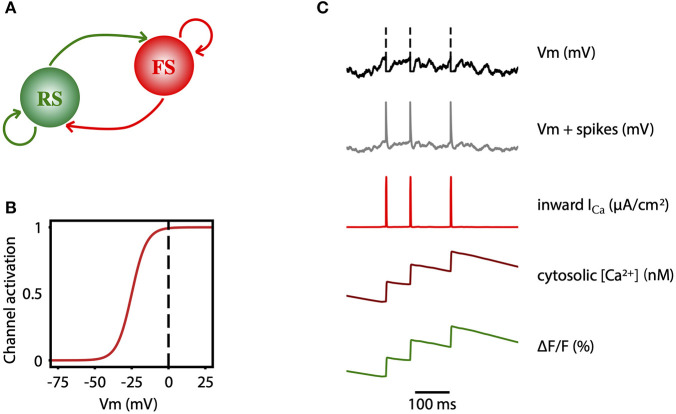
Keywords: Kuramoto oscillators; brain network models; closed-loop simulation; motor control; neural mass; rehabilitation; spiking neuronal networks; stroke.


Figures

Figure 1
Figure 1
Scheme of the proposed Embodied brain framework. The picture suggests a closed-loop workflow linking real and simulated experiment. The different types of data obtained from the experiments, from brain activity to dynamic and kinematics of goal-directed movement, are used to feed the whole brain and spinal cord model, in addition to the virtual mouse and environment. The loop is closed by validation of in silico results on real data. Eventually, the simulated experiment raises novel hypotheses, to be validated on new real experiments.
Figure 2
Figure 2
Scheme of data and simulations. The scheme depicts the approach to build the Embodied brain framework from data to models and back. The workflow from data to models and simulation in the Embodied brain closed loops is shown. The upper, green box shows the Stroke models closed loop, the lower, red box shows the Movement-driven models closed loop. Colored images represent experiment data, brain and spinal cord models, and simulation of the environment (from left to right). Connections between the modeling components are presented as arrows: solid lines represent the output provided to other blocks; dashed lines indicate the output data of the models that are used for comparison with real data for validation.
Figure 3
Figure 3
The real robotic platform. (A) On the top a schematic representation of the experiment during electrophysiological recording in CFA. At the bottom the synchronized data: force peak (blue), movement of the slide (red), high frequency electrophysiological signal of a single channel (magenta) and the timestamp of a selected single unit. (B) On the top a scheme of the experiment with the setup to record calcium activity. At the bottom the recorded data after synchronization: force peak (blue), movement of the slide (red) and calcium response (green).
Figure 4
Figure 4
The spinal cord model for a pair of antagonistic muscles.
Figure 5
Figure 5
Mouse forearm musculoskeletal system (left) Forelimb skeletal system with three joints (1) shoulder (Ball and socket) (2) elbow (hinge) (3) wrist (hinge). (right) Forelimb muscle system with six muscles (1) humerus-extension (2) humerus-flexion (1) elbow-extension (2) elbow-flexion (1) hand-extension (2) hand-flexion.
Figure 6
Figure 6
Scheme of the mouse BNM. Brain Network Model consisting of neural masses superimposed over the AMBA connectome simulates the recorded calcium activity. The average oscillatory neuronal activity of the brain regions is described by Kuramoto oscillators, which are coupled due to the fiber tracts, giving rise to the simulated recordings. The brain network (right) is reconstructed from the AMBA, with the centers of subcortical regions being small black dots, while larger the circles are for the cortical regions, with the region of the stroke highlighted. (Left) The field of view during the recordings is overlayed on the reconstructed brain, and different colors represent the cortical regions according to the AMBA.
Figure 7
Figure 7
Two-photon calcium signal model from a spiking network model. (A) Schematic connectivity between the excitatory population of regular spiking (RS) neurons and the inhibitory population of fast spiking (FS) neurons of the modeled cortical network. (B) Activation curve of a high-voltage activated calcium channel that is used to compute the inward calcium current (ICa) from the changes in the Vm. (C) From top to bottom, simulated membrane potential of a neuron emitting three spikes which are represented by dashed lines, membrane potential with reconstructed spikes, inward calcium current associated with changes in the membrane potential, cytosolic calcium concentration, and fluorescence emitted by the calcium indicator due to the intracellular concentration of calcium.
Figure 8
Figure 8
Results from the simulated pulling experiment. Comparison between the simulated slide position and the one recorded in the in-vivo experiment (A) and comparison between simulated muscle activation levels and force applied to the physical slide (B). To increase the readability of the bottom figure, an upper peak envelope was applied to the signals.
Figure 9
Figure 9
Simulated and empirical Functional connectivity and fitting the model. (A) Average power spectrum across the regions and the PLV values for each pair of regions (thin lines) during healthy state, as well as the significance levels from the surrogates (thick dotted lines). Vertical black lines show the boundaries of the upper δ band. (B) Relative changes of the FC at stroke and at rehabilitation compared to the healthy control for frequency band f = 2.5 − 5Hz. (C) Cross correlation of the model upper triangles of FC between the model and the data for fixed global coupling K = 4.3 and different levels of stroke (0 for complete damage and 0.9 for damage of 10% of the links) and rebound connectivity (0 for no rewiring and 5 for overall rewiring with strength of 5 times of the damaged links). Parameters: frequency f = 2Hz, noise strength D = 1. (D) Simulated relative changes of the FC at stroke and rehabilitation relative to the healthy control for the working points marked with red squares in the parameters space in the panel (C). The abbreviations for the areas in (B,D) are: VIS, visual; RSP, retrosplenial; SS, somatosensory; al, anterolateral; rl, rostrolateral; p, primary; pm, posteromedial; am, anteromedial; a, anterior; d, dorsal; agl, lateral agranular part; ptr, primary trunk; pll, primary lower limb; pun, primary unassigned; pul, primary upper limb.
Figure 10
Figure 10
Simulation of peri-stroke local network oscillations: experiments and models. (A) Fluorescence traces obtained from three example cells (two-photon signals) and from the entire field-of-view (wide field signals) recorded in mice under deep and light anesthesia. (B) Raster plot of the spikes (top) and averaged two-photon calcium signals (bottom) computed for the inhibitory (FS, in red) and excitatory (RS, in green) populations in a model of deep or light anesthesia.
Figure 11
Figure 11
Future perspective of data and simulations. The scheme depicts the approach to build the framework from data to models and back. The workflow from data to models and simulation in the Embodied brain closed loops is shown. The upper, green box shows the Stroke models closed loop, the lower, red box shows the Movement-driven models closed loop. Colored images represent experiment data, brain and spinal cord models, and simulation of the environment (from left to right). Connections between the components are presented as arrows: solid lines represent the output provided to other blocks; dashed lines indicate the output data of the models that are used for comparison with real data for validation. In gray, models and connections that are still under development. The overlapping green and red region pictures the future integration of the two pipelines, and in particular of the brain models within the NRP.

References

    1. Adhikari M. H., Hacker C. D., Siegel J. S., Griffa A., Hagmann P., Deco G., et al. . (2017). Decreased integration and information capacity in stroke measured by whole brain models of resting state activity. Brain 140, 1068–1085. 10.1093/brain/awx021 - DOI - PMC - PubMed
    1. Allegra Mascaro A. L., Conti E., Lai S., Di Giovanna A. P., Spalletti C., Alia C., et al. . (2019). Combined rehabilitation promotes the recovery of structural and functional features of healthy neuronal networks after stroke. Cell Rep. 28, 3474–3485.e6. 10.1016/j.celrep.2019.08.062 - DOI - PubMed
    1. Allegra Mascaro A. L., Silvestri L., Sacconi L., Pavone F. S. (2015). Towards a comprehensive understanding of brain machinery by correlative microscopy. J. Biomed. Optics 20:061105. 10.1117/1.JBO.20.6.061105 - DOI - PubMed
    1. Alstermark B. (1992). The C3-C4 propriospinal system: target-reaching and food-taking, in Muscle Afferents and Spinal Control of Movement (Elsevier Ltd: ), 327–354.
    1. Bashor D. P. (1998). A large-scale model of some spinal reflex circuits. Biol. Cybernet. 78, 147–157. 10.1007/s004220050421 - DOI - PubMed

LinkOut - more resources