. 2020 Jul 8:11:612.
doi: 10.3389/fphys.2020.00612. eCollection 2020.

Approaches to High-Throughput Analysis of Cardiomyocyte Contractility

Affiliations

Approaches to High-Throughput Analysis of Cardiomyocyte Contractility

Peter T Wright et al. Front Physiol. .

Abstract

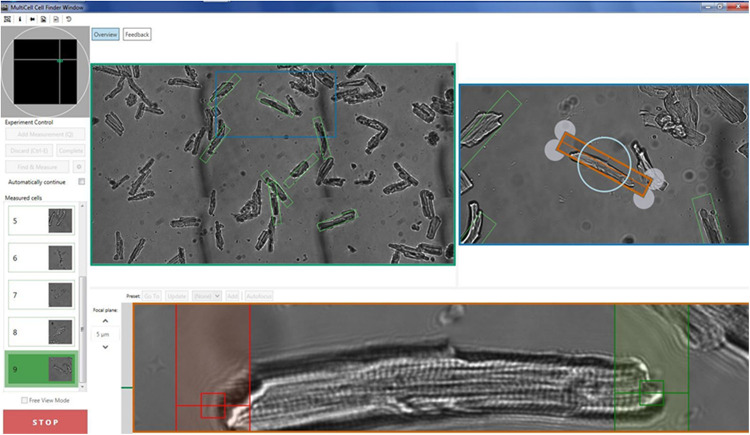
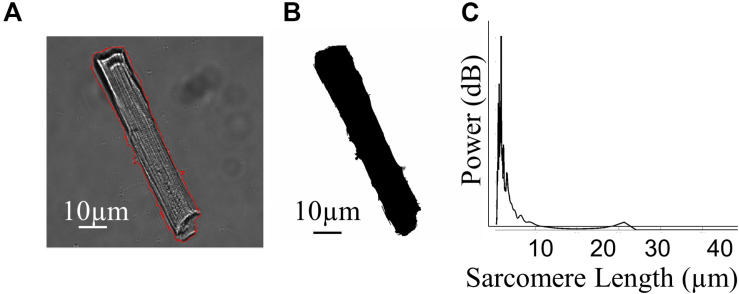
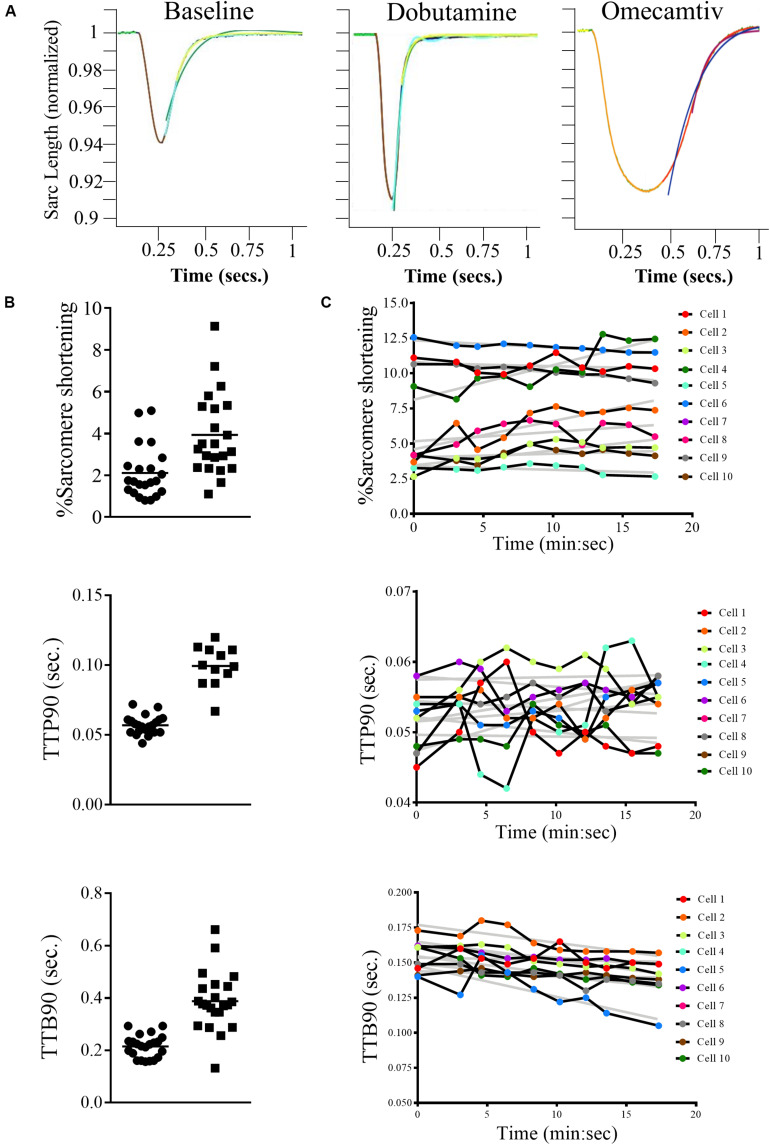
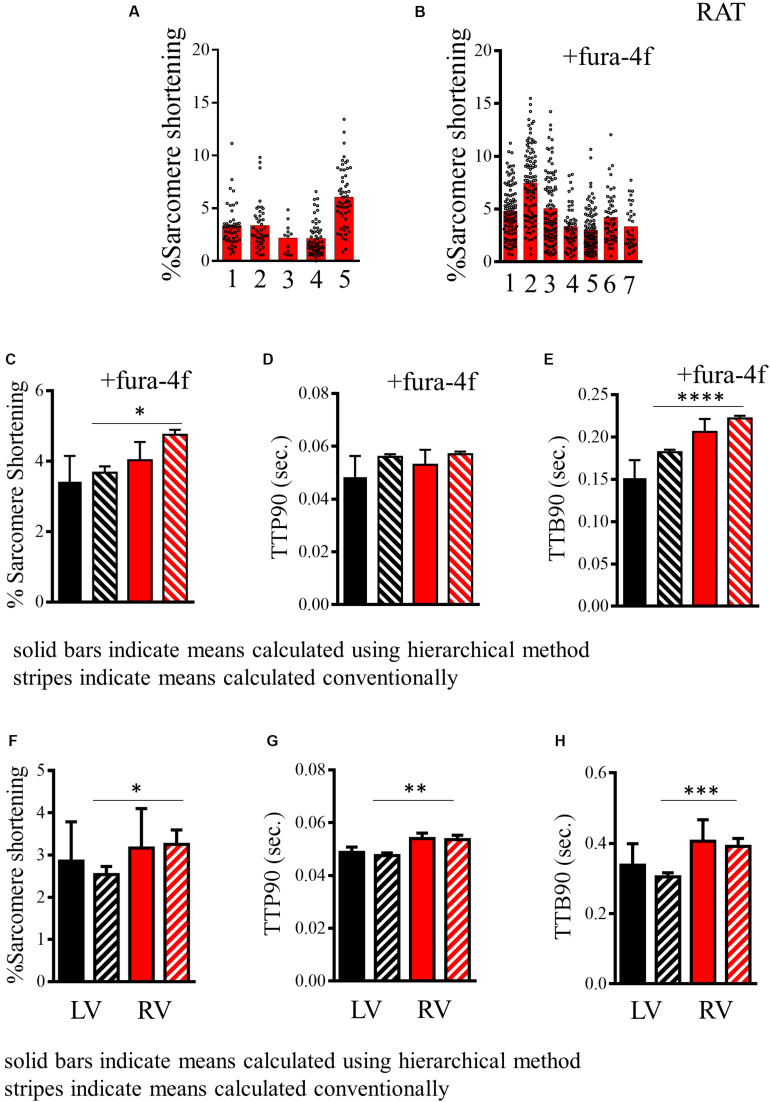
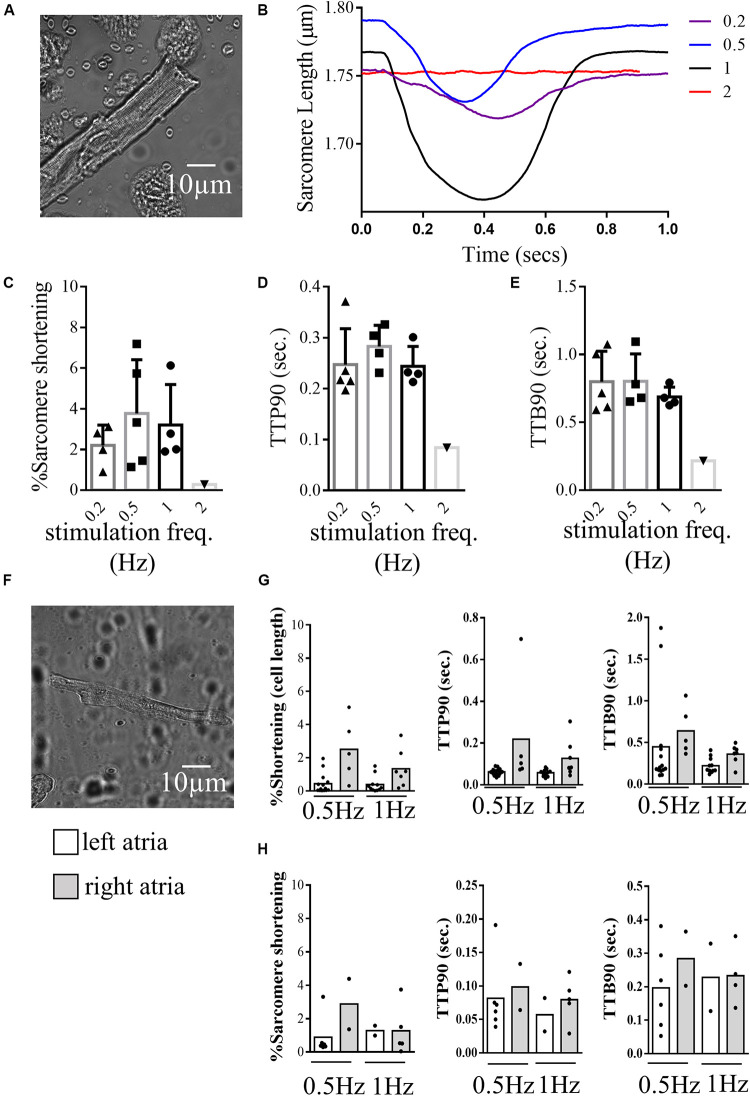
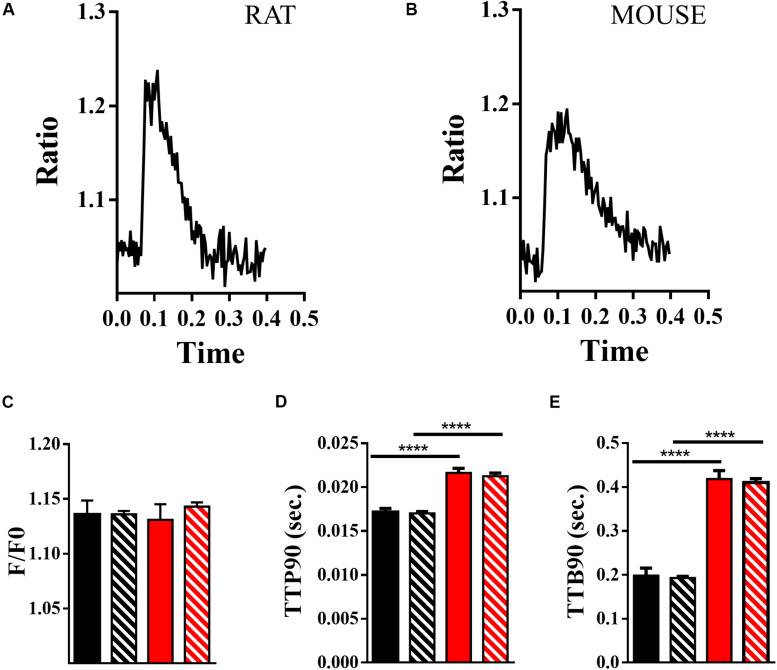
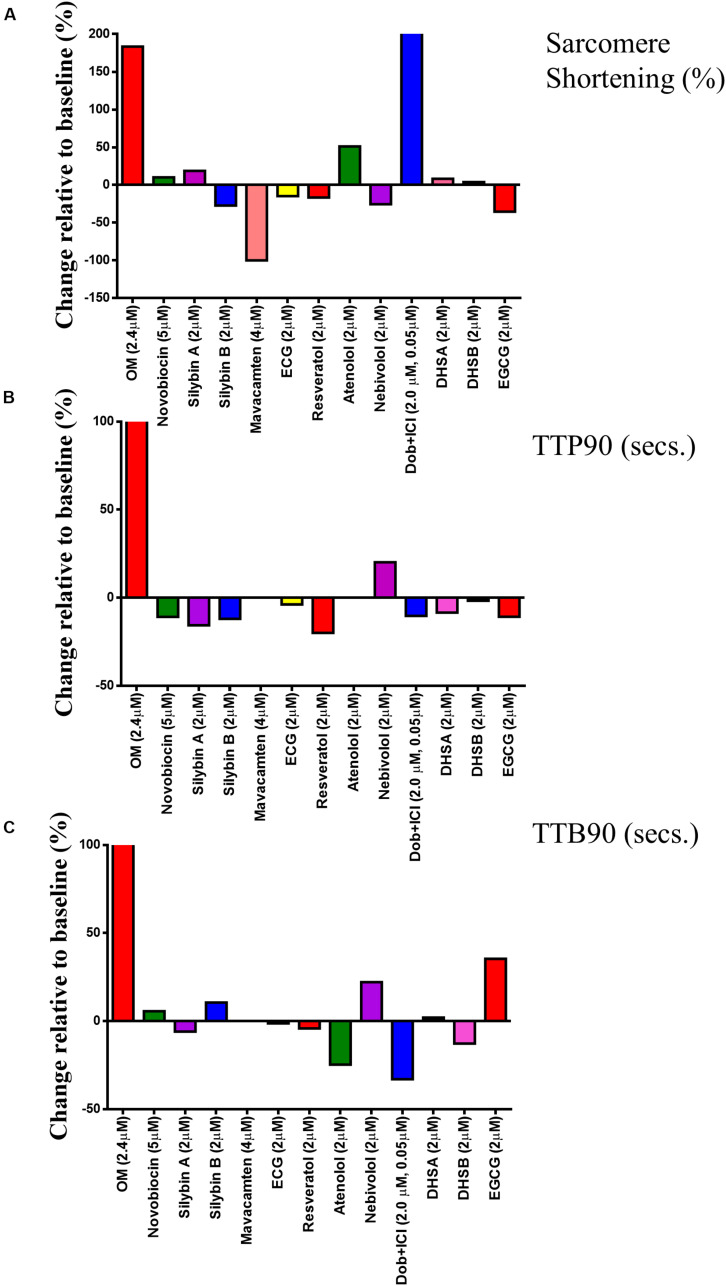
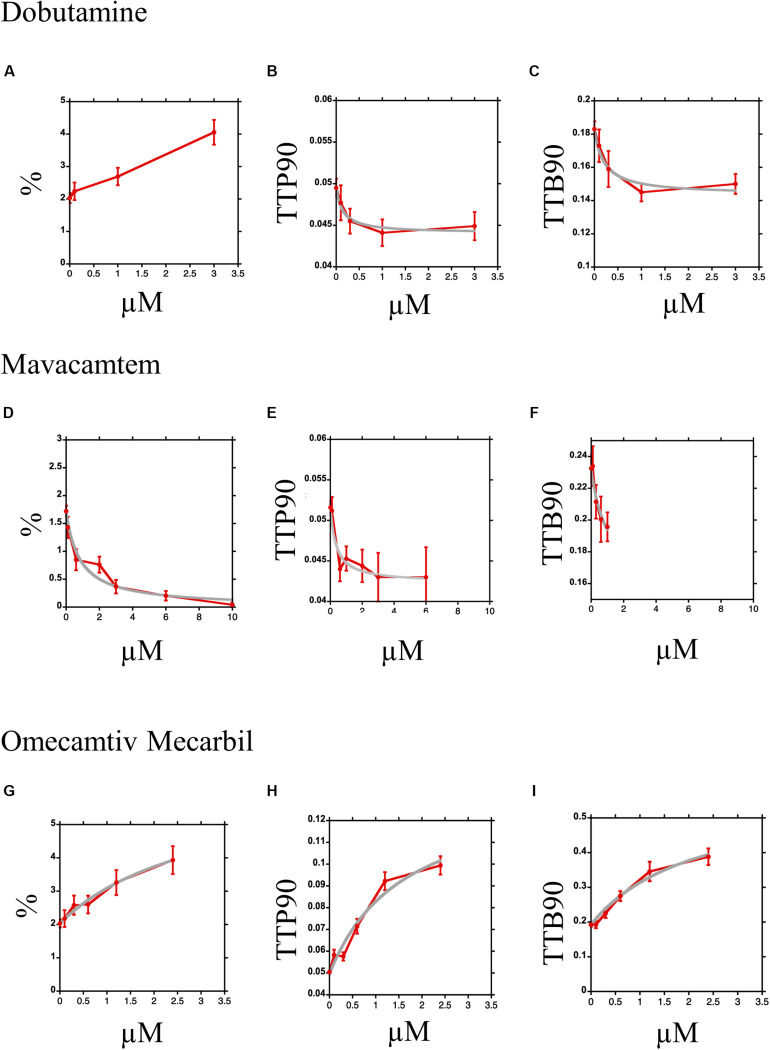
The measurement of the contractile behavior of single cardiomyocytes has made a significant contribution to our understanding of the physiology and pathophysiology of the myocardium. However, the isolation of cardiomyocytes introduces various technical and statistical issues. Traditional video and fluorescence microscopy techniques based around conventional microscopy systems result in low-throughput experimental studies, in which single cells are studied over the course of a pharmacological or physiological intervention. We describe a new approach to these experiments made possible with a new piece of instrumentation, the CytoCypher High-Throughput System (CC-HTS). We can assess the shortening of sarcomeres, cell length, Ca2+ handling, and cellular morphology of almost 4 cells per minute. This increase in productivity means that batch-to-batch variation can be identified as a major source of variability. The speed of acquisition means that sufficient numbers of cells in each preparation can be assessed for multiple conditions reducing these batch effects. We demonstrate the different temporal scales over which the CC-HTS can acquire data. We use statistical analysis methods that compensate for the hierarchical effects of clustering within heart preparations and demonstrate a significant false-positive rate, which is potentially present in conventional studies. We demonstrate a more stringent way to perform these tests. The baseline morphological and functional characteristics of rat, mouse, guinea pig, and human cells are explored. Finally, we show data from concentration response experiments revealing the usefulness of the CC-HTS in such studies. We specifically focus on the effects of agents that directly or indirectly affect the activity of the motor proteins involved in the production of cardiomyocyte contraction. A variety of myocardial preparations with differing levels of complexity are in use (e.g., isolated muscle bundles, thin slices, perfused dual innervated isolated heart, and perfused ventricular wedge). All suffer from low throughput but can be regarded as providing independent data points in contrast to the clustering problems associated with isolated cell studies. The greater productivity and sampling power provided by CC-HTS may help to reestablish the utility of isolated cell studies, while preserving the unique insights provided by studying the contribution of the fundamental, cellular unit of myocardial contractility.

Keywords: calcium; cardiomyocytes; contractility; high-throughput; sarcomere.


Figures

FIGURE 1
FIGURE 1
Illustration of the acquisition screen of the CytoCypher High-Throughput System for the analysis of cardiomyocyte contractility. See also Supplementary Video.
FIGURE 2
FIGURE 2
Morphological investigation of cardiomyocytes. (A) Example image of a rat cardiomyocyte acquired by the CytoCypher HTS during the measurement of contraction; the red line indicates the application of a segmentation mask. (B) Segmentation mask generated automatically by Fiji software using our semi-automated analysis. (C) Plot demonstrating the relative “power” of different frequencies within the cell, generated by the Cytospectre program.
FIGURE 3
FIGURE 3
Examples of measurements made using the CytoCypher HTS. (A) Average rat sarcomere length transients, 1 Hz, 20 V stimulation; baseline, 3 μM dobutamine (note larger peak and faster transients), and 2.4 μM Omecamtiv Mecarbil (note slower transients). The traces are averages of 10 contractions collected over 10 s. The colored segments represent green original average trace; yellow, baseline fit; orange, peak fit; red, recovery fit; purple, single exponential fit (Tau); and blue, double exponential fit. (B) The calculated parameters,% shortening, TTP90, secs and TTB90, secs from approximately 20 myocytes at baseline and in the presence of 2.4 μM Omecamtiv Mecarbil are shown with mean value indicated. Automatic cell finding; the two measurements took about 4 min each. Distribution of values is not normal, so significance is tested by Wilcoxon method. (C) Time course of the calculated parameters (% shortening, TTP90, secs and TTB90, secs) in the presence of 3 μM dobutamine + 0.05 μM ICI 118,551 for 10 myocytes in a field of view over 20 min. The gray lines are linear regression fits to the data. This plot shows the variability, both between myocytes and its change over time. The values in individual myocytes may increase or decrease slightly with time but on average% shortening and TTP90 are stable while TTB90 declines slightly over time.
FIGURE 4
FIGURE 4
Analysis of contractility of rat cardiomyocytes. (A,B) Histogram displaying measurements of the baseline sarcomere shortening of multiple individual preparations of rat cardiomyocytes without and with fura-4f loading. (C) Histogram comparing estimated mean and standard deviation of sarcomere shortening in the populations of rat cardiomyocytes presented in A (–Fura-4f black) and B (+Fura-4f red) with hierarchical structure included (solid bars) and assuming all measurements are independent samples (striped bars). (D) Histogram comparing estimated mean and standard deviation of TTP90 in populations of rat cardiomyocytes presented in Supplementary Figure 2C (–Fura-4f black) and D (+Fura-4f red) with hierarchical structure included (solid bars) and assuming all measurements are independent samples (striped bars). (E) Histogram comparing estimated mean and standard deviation of TTP90 in populations of rat cardiomyocytes presented in Supplementary Figure 2E (–Fura-4f black) and F (+Fura-4f red) with hierarchical structure included (solid bars) and assuming all measurements are independent samples (striped bars). (F) A representation of the estimated mean and standard error of sarcomere shortening of left and right ventricular cardiomyocytes isolated from mice. Datasets assuming a hierarchical structure (solid bars) and assuming no structure (striped bars). (G) Representations of the means and standard error of TTP90 of left and right ventricular cardiomyocytes isolated from mice with hierarchical structure (solid) and without (striped). (H) Representation of the means and standard error of TTB90 of left and right ventricular cardiomyocytes isolated from mice with hierarchical structure (solid) and without (striped).
FIGURE 5
FIGURE 5
Contractility of human cardiomyocytes. (A) Example image of a human ventricular cardiomyocyte isolated from the left ventricle of a patient with hypertrophic cardiomyopathy recorded during contraction analysis by the CytoCypher HTS. (B) Example traces of sarcomere shortening during the contraction cycle in the same cell paced at different frequencies. (C) Histogram and dot plots demonstrating the percentage sarcomere shortening of ventricular cells at different pacing frequencies. triangle = 0.2 Hz, square = 0.5 Hz, circle (line in bold) = 1 Hz inverted triangle = 2 Hz. (D) Histogram and dot plots demonstrating the TTP90 of sarcomere shortening of ventricular cells at different pacing frequencies. (E) Histogram and dot plots demonstrating the TTB90 of sarcomere shortening of ventricular cells at different pacing frequencies. (F) Example image of a human cardiomyocyte isolated from the left atrial chamber of a patient with hypertrophic cardiomyopathy. (G) Histogram and dot plots representing the cell shortening behaviors of cardiomyocytes isolated from the left and right atrial chambers of the same patient, paced at 0.5, and 1 Hz (% cell shortening, TTP90, and TTB90). clear bar = left atria and gray bar = right atria (H) Histogram and dot plots representing the sarcomere shortening behaviors of left and right atrial cardiomyocytes isolated from the left and right atria paced at 0.5 and 1 Hz (% sarcomere shortening, TTP90, and TTB90). clear bar = left atria and gray bar = right atria.
FIGURE 6
FIGURE 6
Measurement of Ca2+ transients using Fura-4f. (A) Example Ca2+ transient from a rat ventricular cardiomyocyte loaded with fura-4f. (B) Example Ca2+ transient of a mouse ventricular cardiomyocyte loaded with fura-4f. (C) Comparison of F/F0 of rat (black) and mouse (red) Ca2+ transients, means and standard error with hierarchical effects included (solid) and without (striped). (D) Comparison of TTP90 of Ca2+ transients of rat (black) and mouse (red) Ca2+ transients, means and standard error with hierarchical effects included (solid) and without (striped; ****p < 0.0001). (E) Comparison of TTB90 of Ca2+ transients of rat (black) and mouse (red) Ca2+ transients, means and standard error with hierarchical effects included (solid) and without (striped; ****p < 0.0001).
FIGURE 7
FIGURE 7
Single concentration screen for compounds with potential to affect myocyte contractility. The effects of 13 compounds were tested using a single preparation of rat myocytes. (A–C) show the fractional change in each parameter due to the compound: y = 100 × (mean with compound/mean baseline)-100. For original data, see Supplementary Figure 6. These data are constructed from a dataset of between 25 and 30 cardiomyocytes.
FIGURE 8
FIGURE 8
Dose–response curves for Dobutamine, Omecamtiv Mecarbil, and Mavacamten. (A–C) Dose–response curve for myocyte contraction in the presence of Dobutamine and 0.05 μM ICI 118,551. The mean and standard error are plotted in red; the data for TTP90 and TTB90 are fitted to the equation y = y0–[Bm.(dobu)/(EC50 + (dobu))] in gray. The % shortening parameter could not be fitted. (D,E) Dose–response curve for myocyte contraction in the presence of Omecamtiv Mecarbil. The mean and standard error are plotted in red; the data for all three parameters are fitted to the equation y = y0 + [Bm.(OM)/(EC50 + (OM))] in gray. (G–I) Dose–response curves for myocyte contraction in the presence of Mavacamten. The mean and standard error are plotted in red; the data for all three parameters are fitted to the equation y = y0–[y0.(mava)/(EC50 + (mava))] in gray.

References

    1. Abi-Gerges N., Pointon A., Pullen G. F., Morton M. J., Oldman K. L., Armstrong D., et al. (2013). Preservation of cardiomyocytes from the adult heart. J. Mol. Cell. Cardiol. 64 108–119. 10.1016/j.yjmcc.2013.09.004 - DOI - PubMed
    1. Bers D. M. (2002). Cardiac excitation-contraction coupling. Nature 415 198–205. 10.1038/415198a - DOI - PubMed
    1. Brandenburg S., Kohl T., Williams G. S. B., Gusev K., Wagner E., Rog-Zielinska E. A., et al. (2016). Axial tubule junctions control rapid calcium signaling in atria. J. Clin. Invest. 126 3999–4015. 10.1172/JCI88241 - DOI - PMC - PubMed
    1. Davia K., Hajjar R. J., Terracciano C. M., Kent N. S., Ranu H. K., O’Gara P., et al. (1999). Functional alterations in adult rat myocytes after overexpression of phospholamban with use of adenovirus. Physiol. Genomics 1 41–50. 10.1152/physiolgenomics.1999.1.2.41 - DOI - PubMed
    1. Fast V. G. (2005). Simultaneous optical imaging of membrane potential and intracellular calcium. J. Electrocardiol. 38 107–112. 10.1016/j.jelectrocard.2005.06.023 - DOI - PubMed