. 2020 Jul 7:11:435.
doi: 10.3389/fendo.2020.00435. eCollection 2020.

Systems Analysis of Insulin and IGF1 Receptors Networks in Breast Cancer Cells Identifies Commonalities and Divergences in Expression Patterns

Affiliations

Systems Analysis of Insulin and IGF1 Receptors Networks in Breast Cancer Cells Identifies Commonalities and Divergences in Expression Patterns

Rive Sarfstein et al. Front Endocrinol (Lausanne). .

Abstract

Insulin and insulin-like growth factor-1 (IGF1), acting respectively via the insulin (INSR) and IGF1 (IGF1R) receptors, play key developmental and metabolic roles throughout life. In addition, both signaling pathways fulfill important roles in cancer initiation and progression. The present study was aimed at identifying mechanistic differences between INSR and IGF1R using a recently developed bioinformatics tool, the Biological Network Simulator (BioNSi). This application allows to import and merge multiple pathways and interaction information from the KEGG database into a single network representation. The BioNsi network simulation tool allowed us to exploit the availability of gene expression data derived from breast cancer cell lines with specific disruptions of the INSR or IGF1R genes in order to investigate potential differences in protein expression that might be linked to biological attributes of the specific receptor networks. Modeling-generated information was corroborated by experimental and biological assays. BioNSi analyses revealed that the expression of 75 and 71 genes changed during simulation of IGF1R-KD and INSR-KD, compared to control cells, respectively. Out of 16 proteins that BioNSi analysis was based on, validated by Western blotting, nine were shown to be involved in DNA repair, eight in cell cycle checkpoints, six in proliferation, eight in apoptosis, seven in oxidative stress, six in cell migration, two in energy homeostasis, and three in senescence. Taken together, analyses identified a number of commonalities and, most importantly, dissimilarities between the IGF1R and INSR pathways that might help explain the basis for the biological differences between these networks.

Keywords: BioNSi; IGF1 receptor (IGF1R); insulin receptor (INSR); insulin-like growth factor-1 (IGF1); network simulation; systems analysis.


Figures

Figure 1
Figure 1
Diagram of BioNSi simulations experimental design. Network nodes are shown as rectangles with gene name and an initial normalized expression value below it. Grayscale coloring of nodes represents gene expression of control MCF7 cells. Green edges are shown as directed arrows, representing gene activation (with level 2, as indicated in section Materials and Methods). Initial expression values for the key genes affecting gene expression [INSR, insulin (INS), IGF1R, and IGF1] are presented (simulations: 1, control; 2, INSR-KD; and 3, IGF1R-KD). Initial expression of INS and IGF1 were set manually to 0 (KD) or 20 (very high).
Figure 2
Figure 2
BioNSi network and simulation analyses of MCF7-derived breast cancer cell lines. (A) Reduced network of 68 genes (only biologically tested genes and their neighbors), colored according to their initial expression value (grayscale). The initial expression value is written underneath each gene name. INS and IGF1 expression was manually set as very high (20), and genes are highlighted in turquoise frame. Complexes initial expression is zero by BioNSi default. Activation arrow edges are colored green. Inhibition edges are colored red with flat heads. Simulation analyses were performed on the complete network (385 genes). Node's background was changed after simulations: genes whose expression changed during simulation in both KD cells are colored orange; genes whose expression changed during simulation only in IGF1R-KD cells are colored purple; and genes whose expression changed during simulation only in INSR-KD cells are colored green. (B) Venn diagram of numbers of genes whose expression changed during simulation (specific KD vs. control). Nodes whose expression changed only in IGF1R-KD cells are colored purple (IGF1R, STAT3, GAB1, JAK1, PLCG1, SRC, and diacylglycerol). Genes whose expression changed during simulation only in INSR-KD are colored green (INSR, SH2B2, and CBLC). Overlapping genes whose expression changed during simulation in both KD cells are colored orange.
Figure 3
Figure 3
Western blots and BioNSi simulation analyses of IGF1R and INSR expression after KD. Western blots of IGF1R (A) and INSR (C) were conducted using total lysates of Control, IGF1R-KD and INSR-KD cells. One-hundred simulation steps were performed as described in Figure 2. A dashed vertical line indicates 50 steps of simulation. BioNSi plots of expression values against simulation steps are shown (B,D). Control (blue), IGF1R-KD (red), and INSR-KD (green). Splicing has occurred in the blot figures and full scans of the entire original (unprocessed) gels are presented in Supplementary Material. Squares in the uncropped films denote bands shown in the final figures.
Figure 4
Figure 4
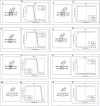
Eight selected genes that do not change between control and KDs: BioNSi simulations validated by Western blots. Western blot analyses showing expression of HRas (A), TP53 (C), AKT3 (E), CASP3 (G), MTOR (I), PRKAA1 (K), p16 (M), and p21 (O) proteins were conducted on whole cell lysates of Control, IGF1R-KD, and INSR-KD cells. Hsp70 was used as a loading control. Data are representative of two independent experiments. (B,D,F,H,J,L,N,P) BioNSi plots of normalized expression values against 100 simulation steps in Control (blue), IGF1R-KD (red), and INSR-KD (green) cells. A dashed vertical line indicates 50 steps of simulation. Splicing has occurred in the blot figures and full scans of the entire original (unprocessed) gels are presented in Supplementary Material. Squares in the uncropped films denote bands shown in the final figures.
Figure 5
Figure 5
Six selected genes exhibiting a change between control and IGF1R-KD, validated by Western blots. Western blot analysis showing expression of CCND1 (A), ATM (D), JAK1 (G), STAT3 (J), SOD2 (N), and Chek2 (Q) proteins levels were performed as described above. (B,E,H,K,L,O,R) Scanning densitometry analysis of basal proteins levels. Bars represent protein values (AU, arbitrary units), normalized to the corresponding Hsp70 levels. Results of an illustrative experiment, repeated twice with similar results, are shown. *p < 0.01 vs. control cells. (C,F,I,M,P,S) BioNSi simulation plots of normalized expression values against 100 simulation steps are shown. Control (blue), IGF1R-KD (red), and INSR-KD (green). A dashed vertical line indicates 50 steps of simulation. Splicing has occurred in the blot figures and full scans of the entire original (unprocessed) gels are presented in Supplementary Material. Squares in the uncropped films denote bands shown in the final figures.
Figure 6
Figure 6
Cell cycle stages distribution in Control, IGF1R-KD, and INSR-KD cells. Cells were seeded in quadruplicate dishes, and treated with IGF1 or insulin (or left untreated, controls) for 72 h. The bars represent mean ± SEM) of three independent experiments, performed each in duplicates samples. Cell cycle distribution was measured as described in section Materials and Methods. *p = 0.05 vs. untreated cells.
Figure 7
Figure 7
Effect of INSR or IGF1R disruption (KD) on etoposide-induced senescence. (A) Senescence-associated beta-galactosidase (SA-β-gal) staining (blue/green) in MCF7 stable cells after treatment with etoposide (10 μM) for 48 h. (B) Percentage of SA-β-gal positive cells was counted in at least three random fields from quadruplicates samples. Graph represents means ± SEM (n = 4). *Statistically significantly different from controls, p < 0.01. (C) Western blotting of p16 and p21 protein expression in the presence (+) or absence (–) of etoposide in MCF7 stable cells. Hsp70 was used as a loading control. Splicing has occurred in the blot figures and full scans of the entire original gels is presented in Supplementary Material. Squares denote bands shown in the final figures.

Similar articles

Cited by

References

    1. Yakar S, Adamo ML. Insulin-like growth factor 1 physiology: lessons from mouse models. Endocrinol Metab Clin North Am. (2012) 41:231–47. 10.1016/j.ecl.2012.04.008 - DOI - PMC - PubMed
    1. LeRoith D, Yakar S. Mechanisms of disease: metabolic effects of growth hormone and insulin-like growth factor-1. Nat Clin Pract Endocrinol Metab. (2007) 3:302–10. 10.1038/ncpendmet0427 - DOI - PubMed
    1. Rosenfeld RG. Insulin-like growth factors and the basis of growth. N Engl J Med. (2003) 349:2184–6. 10.1056/NEJMp038156 - DOI - PubMed
    1. Werner H, Weinstein D, Bentov I. Similarities and differences between insulin and IGF-I: structures, receptors, and signaling pathways. Arch Physiol Biochem. (2008) 114:17–22. 10.1080/13813450801900694 - DOI - PubMed
    1. Sarfstein R, Werner H. The Insulin/IGF1 receptors family. In: Wheeler DL, Yarden Y. editors, The Receptor Tyrosine Kinase Handbook. New York, NY: Springer Science; (2015). p. 297–320.

MeSH terms