. 2020 Jul 7:11:1390.
doi: 10.3389/fimmu.2020.01390. eCollection 2020.

Alterations in Circulating Fatty Acid Are Associated With Gut Microbiota Dysbiosis and Inflammation in Multiple Sclerosis

Affiliations

Alterations in Circulating Fatty Acid Are Associated With Gut Microbiota Dysbiosis and Inflammation in Multiple Sclerosis

Marina Saresella et al. Front Immunol. .

Abstract

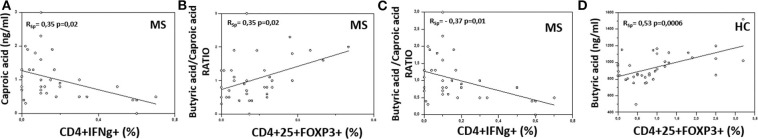
Background: Butyric acid (BA) is a short-chain fatty acid (SCFA) with anti-inflammatory properties, which promotes intestinal barrier function. Medium-chain fatty acids (MCFA), including caproic acid (CA), promote TH1 and TH17 differentiation, thus supporting inflammation. Aim: Since most SCFAs are absorbed in the cecum and colon, the measurement of BA in peripheral blood could provide information on the health status of the intestinal ecosystem. Additionally, given the different immunomodulatory properties of BA and CA the evaluation of their serum concentration, as well as their ratio could be as a simple and rapid biomarker of disease activity and/or treatment efficacy in MS. Methods: We evaluated serum BA and CA concentrations, immune parameters, intestinal barrier integrity and the gut microbiota composition in patients with multiple sclerosis (MS) comparing result to those obtained in healthy controls. Results: In MS, the concentration of BA was reduced and that of CA was increased. Concurrently, the microbiota was depleted of BA producers while it was enriched in mucin-degrading, pro-inflammatory components. The reduced serum concentration of BA seen in MS patients correlated with alterations of the barrier permeability, as evidenced by the higher plasma concentrations of lipopolysaccharide and intestinal fatty acid-binding protein, and inflammation. Specifically, CA was positively associated with CD4+/IFNγ+ T lymphocytes, and the BA/CA ratio correlated positively with CD4+/CD25high/Foxp3+ and negatively with CD4+/IFNγ+ T lymphocytes. Conclusion: The gut microbiota dysbiosis found in MS is possibly associated with alterations of the SCFA/MCFA ratio and of the intestinal barrier; this could explain the chronic inflammation that characterizes this disease. SCFA and MCFA quantification could be a simple biomarker to evaluate the efficacy of therapeutic and rehabilitation procedures in MS.

Keywords: T lymphocytes; butyric acid; caproic acid; cytokines; dysbiosis; gut microbiota; multiple sclerosis; short-chain fatty acids (SCFAs).


Figures

Figure 1
Figure 1
Serum concentration of butyric and caproic acid in MS patients compared to healthy controls. LC-MS/MS analysis of (A) serum concentration (ng/ml) of butyric acid and (B) caproic acid in Multiple Sclerosis patients (MS) (n = 38) and healthy controls (HC) (n = 38). (C) The butyric/caproic acid ratio. In all panels the boxes stretch from the 25th to the 75th percentile; the line across the boxes indicates the median value; the lines stretching from the boxes indicate extreme values. Outliers are displayed as separate points. Statistical significance is shown.
Figure 2
Figure 2
Treg, TH1, TH17, and THR1 CD4+ lymphocyte subsets in peripheral blood of MS patients compared to healthy controls. Representative flow cytometry dot plots results obtained in Multiple Sclerosis patients (MS) (n = 38) and healthy controls (HC) (n = 38). (A) Lymphocytes and CD4+ T lymphocytes (gate strategy), (B) Tregs: CD25+ and intracellular FOXP3 expression gated on CD4+T cell (CD4+/CD25high/Foxp3+), (C) TH1: CD4 and intracellular IFNγ (CD4+/IFNγ+) expression gated on Lymphocyte, (D) TH17: CD4 and intracellular IL-17 (CD4+/IL-17+) expression gated on Lymphocyte and (E) THR1: CD4 and intracellular IL-10 (CD4+/IL-10+) expression gated on Lymphocyte. In the upper right corner the percentage of Treg, TH1, TH17 and THR1 lymphocytes is presented. Summary results are shown in the bar graphs. The boxes stretch from the 25th to the 75th percentile; the line across the boxes indicates the median value; the lines stretching from the boxes indicate extreme values. Outliers are displayed as separate points. Comparisons between groups were performed using a two-tailed Mann-Whitney test for independent samples. Statistical significance is shown.
Figure 3
Figure 3
Correlation between the serum concentration of butyric and caproic acid and their ratio and peripheral immune cells in MS and healthy controls. Rank correlation between: (A) serum caproic acid concentration and peripheral IFNγ-producing CD4+ T cell percentage, (B) butyric acid/caproic acid ratio and Treg (CD4+/CD25high/Foxp3+) cell percentage, (C) butyric acid/caproic acid ratio and TH1 (CD4+/IFNγ+) cell percentage in Multiple Sclerosis patients (MS) (n = 38); (D) serum butyric acid concentration and Treg (CD4+/CD25high/Foxp3+) cell percentage in healthy controls (HC) (n = 38). Statistical correlations were investigated by the Spearman correlation coefficient and 95% confidence limits performed by Fisher's Z transformation. Statistical significance and Spearman's coefficient of rank correlation (RSp) are shown.
Figure 4
Figure 4
Indices of microbial translocation and indicators of alteration of the integrity of the gut barrier permeability in MS patients and healthy controls. Plasma concentrations of (A) LPS (Eu/ml) and (B) I-FABP (pg/ml) in Multiple Sclerosis patients (MS) (n = 38) and healthy controls (HC) (n = 38) were determined by ELISA. Comparisons between groups were performed using a two-tailed Mann-Whitney test for independent samples. The boxes stretch from the 25th to the 75th percentile; the line across the boxes indicates the median value; the lines stretching from the boxes indicate extreme values. Outliers are displayed as separate points. Statistical significance is shown.
Figure 5
Figure 5
The gut microbiota of SPMS and RRMS patients segregates from that of healthy controls. (A) Boxplots showing the distribution of alpha diversity, measured using the Simpson (top panel) and Shannon (bottom panel) indices, for the gut microbiota of Multiple Sclerosis (MS) patients with secondary-progressive and relapsing-remitting disease (respectively, SPMS and RRMS). *p = 0.01; **p = 0.004; Wilcoxon test. (B) Principal Coordinates Analysis (PCoA) of the gut microbial communities, based on the Jaccard similarity index. A significant separation between MS patients and HC was found (p < 1 × 10⁻⁴, permutation test with pseudo-F ratios), but no significant differences were observed between SPMS and RRMS (p = 0.4).
Figure 6
Figure 6
The dysbiotic layout of the gut microbiota in MS patients. (A) Genus-level relative abundance profiles of the gut microbiota of Multiple Sclerosis patients (MS, red) and healthy controls (HC, blue). Data are shown in the bar plots for each sample and in pie charts as average values. *, unclassified Amplicon Sequence Variants (ASVs) reported at higher taxonomic level; **, other unclassified ASVs. (B) Boxplots showing the relative abundance distribution of bacterial genera relevant for MS and significantly different between the study groups. *p ≤ 0.05; Wilcoxon test.
Figure 7
Figure 7
Associations between taxon relative abundances and levels of fatty acids, T cell subsets, LPS and I-FABP in MS patients. Only statistically significant correlations (p ≤ 0.05) based on Kendall rank correlation test are shown, for the entire cohort of Multiple Sclerosis (MS) patients (A) as well as for the two disease subtypes (SPMS, secondary-progressive MS and RRMS, relapsing-remitting MS) (B).

References

    1. Wang Y, Kasper LH. The role of microbiome in central nervous system disorders. Brain Behav Immun. (2014) 38:1–12. 10.1016/j.bbi.2013.12.015 - DOI - PMC - PubMed
    1. Bhargava P, Mowry EM. Gut microbiome and multiple sclerosis. Curr Neurol Neurosci Rep. (2014) 14:492. 10.1007/s11910-014-0492-2 - DOI - PubMed
    1. Ochoa-Reparaz J, Mielcarz DW, Begum-Haque S, Kasper LH. Gut, bugs, and brain: role of commensal bacteria in the control of central nervous system disease. Ann Neurol. (2011) 69:240–7. 10.1002/ana.22344 - DOI - PubMed
    1. Miyake S, Kim S, Suda W, Oshima K, Nakamura M, Matsuoka T, et al. . Dysbiosis in the gut microbiota of patients with multiple sclerosis, with a striking depletion of species belonging to Clostridia XIVa and IV clusters. PLoS ONE. (2015) 10:e0137429. 10.1371/journal.pone.0137429 - DOI - PMC - PubMed
    1. Jangi S, Gandhi R, Cox LM, Li N, von Glehn F, Yan R, et al. . Alterations of the human gut microbiome in multiple sclerosis. Nat Commun. (2016) 7:12015. 10.1038/ncomms12015 - DOI - PMC - PubMed

Publication types

MeSH terms