. 2020 Jul 7:11:1429.
doi: 10.3389/fimmu.2020.01429. eCollection 2020.

High-Resolution Profiling of Innate Immune Responses by Porcine Dendritic Cell Subsets in vitro and in vivo

Affiliations

High-Resolution Profiling of Innate Immune Responses by Porcine Dendritic Cell Subsets in vitro and in vivo

Gaël Auray et al. Front Immunol. .

Abstract

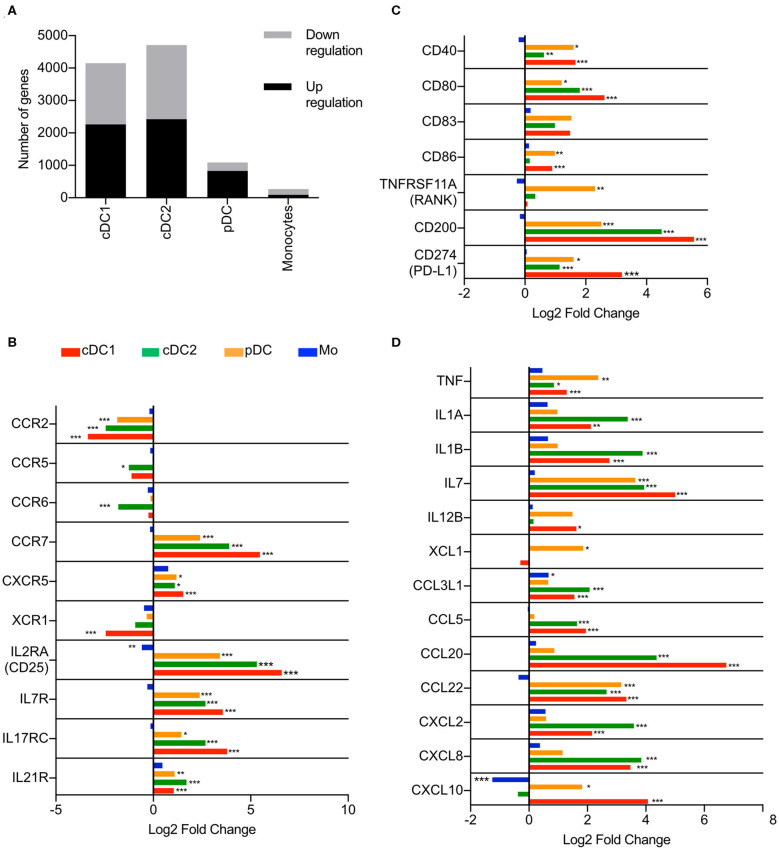
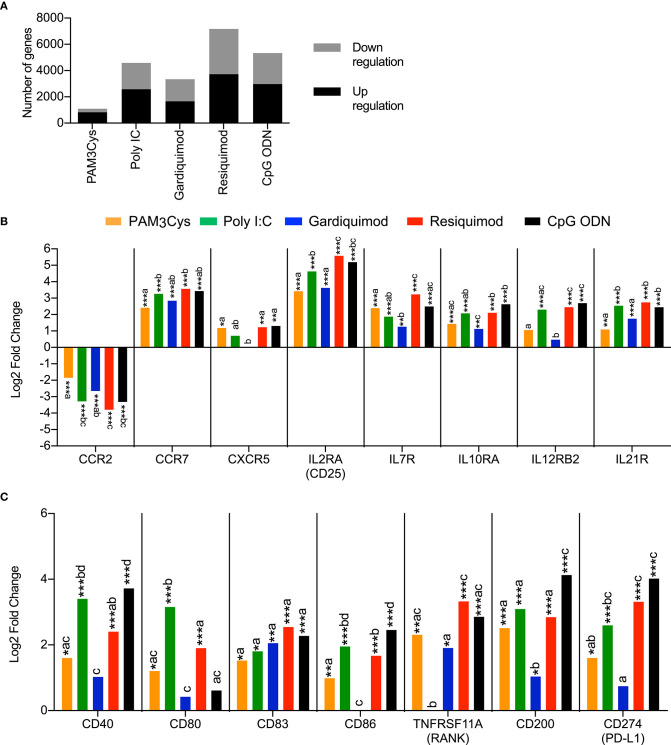
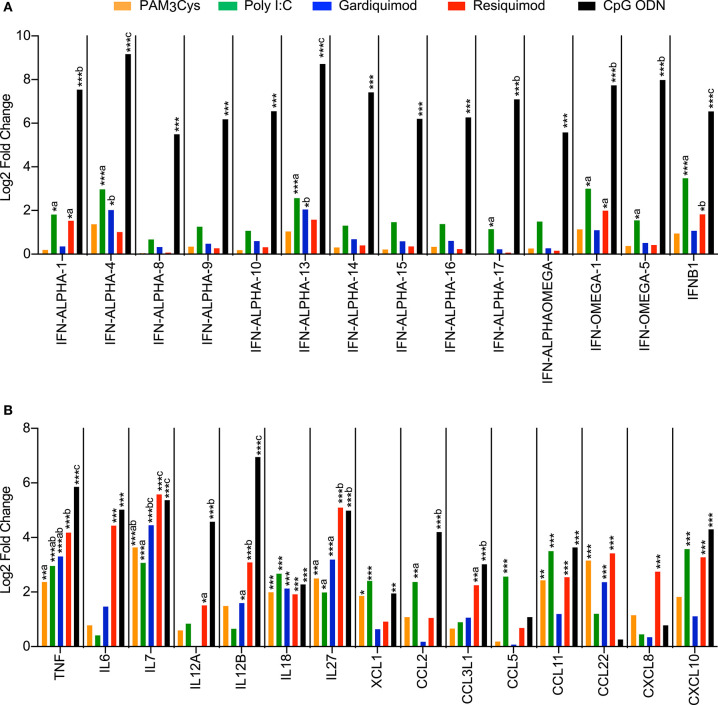
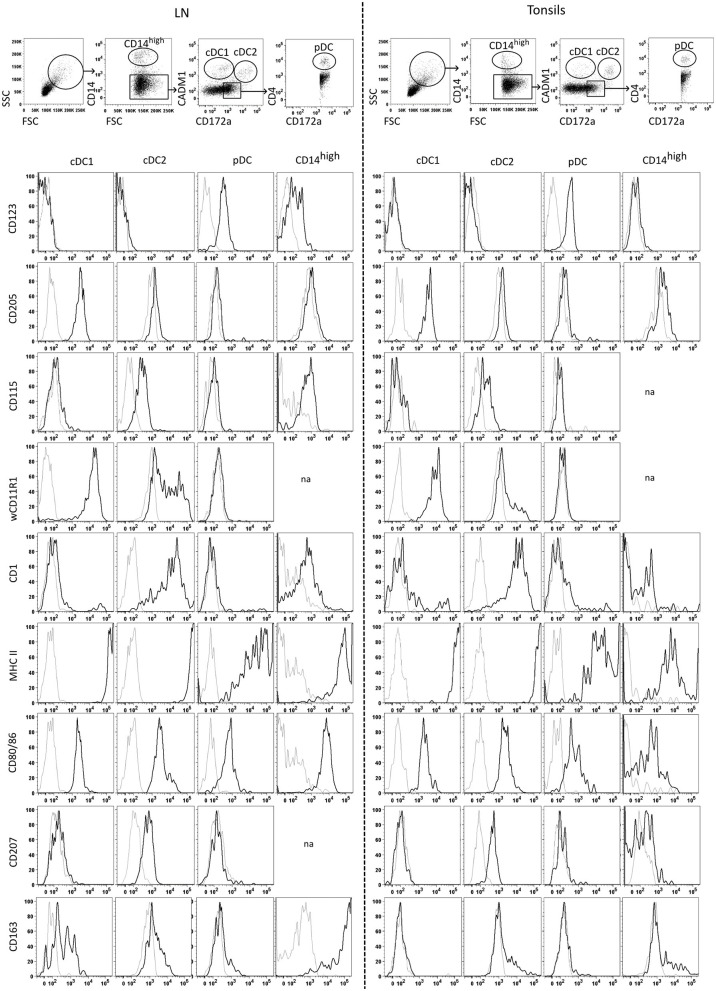
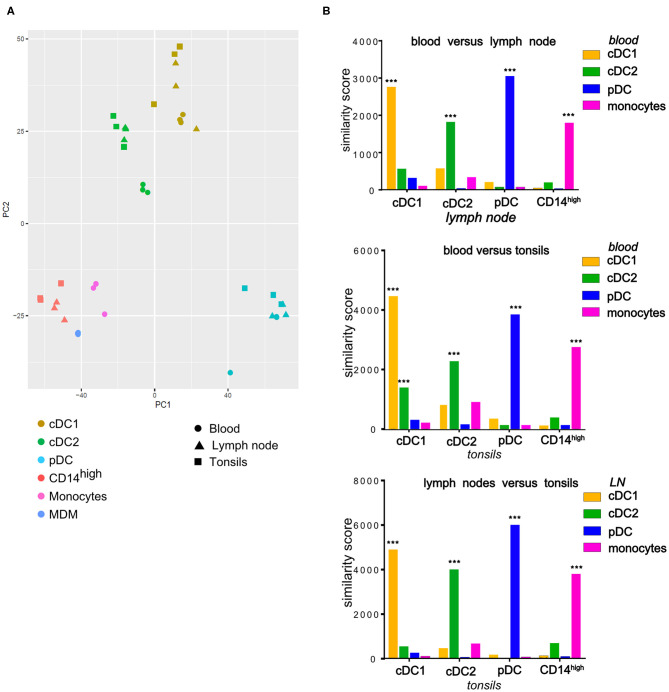
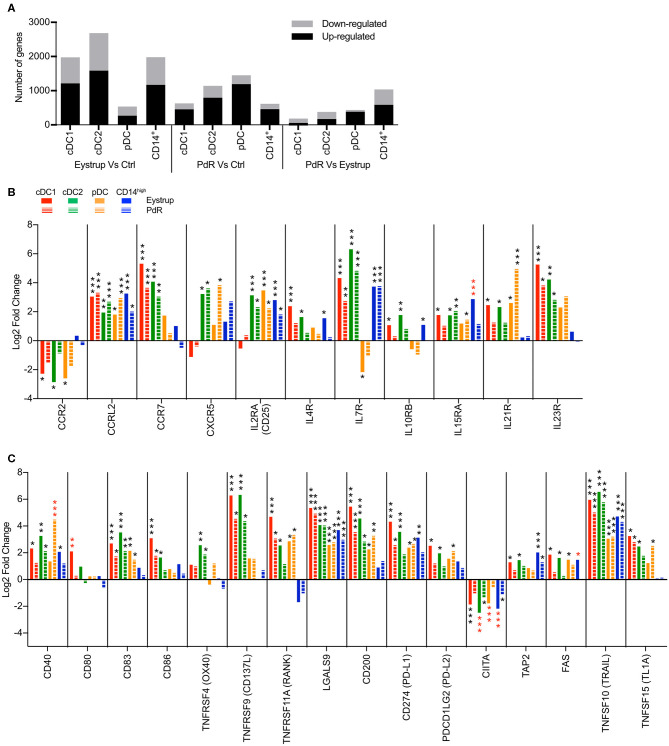
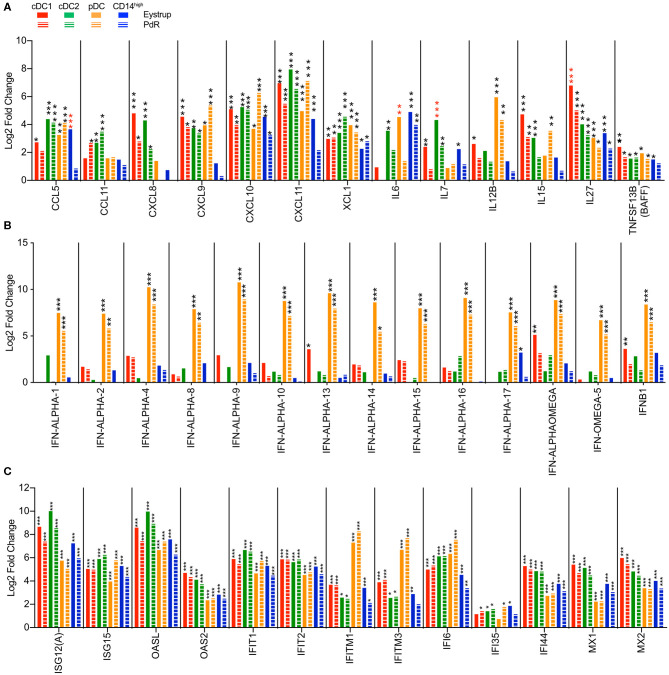
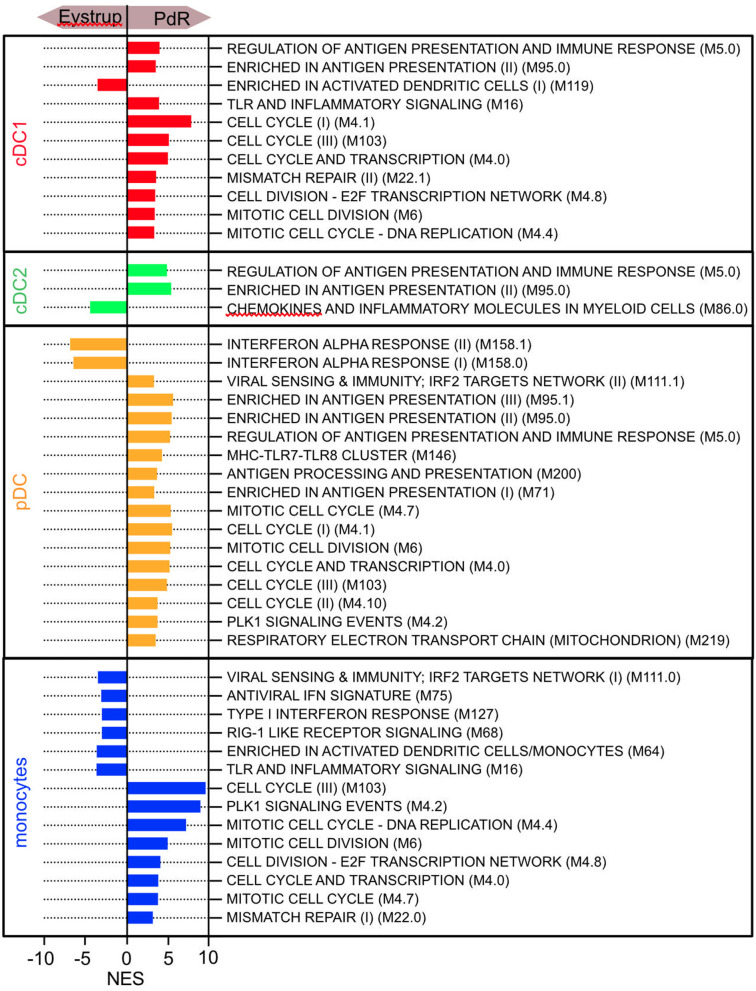
The present study investigated the transcriptomic response of porcine dendritic cells (DC) to innate stimulation in vitro and in vivo. The aim was to identify DC subset-specialization, suitable Toll-like receptor (TLR) ligands targeting plasmacytoid DC (pDC), and the DC activation profile during highly and low virulent classical swine fever virus (CSFV, strain Eystrup and Pinar del Rio, respectively) infection, chosen as model for a virus causing a severe immunopathology. After identification of porcine conventional DC (cDC) 1, cDC2, pDC and a monocyte-derived subset in lymphoid tissues, we characterized DC activation using transcriptomics, and focused on chemokines, interferons, cytokines, as well as on co-stimulatory and inhibitory molecules. We demonstrate that porcine pDC provide important signals for Th1 and interferon responses, with CpG triggering the strongest responses in pDC. DC isolated early after infection of pigs with either of the two CSFV strains showed prominent upregulation of CCL5, CXCL9, CXCL10, CXCL11, and XCL1, as well as of the cytokines TNFSF13B, IL6, IL7, IL12B, IL15, IL27. Transcription of IL12B and many interferon genes were mostly restricted to pDC. Interestingly, the infection was associated with a prominent induction of inhibitory and cell death receptors. When comparing low and highly virulent CSFV strains, the latter induced a stronger inflammatory and antiviral response but a weaker cell cycle response, and reduced antigen presentation functions of DC. Taken together, we provide high-resolution information on DC activation in pigs, as well as information on how DC modulation could be linked to CSFV immunopathology.

Keywords: classical swine fever; dendritic cells; porcine (pig) model; toll like receptor; transcriptomics analysis.


Figures

Figure 1
Figure 1
Transcription profiles of porcine blood mononuclear phagocytes following PAM3Cys stimulation. cDC1, cDC2, pDC and monocytes from three different animals were sorted by FACS and stimulated for 3 h with 10 μg/ml of PAM3Cys or left unstimulated as control. (A) Number of significantly regulated genes (padj < 0.05) when comparing PAM3Cys-stimulated cells to the corresponding non-stimulated control. (B) Expression of selected chemokine and cytokine receptor genes as log2 fold change between PAM3Cys-stimulated cells and their corresponding non-stimulated control. (C) Expression of selected costimulatory molecule genes as log2 fold change between PAM3Cys-stimulated cells and their corresponding non-stimulated control. (D) Expression of selected chemokine and cytokine genes as log2 fold change between PAM3Cys-stimulated cells and their corresponding non-stimulated control. DESeq2 analysis * padj < 0.05, ** padj < 0.01, *** padj < 0.0001.
Figure 2
Figure 2
Transcription profiles of porcine blood pDC stimulated with TLR ligands. pDC from three different animals were sorted by FACS and stimulated with 10 μg/ml of PAM3Cys, 10 μg/ml poly I:C, 5 μg/ml gardiquimod, 5 μg/ml resiquimod, 5 μg/ml CpG ODN D32, or were left unstimulated as control. (A) Number of significantly regulated genes (Padj < 0.05) when comparing TLR ligand-stimulated pDC to control pDC. (B) Expression of selected chemokines and cytokines receptor genes as log2 fold change between TLR ligand-stimulated pDC and control pDC. (C) Expression of selected costimulatory molecule genes as log2 fold change between TLR ligand-stimulated pDC and control pDC. DESeq2 analysis * padj < 0.05, ** padj < 0.001, *** padj < 0.0001. For each gene, different letters indicate statistical significance between two TLR-ligand stimulation groups as calculated by DESeq2 analysis.
Figure 3
Figure 3
Transcription profiles of porcine blood pDC stimulated with TLR ligands. pDC from 3 different animals were sorted by FACS and stimulated with 10 μg/ml of PAM3Cys, 10 μg/ml poly I:C, 5 μg/ml gardiquimod, 5 μg/ml resiquimod, 5 μg/ml CpG ODN D32, or were left unstimulated as control. (A) Expression of selected type I interferon genes as log2 fold change between TLR ligand-stimulated pDC and control pDC. (B) Expression of selected cytokine and chemokine genes as log2 fold change between TLR ligand-stimulated pDC and control pDC. DESeq2 analysis * padj < 0.05, ** padj < 0.001, *** padj < 0.0001. For each gene, different letters represent statistical significance between two TLR-ligand stimulation groups as calculated by DESeq2 analysis.
Figure 4
Figure 4
Identification and phenotyping of tonsil and mandibular lymph node mononuclear phagocytes isolated from tonsils and lymph nodes. The top panel shows the gating strategy following multicolor FCM staining using antibodies against CD14, CD172a, CADM1, and CD4. After excluding doublets, cells high in FSC/SSC were gated, followed by gating on the CD14high population. Among the CD14 cells, cDC1 were gated as CD14 CD172a−/low CADM1+, cDC2 as CD14CD172a+CADM1+, and pDC as CD14CD172a+CADM1+CD4+. The cell-surface expression of CD123, CD205, CD115, wCD11R1, CD1, MHC II, CD80/86, CD207 and CD163 was assessed for cDC1, cDC2, pDC and monocytic cells. Histograms show staining for each of the sub-populations with the corresponding FMO control (gray histograms). Across tissues, the profiles displayed for a given marker were obtained from the same animal and are representative of three independent experiments using three different animals. “na” no data available due to low number of cells.
Figure 5
Figure 5
Comparison of transcription profiles of mononuclear phagocytes isolated from tonsils and LN (cDC1, cDC2, pDC, CD14high) with their blood counterparts (cDC1, cDC2, pDC, monocytes) as well as with monocyte-derived macrophages (MDM) at homeostasis. Cells isolated from porcine tonsils or lymph nodes were sorted by FACS and their RNA was sequenced. (A) Plot of the first 2 axes from a principal component analysis (PCA) based on the 500 most variable genes. For each compartment (blood, tonsils, lymph nodes), data were obtained from three different animals. (B) Each cell-type specific signature was compared to all signatures of subsets from a second tissue and a similarity score was calculated. To assess the statistical significance of the similarity scores, the observed values were compared to a null distribution obtained by reshuffling the genes. *** = empirical p-value < 0.001.
Figure 6
Figure 6
Transcription profiles of LN mononuclear phagocytes after infection with a highly virulent (Eystrup) or a low virulent (PdR) strain of CSFV. cDC1, cDC2, pDC, and CD14high populations were isolated from mandibular and retropharyngeal LN of animals either infected with Eystrup, PdR or left uninfected at 42 h p.i. and their transcriptome was sequenced by RNA-Seq. (A) Number of significantly regulated genes (padj < 0.05 in DESeq2 analysis) when comparing cell subsets from Eystrup-infected animals and PdR-infected animals to their counterparts from uninfected animals or comparing subsets between Eystrup- and PdR-infected animals. (B) Significantly modulated expression of chemokine and cytokine receptor genes displayed as log2 fold change between Eystrup-infected (solid columns) or PdR-infected (dashed columns) and control animals. (C) Significantly modulated expression of genes related to antigen presentation and apoptosis. DESeq2 analysis * padj < 0.05, ** padj < 0.001, *** padj < 0.0001. Red-colored asterisks indicate statistical significance (Padj < 0.05) between Eystrup- and PdR-infected animals for the same cell subset.
Figure 7
Figure 7
Transcription profiles of LN mononuclear phagocytes after infection with the highly virulent (Eystrup) or the low virulent (PdR) strain of CSFV. cDC1, cDC2, pDC, and CD14high populations were isolated from mandibular and retropharyngeal LN of animals infected with either Eystrup, PdR or left uninfected at 42 h p.i. and their transcriptome was sequenced by RNA-Seq. Expression is displayed as log2-fold change between Eystrup-infected (solid columns) or PdR-infected (dashed columns) and control animals. (A) Significantly modulated expression of chemokine and cytokine genes. (B) Significantly modulated expression of type I IFN genes. (C) Expression of selected interferon-stimulated genes. DESeq2 analysis * padj < 0.05, ** padj < 0.001, *** padj < 0.0001. red-colored asterisks indicate statistical significance (padj < 0.05) between Eystrup- and PdR-infected animals for the same subset.
Figure 8
Figure 8
Gene-set enrichment analysis of sorted DC and monocytic cells from lymph nodes using 86 selected gene sets that were derived from the BTM described by Li et al. (25). The normalized enrichment scores (NES) for all modules with a FDR < 0.05 are shown.

References

    1. Macri C, Pang ES, Patton T, O'Keeffe M. Dendritic cell subsets. Semin Cell Dev Biol. (2018) 84:11–21. 10.1016/j.semcdb.2017.12.009 - DOI - PubMed
    1. Worbs T, Hammerschmidt SI, Förster R. Dendritic cell migration in health and disease. Nat Rev Immunol. (2017) 17:30–48. 10.1038/nri.2016.116 - DOI - PubMed
    1. Auray G, Keller I, Python S, Gerber M, Bruggmann R, Ruggli N, et al. Summerfield: characterization and transcriptomic analysis of porcine blood conventional and plasmacytoid dendritic cells reveals striking species-specific differences. J Immunol. (2016) 197:4791–806. 10.4049/jimmunol.1600672 - DOI - PubMed
    1. Luber CA, Cox J, Lauterbach H, Fancke B, Selbach M, Tschopp J, et al. Quantitative proteomics reveals subset-specific viral recognition in dendritic cells. Immunity. (2010) 32:279–89. 10.1016/j.immuni.2010.01.013 - DOI - PubMed
    1. Yamazaki C, Miyamoto R, Hoshino K, Fukuda Y, Sasaki I, Saito M, et al. Conservation of a chemokine system, XCR1 and its ligand, XCL1, between human and mice. Biochem Biophys Res Commun. (2010) 397:756–61. 10.1016/j.bbrc.2010.06.029 - DOI - PubMed

Publication types

MeSH terms