. 2020 Jul 7:11:813.
doi: 10.3389/fpls.2020.00813. eCollection 2020.

Single Nucleotide Polymorphism Charting of P. patens Reveals Accumulation of Somatic Mutations During in vitro Culture on the Scale of Natural Variation by Selfing

Affiliations

Single Nucleotide Polymorphism Charting of P. patens Reveals Accumulation of Somatic Mutations During in vitro Culture on the Scale of Natural Variation by Selfing

Fabian B Haas et al. Front Plant Sci. .

Abstract

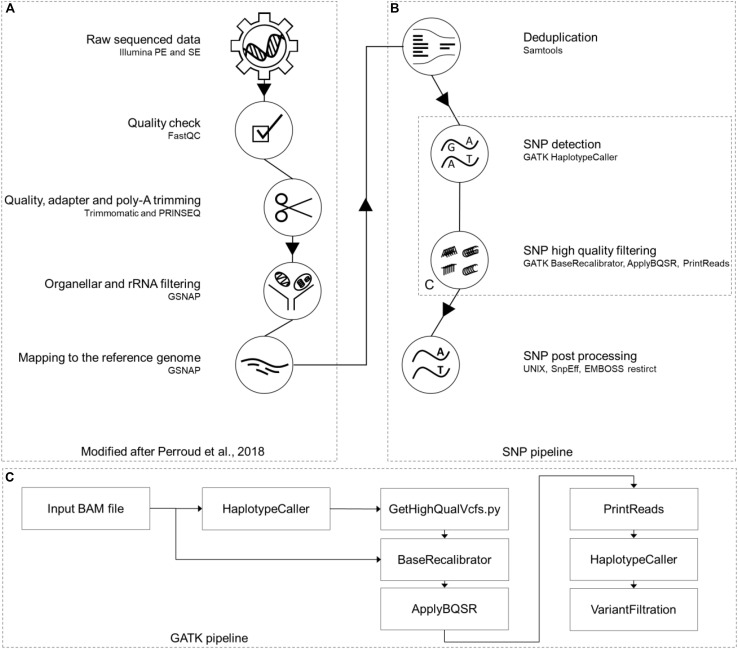
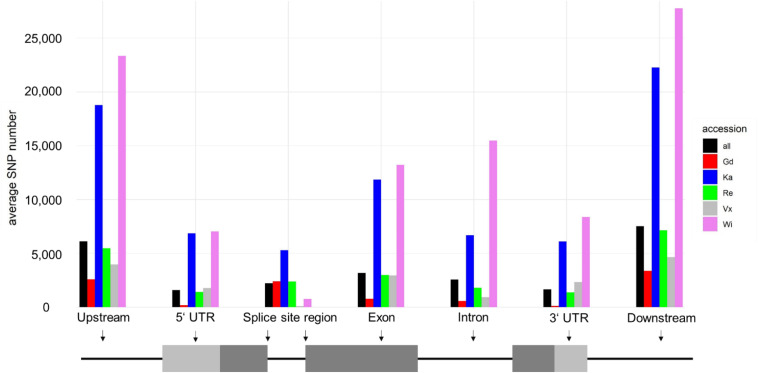
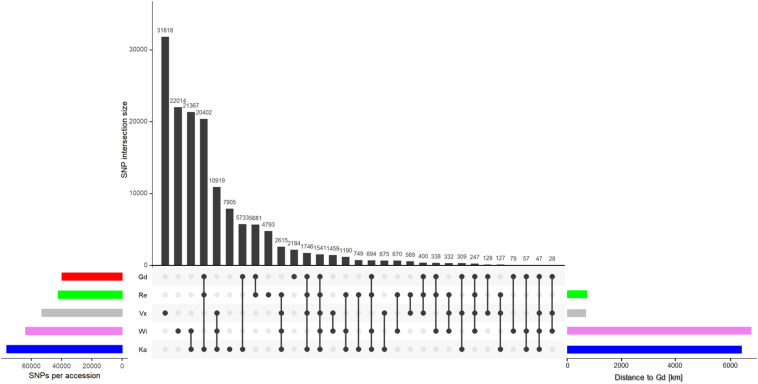
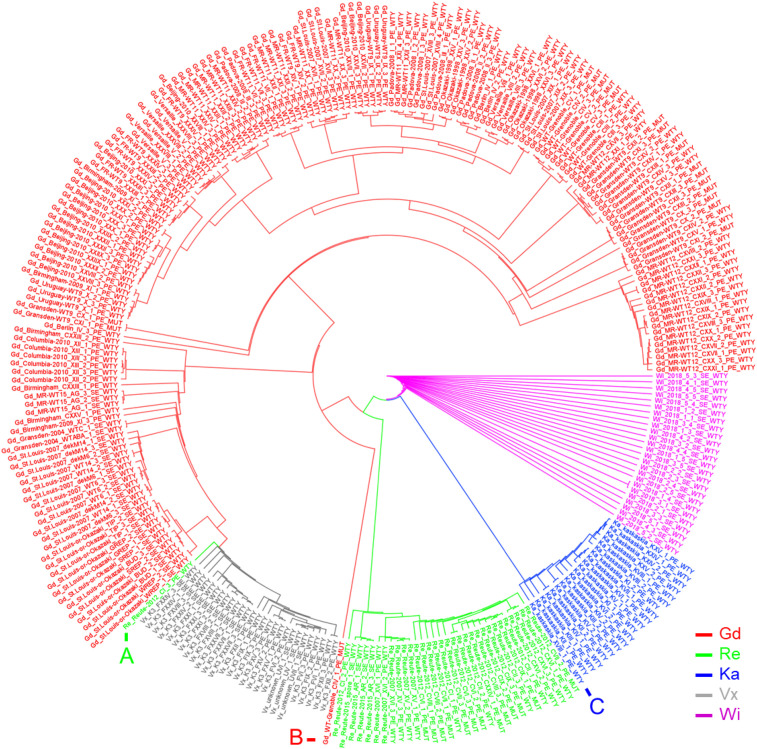
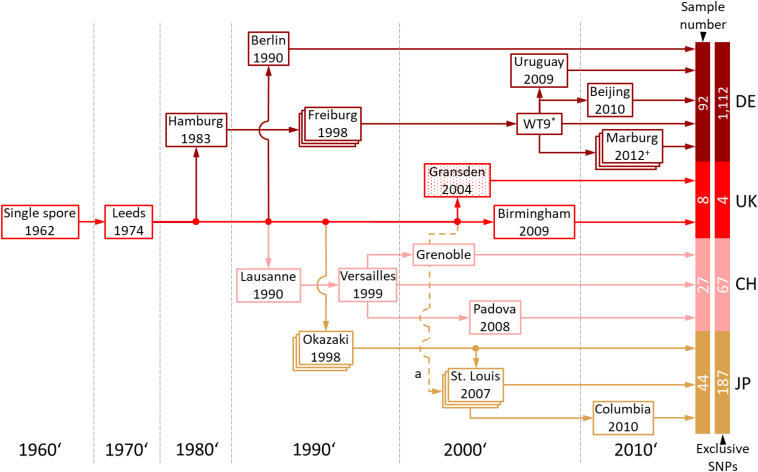
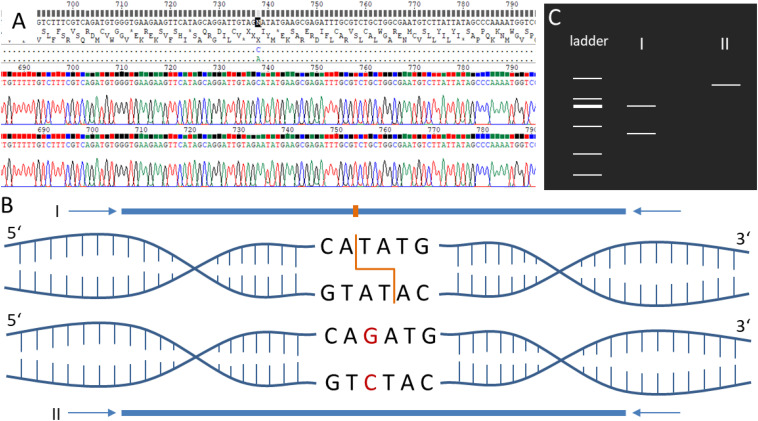
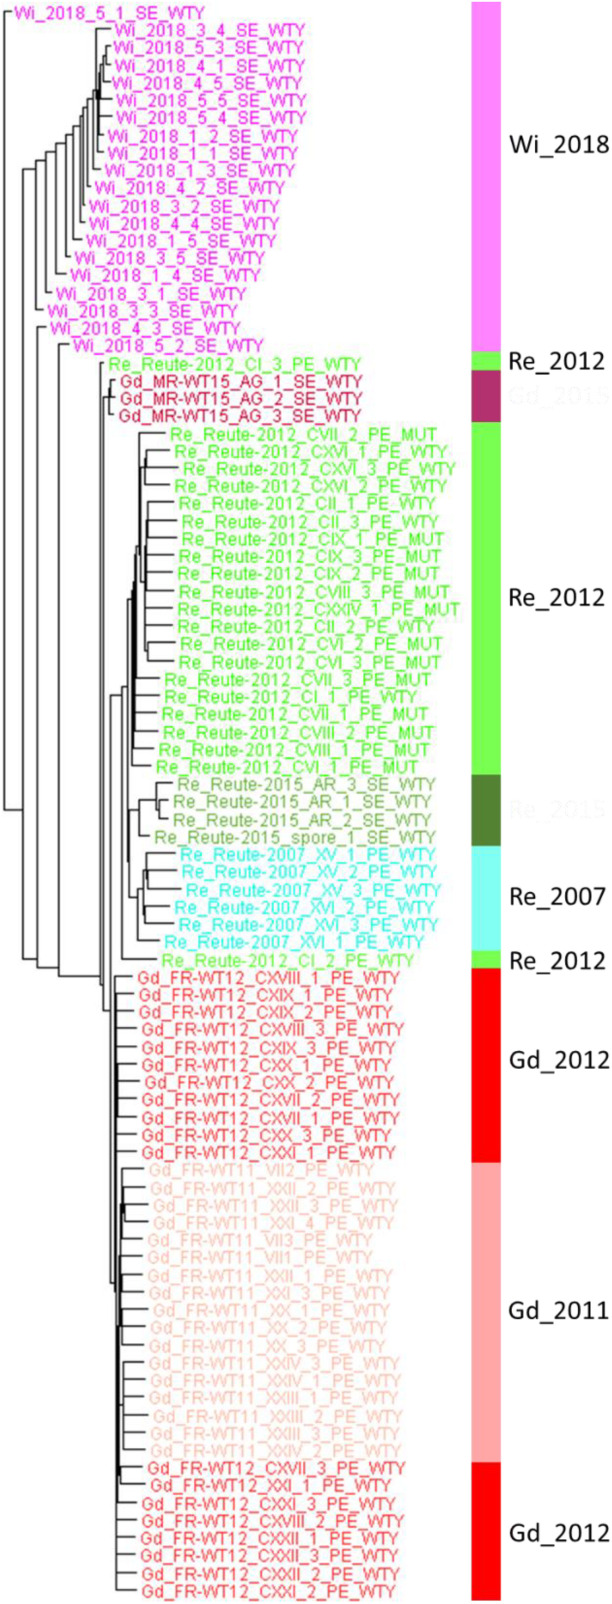
Introduction: Physcomitrium patens (Hedw.) Mitten (previously known as Physcomitrella patens) was collected by H.L.K. Whitehouse in Gransden Wood (Huntingdonshire, United Kingdom) in 1962 and distributed across the globe starting in 1974. Hence, the Gransden accession has been cultured in vitro in laboratories for half a century. Today, there are more than 13 different pedigrees derived from the original accession. Additionally, accessions from other sites worldwide were collected during the last decades. Methods and Results: In this study, 250 high throughput RNA sequencing (RNA-seq) samples and 25 gDNA samples were used to detect single nucleotide polymorphisms (SNPs). Analyses were performed using five different P. patens accessions and 13 different Gransden pedigrees. SNPs were overlaid with metadata and known phenotypic variations. Unique SNPs defining Gransden pedigrees and accessions were identified and experimentally confirmed. They can be successfully employed for PCR-based identification. Conclusion: We show independent mutations in different Gransden laboratory pedigrees, demonstrating that somatic mutations occur and accumulate during in vitro culture. The frequency of such mutations is similar to those observed in naturally occurring populations. We present evidence that vegetative propagation leads to accumulation of deleterious mutations, and that sexual reproduction purges those. Unique SNP sets for five different P. patens accessions were isolated and can be used to determine individual accessions as well as Gransden pedigrees. Based on that, laboratory methods to easily determine P. patens accessions and Gransden pedigrees are presented.

Keywords: Gransden; Physcomitrella patens; Physcomitrium; RFLP; RNA-seq; Reute; SNP; ecotype.


Figures

FIGURE 1
FIGURE 1
RNA-seq SNP calling pipeline. Part (A) of this pipeline was previously published (Perroud et al., 2018). The additional SNP calling branch (B) on the right side starts with removing read duplications, using Samtools package “markdup” and continues with the GATK toolbox for SNP calling (C). The last steps of this pipeline are post processing steps like SnpEff and EMBOSS restrict together with UNIX shell scripts. This figure has been modified based on a figure published in The Plant Journal (Perroud et al., 2018; https://onlinelibrary.wiley.com/doi/full/10.1111/tpj.13940).
FIGURE 2
FIGURE 2
Average snpEff output for each accession. Shown are average numbers of SNPs affecting specific regions, highlighted in a schematic gene structure shown below the corresponding grouped columns. Most SNPs are up- and downstream of genes (intergenic). SNPs at splice site regions are intron SNPs, located on the first and last two intron base pairs.
FIGURE 3
FIGURE 3
SNP intersection of the five accessions. The horizontal colored bars on the left show the total number of SNPs per accession after applying all three filter steps. The bars to the right show the geographic distance to the reference Gd. The colors represent the five accessions throughout the text. The vertical black bars show the number of intersecting SNPs, marked by the dots below.
FIGURE 4
FIGURE 4
Circularized SplitsTree network based on an artificial FASTA SNP alignment file. The Neighbor-Joining tree of five P. patens accessions is shown. All libraries cluster within their accession and applied treatment, except for the marked libraries: (A) Sample Re_REUTE-2012_CI_3 has 100 x lower read coverage than the other Re samples. It clusters next to the low read coverage Vx samples. (B) Sample Gd_WT-Grenoble_CIV_1 is a Gd outgroup. (C) Ka sample which was falsely annotated as Gd at the NCBI SRA (XVIII_1_PE_WTY), determined by exclusive SNP analysis (Supplementary File 3, Sheet Ka_exclusive_SNPs).
FIGURE 5
FIGURE 5
Gransden pedigree. The pedigree diagram shows Gransden strains of 13 different labs used in the present study. The Gransden accession was arranged in four different pedigrees, Germany (DE), United Kingdom (UK), Switzerland (CH) and Japan (JP). The United Kingdom pedigree was sent to St. Louis, United States in 2004 and used to sequence the reference genome (a). However, this strain was not used or broadly distributed afterwards. The plants analyzed in St. Louis are derived from the Japan pedigree (2007). Pedigrees shown in stacked boxes went through yearly selfing. + Since 2011 yearly selfing except 2013. * Since 1999 Gransden Freiburg went through nine generations leading to WT9. The numbers of samples and exclusive SNPs for each of the four pedigrees are shown to the right (also shown in Supplementary Figure S11).
FIGURE 6
FIGURE 6
Schematic visualization of the restriction fragment length polymorphism (RFLP) analysis. (A) Electropherogram of the sequenced amplicons generated via PCR using forward and reverse primers. (B) PCR amplicons of the samples I and II covering the same genomic position in two different P. patens accessions. Sample I sequence includes a restriction enzyme site for NdeI (orange). Sample II contains a single nucleotide polymorphism (SNP, red) resulting in the loss of the restriction enzyme site. (C) If amplicons are digested via the corresponding restriction enzyme NdeI, sample I results in two bands when separated via gel electrophoresis, whereas sample II results in one band. See Supplementary Figures S13–S15 for experimental verification of the accession-specific RFLP regions.
FIGURE 7
FIGURE 7
Splitstree tree of Wisconsin natural population and three generations of Gd and Re. The tree is based on part of the artificial SNP FASTA alignment containing Wi samples (without the bacterial contaminated spore capsule experiment 2) and three generations of Re (2007, 2012 and 2015) and Gd (2011, 2012 and 2015). The Splitstree network tree was branch length-corrected by the maximum number of covered base pairs (see coverage normalization in section “Materials and Methods”).

References

    1. Ashton N. W., Cove D. J. (1977). The isolation and preliminary characterisation of auxotrophic and analogue resistant mutants of the moss, Physcomitrella patens. Mol. Gen. Genet. 154 87–95. 10.1007/bf00265581 - DOI
    1. Ashton N. W., Raju M. V. S. (2000). The distribution of gametangia on gametophores of Physcomitrella (Aphanoregma) patens in culture. J. Bryol. 22 9–12. 10.1179/jbr.2000.22.1.9 - DOI
    1. Beike A. K., von Stackelberg M., Schallenberg-Rüdinger M., Hanke S. T., Follo M., Quandt D., et al. (2014). Molecular evidence for convergent evolution and allopolyploid speciation within the Physcomitrium-Physcomitrellaspecies complex. BMC Evol. Biol. 14:158. 10.1186/1471-2148-14-158 - DOI - PMC - PubMed
    1. Benjamini Y., Hochberg Y. (1995). Controlling the false discovery rate: a practical and powerful approach to multiple testing. J. R. Stat. Soc. Ser. B (Methodological). 57 289–300. 10.1111/j.2517-6161.1995.tb02031.x - DOI
    1. Bolger A. M., Lohse M., Usadel B. (2014). Trimmomatic: a flexible trimmer for Illumina sequence data. Bioinformatics (Oxford, England). 30 2114–2120. 10.1093/bioinformatics/btu170 - DOI - PMC - PubMed

LinkOut - more resources