. 2020 Jul 8:10:979.
doi: 10.3389/fonc.2020.00979. eCollection 2020.

High Expression of FAP in Colorectal Cancer Is Associated With Angiogenesis and Immunoregulation Processes

Affiliations

High Expression of FAP in Colorectal Cancer Is Associated With Angiogenesis and Immunoregulation Processes

Mairene Coto-Llerena et al. Front Oncol. .

Abstract

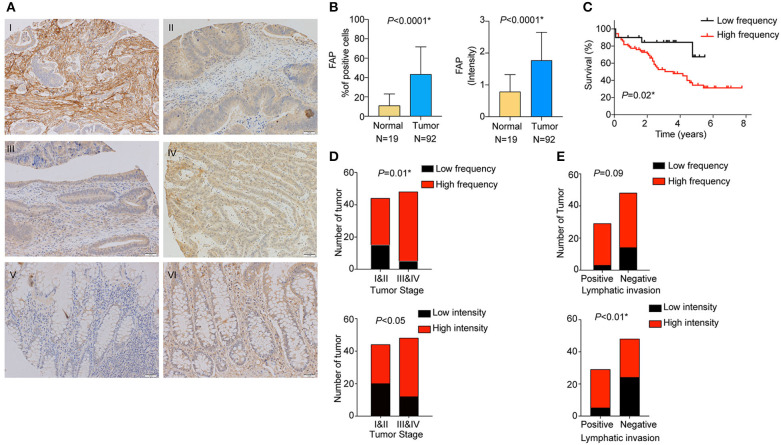
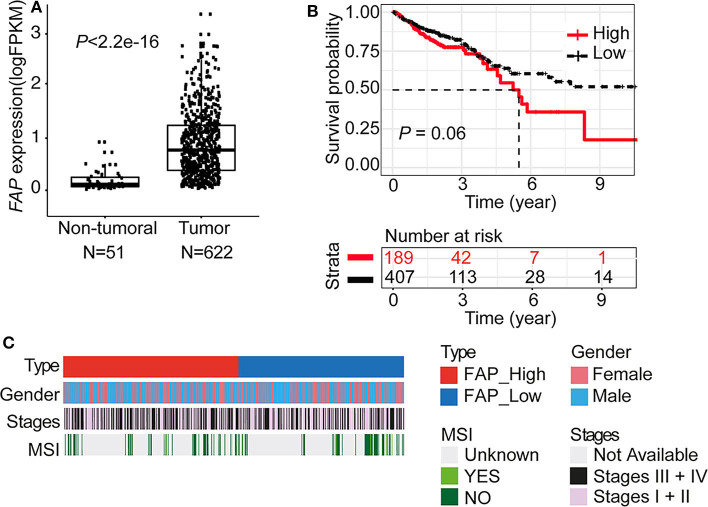
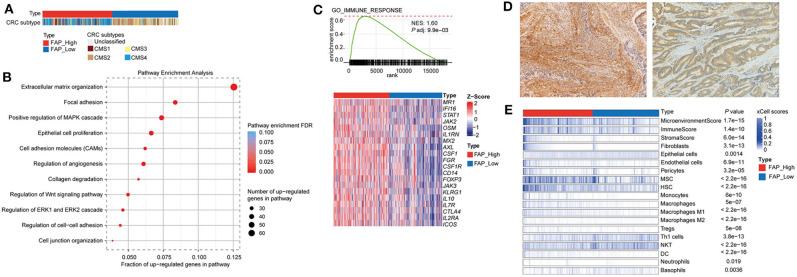
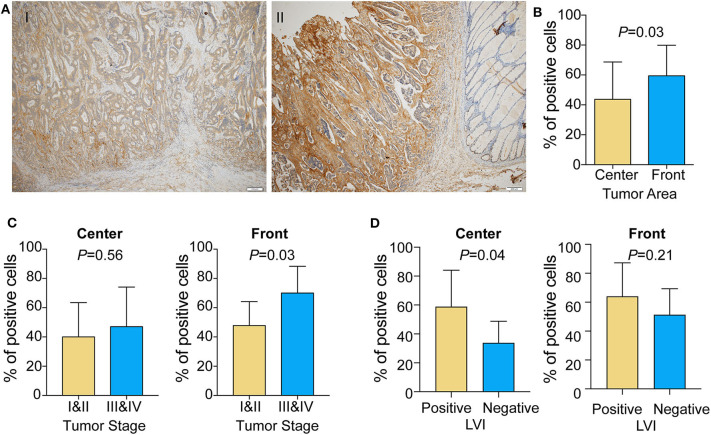
Fibroblast activation protein α (FAP) plays an important role in tissue remodeling and helps tumor cells invade surrounding tissue. We sought to investigate FAP as a prognostic molecular marker in colorectal cancer (CRC) using immunohistochemical and transcriptomic data. FAP expression and clinicopathological information were obtained from The Cancer Genome Atlas data set. The association of FAP expression and tissue cellular heterogeneity landscape was explored using the xCell method. We evaluated FAP protein expression in a cohort of 92 CRCs and 19 non-tumoral tissues. We observed that FAP was upregulated in tumors both at the mRNA and protein levels, and its expression was associated with advanced stages, poor survival, and consensus molecular subtype 4. FAP expression was also associated with angiogenesis and collagen degradation. We observed an enrichment in immune-cell process-related genes associated with FAP overexpression. Colorectal cancers with high FAP expression display an inflamed phenotype enriched for macrophages and monocytes. Those tumors showed enrichment for regulatory T cell populations and depletion of TH1 and natural killer T cells, pointing to an immunosuppressive environment. Colorectal cancers with high levels of stromal FAP are associated with aggressive disease progression and survival. Our results suggest that FAP plays additional roles in tumor progression such as modulation of angiogenesis and immunoregulation in the tumor microenvironment.

Keywords: FAP; cancer-associated fibroblast; colorectal cancer; gene expression; immunohistochemistry.


Figures

Figure 1
Figure 1
FAP protein is overexpressed in CRC and is associated with worse overall survival. (A) Representative examples of FAP expression by immunohistochemistry. FAP expression in (I) high percentage of tumor-associated stromal cells (100%); (II) tumor-associated stroma with low number of positive cells (5%); (III) normal tissue showing negative staining for FAP; (IV) FAP high-intensity staining in tumor-associated stromal cells (high); (V) FAP low-intensity staining in tumor-associated stromal cells (low); and (VI) normal tissue showing FAP high-intensity staining in stroma cells. Scale bar: 50 μm. (B) Percentage of cells showing positive FAP staining in normal stroma and tumor-associated stroma (above). Scoring of FAP staining based on intensity in normal and tumor-associated stroma (below). (C) Overall survival analysis (Kaplan–Meier) of CRC patients from the TMA cohort after stratification for high and low percentage of FAP-positive cells. Number of CRCs with high and low percentages of FAP-positive cells (above), as well as high and low FAP intensity (below) in (D) early and advanced tumor stages, and (E) positive and negative lymphatic invasion. Statistical analyses were performed using Fisher exact test for categorical variables, Mann–Whitney U-test for numeric variables and log-rank (Mantel–Cox) test for survival analysis. All tests were two-sided, and p < 0.05 was considered statistically significant. Data in (B) are represented as mean ± SD. *Statistical power >70%.
Figure 2
Figure 2
FAP is upregulated in colorectal tumors. (A) FAP expression level in tumors (n = 622) compared to non-tumoral tissue (n = 51) in the TCGA data set. (B) Overall survival analysis (Kaplan–Meier) of CRC patients from the TCGA data set stratified by FAP expression (see also Supplementary Figure 2). (C) Colorectal cancer patient characteristics grouped by FAP expression. Statistical comparisons of clinical and molecular parameters between tumors with high vs. low FAP expression are shown in Table 2. Statistical comparisons were performed Mann–Whitney U-test in (A) and by log-rank test in (B).
Figure 3
Figure 3
FAP is associated with pathways involved in tumor growth, invasion, and immunosuppressive tumor microenvironment. (A) Colorectal cancers grouped by FAP expression. Statistical comparison of molecular subtypes between tumors with high vs. low FAP expression are shown in Table 2. (B) Figure shows selected significantly enriched pathways from pathway enrichment analysis of the upregulated genes from a differential expression analysis between FAP-high vs. FAP-low. The size of the dots indicates the number of upregulated genes in each pathway. The color of the dot indicates FDR, and x axis represents the fraction of upregulated genes in the pathway. (C) Gene set enrichment analysis plots of GO immune response, where x axis shows ranked list of genes (ranked by the p-values signed according to the direction of the differential expression analysis between FAP-high and FAP-low CRCs), and the vertical bars on the x axis show the genes that belong to gene set. The y axis shows the enrichment score of the gene set. Heatmaps below show selected genes in the GO process. (D) Representative pictures showing the enrichment of fibroblast on high FAP expression (left) and low number of fibroblasts on low FAP expression (right). (E) Heatmap shows the enrichment of immune and stromal cell types in the TCGA CRC cohort, as defined by the xCell method. Samples were stratified into FAP-high and FAP-low groups and then sorted based on their xCell fibroblasts scores. Cell types that showed statistically significant difference between FAP-high and FAP-low groups are shown. Statistical comparisons were performed using Mann–Whitney U-tests.
Figure 4
Figure 4
FAP expression is enriched in the tumor front area in colorectal tumor. (A) Representative micrographs of FAP distribution in the tumor center and at the tumor front area. (I) FAP expression is higher at the tumor front compared to the tumor center; (II) FAP expression does not show significant difference between tumor center and tumor front, whereas neighbor non-neoplastic colonic mucosal stroma is completely negative. Scale bar: 200 μm. (B) Percentage of cells showing FAP-positive staining in the tumor front and tumor center areas (n = 19). (C) Percentage of cells showing FAP-positive staining in tumor center (left) and front (right) in early and advanced tumor stage. (D) Percentage of cells showing FAP-positive staining in tumor center (left) and front (right) with lymphovascular invasion. Statistical analyses were performed using Fisher exact tests for categorical variables and Mann–Whitney U-tests for numeric variables. All tests were two-sided, and p < 0.05 was considered statistically significant. Data in (B–D) are represented as mean ± SD.

References

    1. Galon J, Mlecnik B, Bindea G, Angell HK, Berger A, Lagorce C, et al. . Towards the introduction of the Immunoscore in the classification of malignant tumours. J Pathol. (2014) 232:199–209. 10.1002/path.4287 - DOI - PMC - PubMed
    1. Park JH, Richards CH, McMillan DC, Horgan PG, Roxburgh CSD. The relationship between tumour stroma percentage, the tumour microenvironment and survival in patients with primary operable colorectal cancer. Ann Oncol. (2014) 25:644–51. 10.1093/annonc/mdt593 - DOI - PMC - PubMed
    1. Eriksen AC, Sørensen FB, Lindebjerg J, Hager H, Christensen RD, Kjær-Frifeldt S, et al. . The prognostic value of tumour stroma ratio and tumour budding in stage II colon cancer. A nationwide population-based study Int J Colorectal Dis. (2018) 33:1115–24. 10.1007/s00384-018-3076-9 - DOI - PMC - PubMed
    1. Kuzet S-E, Gaggioli C. Fibroblast activation in cancer: when seed fertilizes soil. Cell Tissue Res. (2016) 365:607–19. 10.1007/s00441-016-2467-x - DOI - PubMed
    1. Koliaraki V, Pallangyo CK, Greten FR, Kollias G. Mesenchymal cells in colon cancer. Gastroenterology. (2017) 152:964–79. 10.1053/j.gastro.2016.11.049 - DOI - PubMed