. 2020 Jul 7:10:1094.
doi: 10.3389/fonc.2020.01094. eCollection 2020.

Angustoline Inhibited Esophageal Tumors Through Regulating LKB1/AMPK/ELAVL1/LPACT2 Pathway and Phospholipid Remodeling

Affiliations

Angustoline Inhibited Esophageal Tumors Through Regulating LKB1/AMPK/ELAVL1/LPACT2 Pathway and Phospholipid Remodeling

Huiying Li et al. Front Oncol. .

Abstract

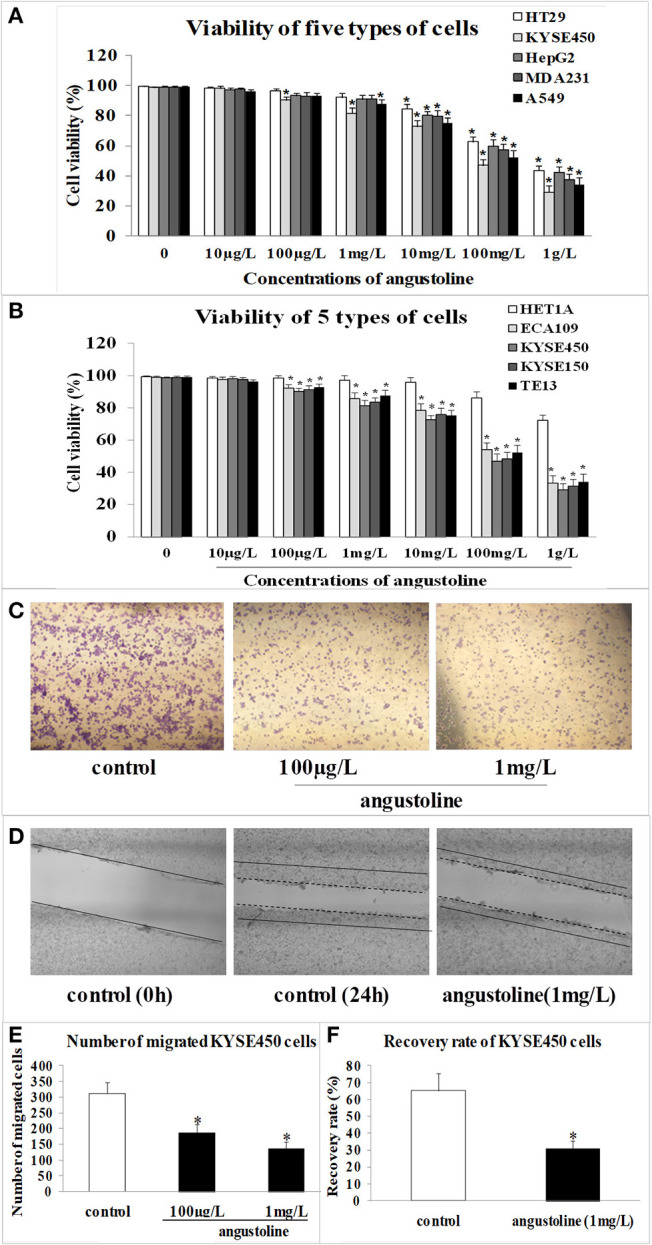
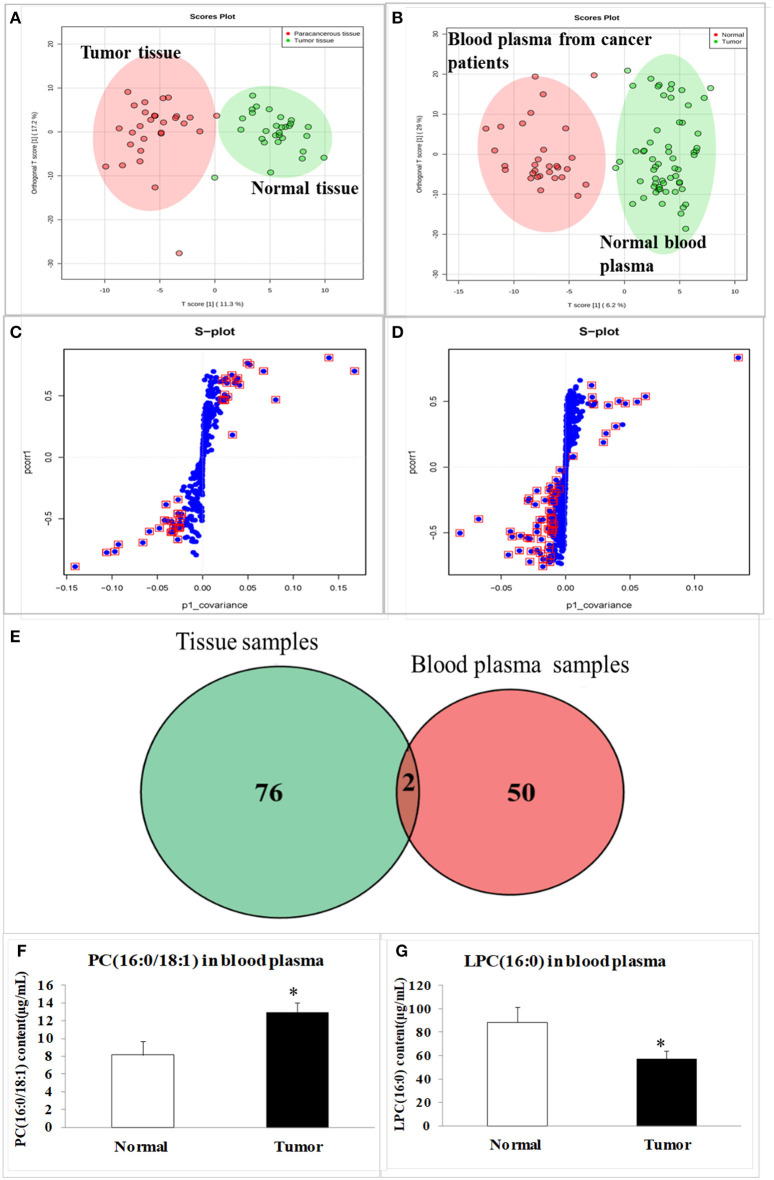
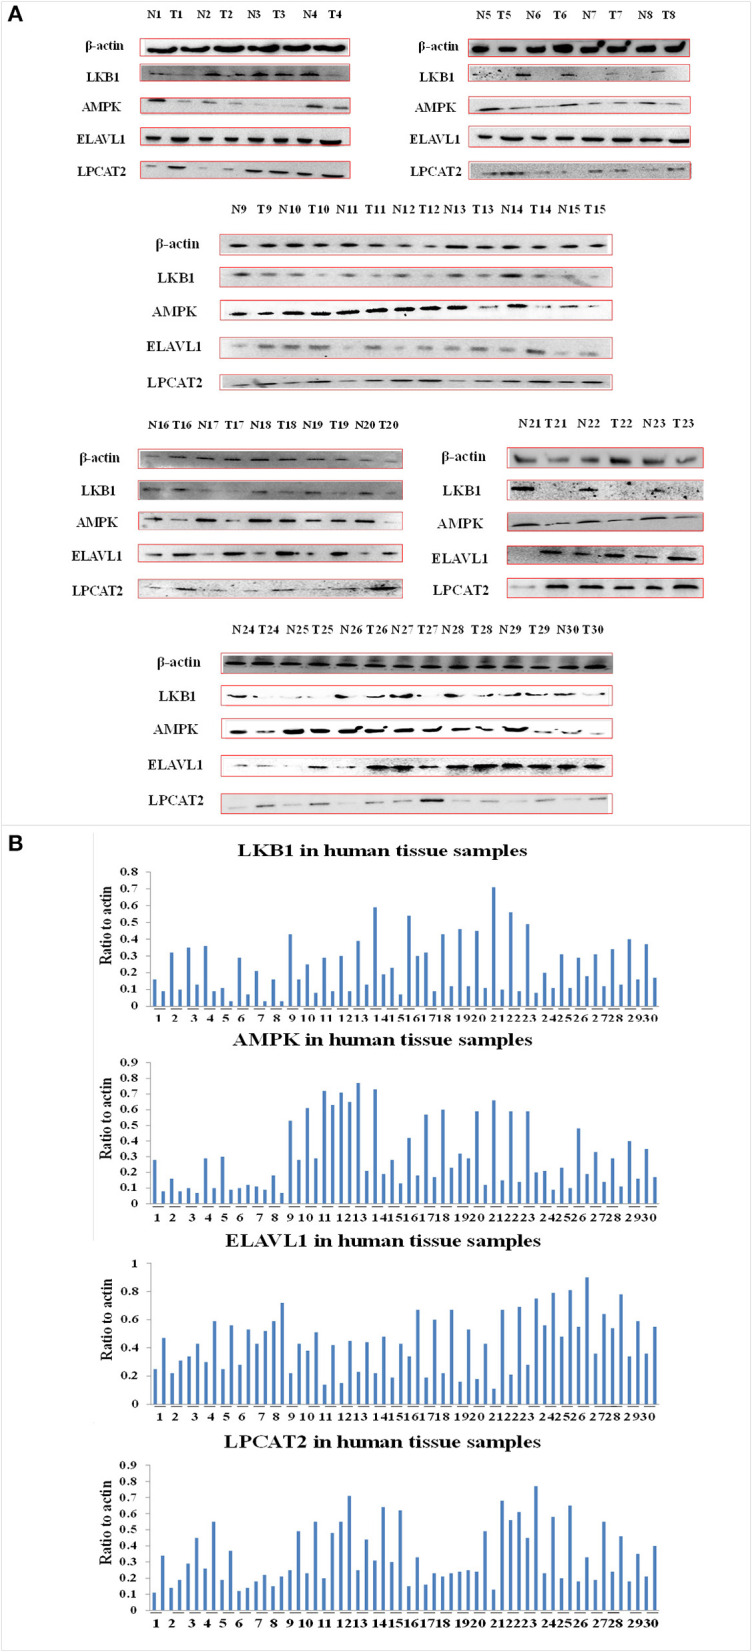
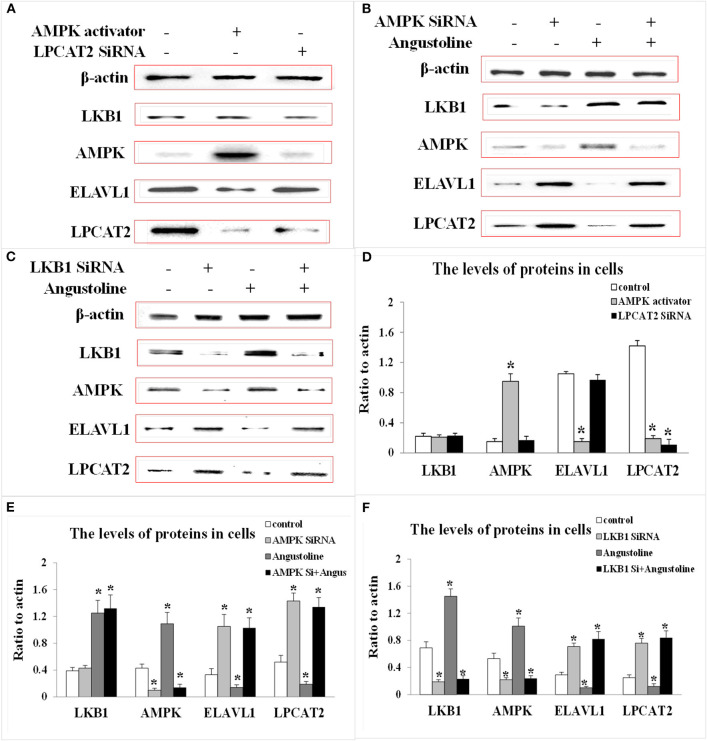
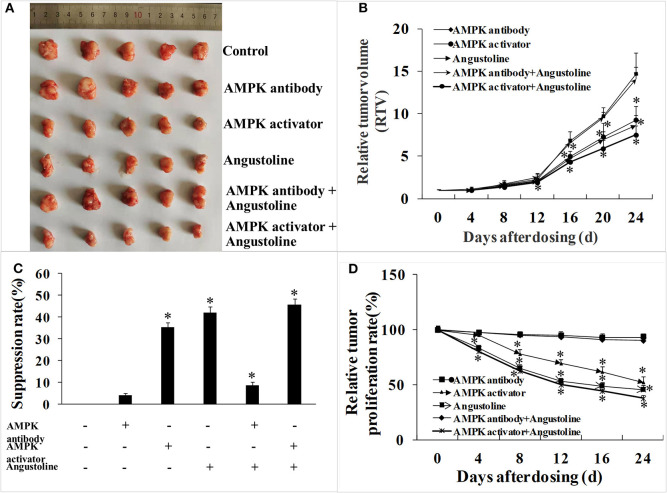
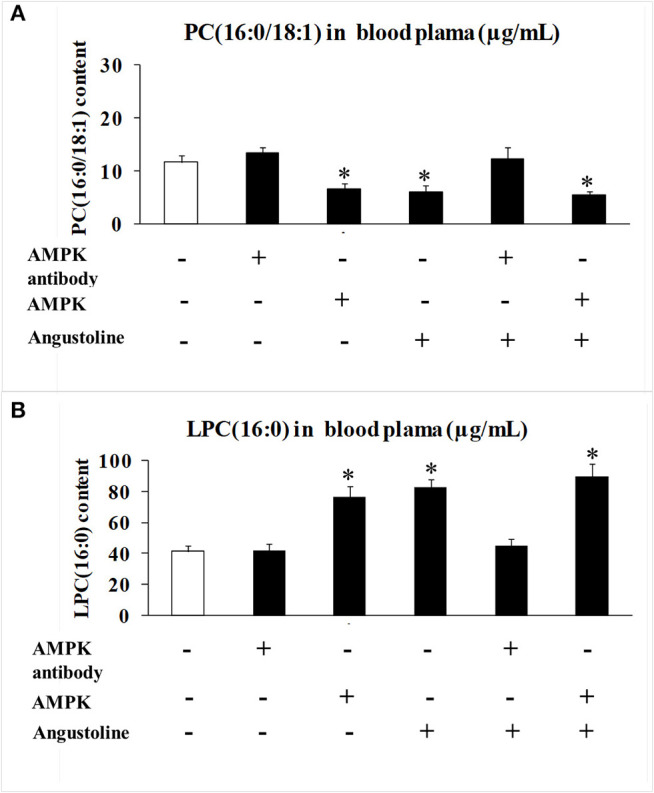
Esophageal cancer is a type of gastrointestinal carcinoma and is among the 10 most common causes of cancer death worldwide. However, the specific mechanism and the biomarkers in the proliferation and metastasis of esophageal tumors are still unclear. Therefore, the development of several natural products which could inhibit esophageal tumors deserve attention. In the present study, different sources of cancer cells were used to select the sensitive cell line (esophageal cancer cell KYSE450) and the proper dose of angustoline, which were utilized in the following cell viability, migration and invasion assays. Then the lipidomic detection of clinical samples (tissue and blood plasma) from esophageal cancer patients was performed, to screen out the specific phospholipid metabolites [PC (16:0/18:1) and LPC (16:0)]. Considering lysophosphatidylcholine acyltransferase 2 (LPCAT2) was tightly relative with phospholipids conversion, serine/threonine-protein kinase 11 (LKB1), 5'-monophosphate (AMP)-activated protein kinase (AMPK) and embryonic lethal, and abnormal vision, drosophila-like 1 (ELAVL1) were investigated, to evaluate their expression levels in esophageal tumor tissue and KYSE450 cells. Additionally, KYSE450 tumor bearing mouse model was constructed, the role of angustoline in inhibiting esophageal tumors through regulating LKB1/AMPK/ELAVL1/LPCAT2 pathway was validated, and found that the conversion from LPC (16:0) to PC (16:0/18:1) was blocked by angustoline in some degree. The above results for the first time proved that angustoline suppressed esophageal tumors through activating LKB1/AMPK and inhibiting ELAVL1/LPCAT2, which consequently blocked phospholipid remodeling from LPC (16:0) to PC (16:0/18:1).

Keywords: AMPK; ELAVL1; LKB1; LPCAT2; esophageal cancer; lipidomics.


Figures

Figure 1
Figure 1
The effect of angustoline on the viability, migration and invasion of KYSE450 cells. (A) The viabilities of HT29 cells, KYSE450 cells, HepG2 cells, MDA231 cells, and A549 cells. (B) The viabilities of esophageal epithelial cells (HET1A), as well as several esophageal tumor cells, including, ECA109, KYSE450, KYSE150, and TE13. (C) The migration rate of KYSE450 cells in transwell assay. (D) The recovery rate of KYSE450 cells in scratch analysis assay. (E) Statistical analysis of the migrated cells. (F) Statistical analysis of the recovery rate. The data were represented as mean ± SD, n = 3. *p < 0.05, compared with the control. The photograghs were captured under 100 × magnification.
Figure 2
Figure 2
The scores plot and s-plot in clinical tissue samples and blood plasma samples, and the contents of special lipid metabolites in blood plasma samples. (A) The scores in tumor tissue and normal tissue from esophageal cancer patients; (B) The scores in blood plasma of esophageal patients and healthy volunteers; (C) The s-plot in tumor tissue and normal tissue; (D) The s-plot in blood plasma of esophageal patients and healthy volunteers; (E) The overlapped metabolites between tissue samples and blood plasma samples; (F) PC (16:0/18:1) content in blood plasma samples; (G) LPC (16:0) content in blood plasma samples. The data were represented as mean ± SD. In (A–G), the total number (n) in tissue group or blood plasma group is 60, 30 normal samples, and 30 esophageal cancer patients samples, respectively. The data were represented as mean ± SD, *p < 0.05, compared with the control. n = 3.
Figure 3
Figure 3
The levels of LKB1, AMPK, ELAVL1, LPCAT2, and β-actin proteins. (A) Expression of these proteins in 30 normal tissue samples and 30 esophageal cancer tissue samples. (B) Densitometric quantitations for normalized proteins relative to β-actin (%) in (A).
Figure 4
Figure 4
The levels of LKB1, AMPK, ELAVL1, LPCAT2, and β-actin proteins. (A) Expression of these proteins in KYSE-450 cells treated with AMPK activator or LPCAT2 siRNA fragment. (B) Expression of these proteins in KYSE-450 cells treated with AMPK siRNA or angustoline. (C) Expression of these proteins in KYSE-450 cells treated with LKB1 siRNA or angustoline. (D) Densitometric quantitations for normalized proteins relative to β-actin (%) in (A). (E) Densitometric quantitations for normalized proteins relative to β-actin (%) in (B). (F) Densitometric quantitations for normalized proteins relative to β-actin (%) in (C). The data were represented as mean ± SD, *p < 0.05, compared with the control. n = 3.
Figure 5
Figure 5
In vivo effects of AMPK activator/AMPK antibody/Angustoline on KYSE450 tumor-bearing nude mice. (A) Treatment of AMPK antibody/AMPK activator/Angustoline/(AMPK antibody + Angustoline)/(AMPK activator + Angustoline) on the size of KYSE450 tumors. (B) Relative tumor volume, which was calculated by each tumor volume. *p < 0.05, comparing with the control, n = 5. (C) Tumor suppression rate, which was calculated by each tumor weight. *p < 0.05, comparing with the control, n = 5. (D) Relative tumor proliferation rate, which was calculated by relative tumor volumes of different groups. *p < 0.05, comparing with the control, n = 5.
Figure 6
Figure 6
PC (16:0/18:1) and LPC (16:0) content detected by HPLC MS/MS analysis in mice blood plasma. (A) PC (16:0/18:1) content in mice blood plasma samples; (B) LPC (16:0) content in mice blood plasma samples. The data were represented as mean ± SD (n = 5). *p < 0.05, comparing with the control.

References

    1. Refere Bray F, Ferlay J, Soerjomataram I, Siegel RL, Torre LA, Jemal A. Global cancer statistics 2018: GLOBOCAN estimates of incidence and mortality worldwide for 36 cancers in 185 countries. CA Cancer J Clin. (2018) 68:394–424. 10.3322/caac.21492 - DOI - PubMed
    1. Thomas NS, Laura MS. Cancer as a metabolic disease. Nutr Metab. (2010) 7:1–12. 10.1186/1743-7075-7-7 - DOI - PMC - PubMed
    1. Perrotti F, Rosa C, Cicalini I, Sacchetta P, Del Boccio P, Genovesi D, et al. . Advances in lipidomics for cancer biomarkers discovery. Int J Mol Sci. (2016) 17:1992. 10.3390/ijms17121992 - DOI - PMC - PubMed
    1. Wang L, Liu X, Yang Q. Application of metabolomics in cancer research: as a powerful tool to screen biomarker for diagnosis, monitoring and prognosis of cancer. Biomarkers J. (2018) 4:12 10.21767/2472-1646.100050 - DOI
    1. Zhang H, Wang L, Hou Z, Ma H, Mamtimin B, Hasim A, et al. . Metabolomic profiling reveals potential biomarkers in esophageal cancer progression using liquid chromatography-mass spectrometry platform. Biochem Biophys Res Commun. (2017) 491:119–25. 10.1016/j.bbrc.2017.07.060 - DOI - PubMed