. 2020 Apr 11;3(2):252-260.
doi: 10.1093/jamiaopen/ooaa006. eCollection 2020 Jul.

Machine learning for early detection of sepsis: an internal and temporal validation study

Affiliations

Machine learning for early detection of sepsis: an internal and temporal validation study

Armando D Bedoya et al. JAMIA Open. .

Abstract

Objective: Determine if deep learning detects sepsis earlier and more accurately than other models. To evaluate model performance using implementation-oriented metrics that simulate clinical practice.

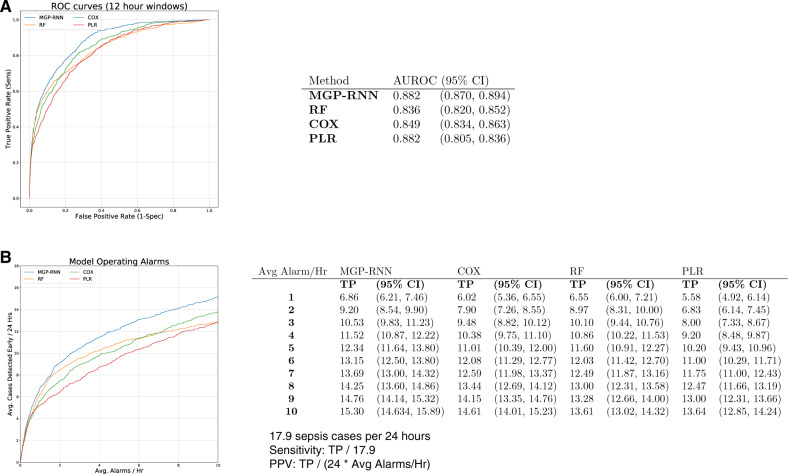
Materials and methods: We trained internally and temporally validated a deep learning model (multi-output Gaussian process and recurrent neural network [MGP-RNN]) to detect sepsis using encounters from adult hospitalized patients at a large tertiary academic center. Sepsis was defined as the presence of 2 or more systemic inflammatory response syndrome (SIRS) criteria, a blood culture order, and at least one element of end-organ failure. The training dataset included demographics, comorbidities, vital signs, medication administrations, and labs from October 1, 2014 to December 1, 2015, while the temporal validation dataset was from March 1, 2018 to August 31, 2018. Comparisons were made to 3 machine learning methods, random forest (RF), Cox regression (CR), and penalized logistic regression (PLR), and 3 clinical scores used to detect sepsis, SIRS, quick Sequential Organ Failure Assessment (qSOFA), and National Early Warning Score (NEWS). Traditional discrimination statistics such as the C-statistic as well as metrics aligned with operational implementation were assessed.

Results: The training set and internal validation included 42 979 encounters, while the temporal validation set included 39 786 encounters. The C-statistic for predicting sepsis within 4 h of onset was 0.88 for the MGP-RNN compared to 0.836 for RF, 0.849 for CR, 0.822 for PLR, 0.756 for SIRS, 0.619 for NEWS, and 0.481 for qSOFA. MGP-RNN detected sepsis a median of 5 h in advance. Temporal validation assessment continued to show the MGP-RNN outperform all 7 clinical risk score and machine learning comparisons.

Conclusions: We developed and validated a novel deep learning model to detect sepsis. Using our data elements and feature set, our modeling approach outperformed other machine learning methods and clinical scores.

Keywords: ROC curve; adult; clinical; decision; electronic health records/statistics and numerical data; emergency service; hospital/statistics and numerical data; hospitalization/statistics and numerical data; machine learning; retrospective studies; sepsis/mortality; support systems.


Figures

Figure 1.
Figure 1.
Results of our deep learning model compared with the clinical scores methods. (A) ROC curves for the MGP–RNN and the 3 clinical scores considered, SIRS, NEWS, and qSOFA is shown. The accompanying table lists C-statistics with bootstrap confidence intervals. (B) The average number of sepsis cases each day we expect to detect early before a definition for sepsis is met (ie, a more interpretable version of sensitivity), as a function of how many alarms each method would produce each hour is shown. We limit the average alarms per hour to less than 10, as this is the operating range at which we expect to use in practice. There were an average of 17.9 sepsis cases per 24-h period in the dataset, so sensitivity can be recovered by dividing the reported y-axis value in panel B by 17.9. Positive predictive value at a particular threshold can be recovered by dividing the reported y-axis value by 24 times the reported x-axis value (ie, the average number of alarms per 24-h period). MGP–RNN, multi-output Gaussian process and recurrent neural network; NEWS, national early warning score; QSOFA, quick Sequential Organ Failure Assessment; SIRS, systemic inflammatory response syndrome.
Figure 2.
Figure 2.
Results of our deep learning model compared with the other machine learning models. (A) ROC curves for the MGP–RNN and the 3 other machine learning models considered, Cox regression, penalized logistic regression, and random forest is shown. The accompanying table lists C-statistics with bootstrap confidence intervals. (B) The average number of sepsis cases each day we expect to detect early before a definition for sepsis is met (ie, a more interpretable version of sensitivity), as a function of how many alarms each method would produce each hour is shown. We limit the average alarms per hour to less than 10, as this is the operating range at which we expect to use in practice. There were an average of 17.9 sepsis cases per 24-h period in the dataset, so sensitivity can be recovered by dividing the reported y-axis value in panel B by 17.9. Positive predictive value at a particular threshold can be recovered by dividing the reported y-axis value by 24 times the reported x-axis value (ie, the average number of alarms per 24-h period). MGP–RNN, multi-output Gaussian process and recurrent neural network; PLR, penalized logistic regression; RF, random forest.
Figure 3.
Figure 3.
(A) Compares the AUROC obtained from the internal validation cohort with the AUROC from the temporal validation cohort for each method, along with bootstrap confidence intervals. (B) The AUROC as a function of hours after presentation to the ED for the temporal validation cohort for each method, limited to the first 24 h following initial presentation is shown. (C) The PPV at 75% sensitivity for each method as a function of number of hours after presentation to the ED is shown.
Figure 4.
Figure 4.
Results for the temporal validation cohort (analogous to Figures 1 and 2, which show results on the internal validation cohort.) (A) ROC curves and (B) the operating alarms are shown. There were an average of 14.4 sepsis cases per 24-h period in the dataset, so sensitivity can be recovered by dividing the reported y-axis value in panel B by 14.4. Positive predictive value at a particular threshold can be recovered by dividing the reported y-axis value by 24 times the reported x-axis value (ie, the average number of alarms per 24-h period).

References

    1. Liu V, Escobar GJ, Greene JD, et al. Hospital deaths in patients with sepsis from 2 independent cohorts. JAMA 2014; 312 (1): 90–2. - PubMed
    1. Rhee C, Dantes R, Epstein L, et al. ; for the CDC Prevention Epicenter Program. Incidence and trends of sepsis in US hospitals using clinical vs claims data, 2009-2014. JAMA 2017; 318 (13): 1241–9. - PMC - PubMed
    1. Epstein L, Dantes R, Magill S, Fiore A.. Varying estimates of sepsis mortality using death certificates and administrative codes—United States, 1999-2014. MMWR Morb Mortal Wkly Rep 2016; 65 (13): 342–5. - PubMed
    1. Levy MM, Dellinger RP, Townsend SR, et al. The Surviving Sepsis Campaign: results of an international guideline-based performance improvement program targeting severe sepsis. Intensive Care Med 2010; 36 (2): 222–31. - PMC - PubMed
    1. Seymour CW, Gesten F, Prescott HC, et al. Time to treatment and mortality during mandated emergency care for sepsis. N Engl J Med 2017; 376 (23): 2235–44. - PMC - PubMed

LinkOut - more resources