. 2021 Mar;140(3):423-439.
doi: 10.1007/s00439-020-02211-w. Epub 2020 Jul 30.

Genomic, transcriptomic, and protein landscape profile of CFTR and cystic fibrosis

Affiliations

Genomic, transcriptomic, and protein landscape profile of CFTR and cystic fibrosis

Morgan Sanders et al. Hum Genet. 2021 Mar.

Abstract

Cystic Fibrosis (CF) is caused most often by removal of amino acid 508 (Phe508del, deltaF508) within CFTR, yet dozens of additional CFTR variants are known to give rise to CF and many variants in the genome are known to contribute to CF pathology. To address CFTR coding variants, we developed a sequence-to-structure-to-dynamic matrix for all amino acids of CFTR using 233 vertebrate species, CFTR structure within a lipid membrane, and 20 ns of molecular dynamic simulation to assess known variants from the CFTR1, CFTR2, ClinVar, TOPmed, gnomAD, and COSMIC databases. Surprisingly, we identify 18 variants of uncertain significance within CFTR from diverse populations that are heritable and a likely cause of CF that have been understudied due to nonexistence in Caucasian populations. In addition, 15 sites within the genome are known to modulate CF pathology, where we have identified one genome region (chr11:34754985-34836401) that contributes to CF through modulation of expression of a noncoding RNA in epithelial cells. These 15 sites are just the beginning of understanding comodifiers of CF, where utilization of eQTLs suggests many additional genomics of CFTR expressing cells that can be influenced by genomic background of CFTR variants. This work highlights that many additional insights of CF genetics are needed, particularly as pharmaceutical interventions increase in the coming years.


Conflict of interest statement

Declarations

Conflicts of interest/Competing interests: None of the authors have any conflicts to declare.

Figures

Figure 1
Figure 1. CFTR Evolution.
A) Phylogenetic tree of 233 species open reading frame (ORF) sequences of CFTR. The red square is the human CFTR sequence. Numbers at each node represent the percent of clustering within 1,000 bootstrap analyses. B) Codon selection and amino acid conservation analysis of the 233 sequences of CFTR placed on a 21-codon sliding window. The center of the top six motifs within CFTR are labeled for human amino acid number.
Figure 2
Figure 2. CFTR structure and dynamics.
A) Top view of CFTR model, model in simulation box, model embedded into lipid membrane, and water added (left to right). B) Side view correlating to panel A, with amino acids marked for common variants. C) 50 nanoseconds (ns) of molecular dynamic simulations of CFTR protein embedded into a lipid membrane with water on the intracellular and extracellular sides. Data shows the Root-mean squared deviation (RMSD) of the average carbon alpha from the initial structure to each time point of the simulation. D) The carbon alpha root mean squared fluctuation (RMSF) of each amino acid throughout the 50 ns simulation. E) Dynamics cross correlation matrix (DCCM) of amino acids. Sites approaching a value of 1 (highly correlated) are in yellow and sites with no correlation in blue.
Figure 3
Figure 3. Integrated knowledgebase of CFTR variants.
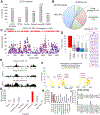
A) The number of unique missense, nonsense, or frameshift mutations found within CFTR from various databases. B) ClinVar annotations for CFTR variants. C) Variant impact scoring for CFTR variants annotated from ClinVar pathogenic (red), CFTR / CFTR2 databases (gray), or ClinVar VUS (magenta). D) Box and whisker plots for values in each group of panel C with additional values for COSMIC and gnomAD/TOPmed (common) variants. E) The number of amino acids correlated to each site of CFTR throughout the molecular dynamic simulations with a cutoff of 0.9 (top), 0.7 (middle) or 0.5 (bottom) correlation. F) VUS that are correlated in dynamics to pathogenic variants. Color corresponds to the number of pathogenic amino acids associated with each site. G) The allele frequencies for ΔF508 in various ethnicities of gnomAD with the red box identified as the highest of all populations. H) The highest allele frequency from gnomAD for pathogenic annotated variants. Each is listed as the variant with the predicted impact score in brackets. I) The highest allele frequency from gnomAD for VUS annotated as functional from our predication scores. Each is listed as the variant with the predicted impact score in brackets.
Figure 4
Figure 4. CF Chromosome 11 regions that influences CF and lung pathologies.
A) Gene region around chr11:34754985–34836401 (yellow box) that associates with cystic fibrosis and chronic obstructive pulmonary disease. Data is extracted from the Roadmap Epigenomics 25-state model with the colors corresponding to the key shown below. In blue are density of ChIP-Seq binding events from K562 and HepG2 cells. B) Zoom in of chr11:34754985–34836401 identifying three different regulation sites within the LD block. In the red region is found the rs11605381 variant (magenta). Shown below in red is the correlation matrix of variant linkage for the CEU (Caucasian Europeans from Utah) population of the 1,000 genomes project. C) Zoom in to sequence level for rs11605381 showing the variant near a PPARalpha potential binding site located close to a conserved GATA factor binding site. Shown below are the known TF binding sites from ENCODE. D) Allele frequency for rs11605381 in different populations with A shown as gray and T in black. E) Read mapping from Caco2 cell line RNAseq for the region surrounding rs11605381 (magenta).
Figure 5
Figure 5. CFTR expression and CFTR cell type eQTL mapping.
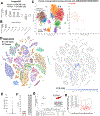
A-B) Expression of CFTR in the Pangloa database consisting of 4,459,768 mouse and 1,126,580 human cell expression from single cell RNAseq. Expression within different clusters of sample tissues (A) or inferred cell types (B) of the 258 total tissues and 10,399 total clusters of single cell analysis. C) Single cell RNAseq analysis from human lung proximal airway stromal cells showing various cell clusters (left) and those cells expressing CFTR (right, red intensity corresponds to cell expression level). D) Single cell clustering from 32 tissues and 81 cell types of mouse (left) with CFTR expression within a very limited number of cells (right, blue intensity corresponds to cell expression level). E) The Cftr counts per million reads within single cells of mouse lung. F) The percent of cells within the mouse lung that express CFTR >10 counts per million. G) Genes that correlate with CFTR expression in the mouse lung single cell datasets. The x-axis shows the Log2 fold change for each gene in cells expressing Cftr and those that do not with the y-axis showing the fold change in the percent of cells expressing each gene in Cftr vs non Cftr expressing cells. Genes in red are those with known eQTLs that correlate with expression. H) The Log2 fold change of eQTL genes in Cftr vs non-Cftr expressing cells relative to the number of tissues that the gene is known to have alterations in expression based on genetics (egene).

References

    1. Adzhubei IA, Schmidt S, Peshkin L, et al. (2010) A method and server for predicting damaging missense mutations. Nat Methods 7:248–249. 10.1038/nmeth0410-248 - DOI - PMC - PubMed
    1. Anderson MP, Gregory RJ, Thompson S, et al. (1991) Demonstration that CFTR is a chloride channel by alteration of its anion selectivity. Science 253:202–205. 10.1126/science.1712984 - DOI - PubMed
    1. Apweiler R, Bairoch A, Wu CH, et al. (2004) UniProt: the Universal Protein knowledgebase. Nucleic Acids Res 32:D115–119. 10.1093/nar/gkh131 - DOI - PMC - PubMed
    1. Arnold M, Raffler J, Pfeufer A, et al. (2015) SNiPA: an interactive, genetic variant-centered annotation browser. Bioinforma Oxf Engl 31:1334–1336. 10.1093/bioinformatics/btu779 - DOI - PMC - PubMed
    1. Blackman SM, Commander CW, Watson C, et al. (2013) Genetic modifiers of cystic fibrosis-related diabetes. Diabetes 62:3627–3635. 10.2337/db13-0510 - DOI - PMC - PubMed

MeSH terms

Substances