. 2020 Jul 31;15(7):e0235190.
doi: 10.1371/journal.pone.0235190. eCollection 2020.

Two decades of little change: An analysis of U.S. medical school basic science faculty by sex, race/ethnicity, and academic rank

Affiliations

Two decades of little change: An analysis of U.S. medical school basic science faculty by sex, race/ethnicity, and academic rank

Christopher L Bennett et al. PLoS One. .

Abstract

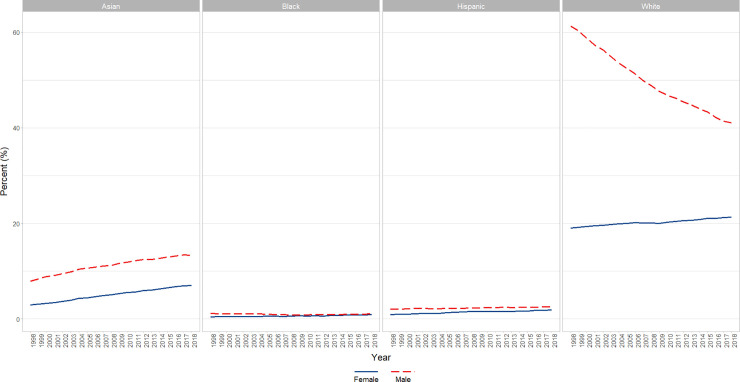
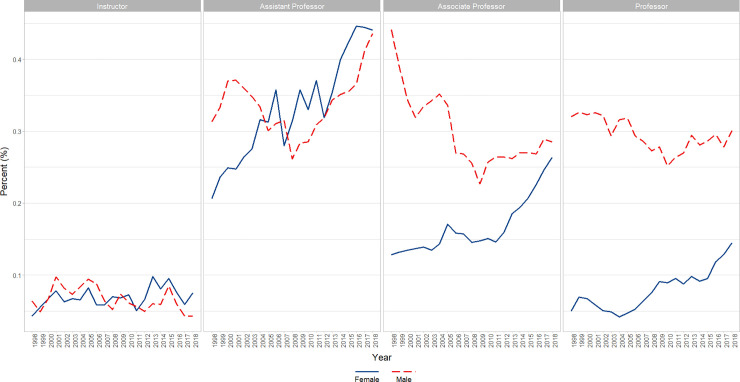
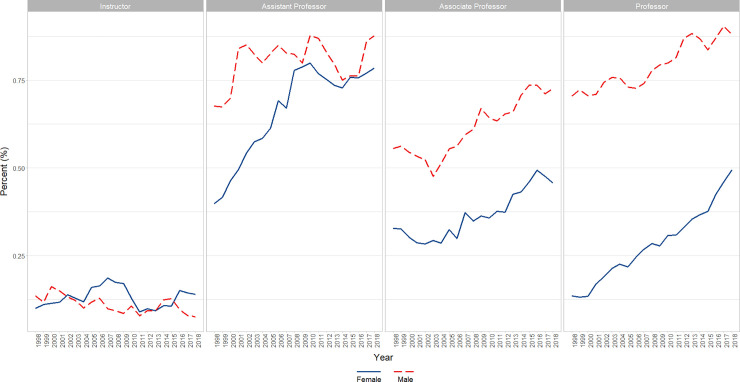
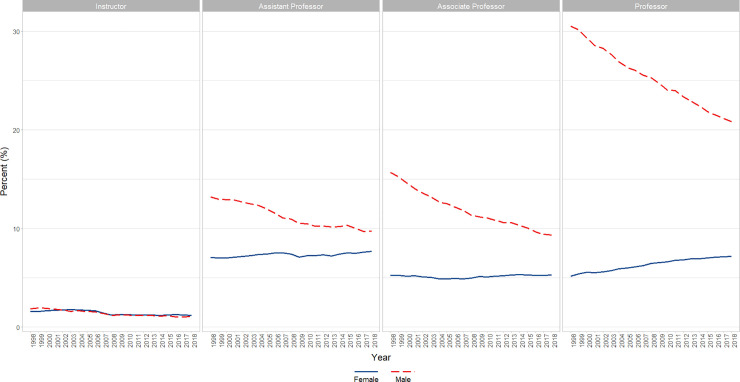
To examine changes in U.S. medical school basic science faculty over the last 20 years (1998-2018), we undertook an observational study utilizing data from the American Association of Medical Colleges Faculty Roster. Rank (Instructor, Assistant Professor, Associate Professor, and Professor), sex (Female), and race/ethnicity (Asian, Black or African American, Hispanic, Latino, Spanish Origin, or Multiple Race-Hispanic, and White) were analyzed; this reflected a population of 14,047 (1998) to 18,601 (2018) faculty. Summary percent of faculty in various gender, race/ethnicity origin categories were analyzed across years of the study using regression models. We found that females (24.47% to 35.32%) were underrepresented at all timepoints and a minority of faculty identified as Black or African American (1.57% to 1.99%), Hispanic, Latino, Spanish Origin, or Multiple Race-Hispanic (3.03% to 4.44%), or Asian (10.90% to 20.41%). The largest population at all time points was White Male Professors (30.53% to 20.85%), followed by White Male Associate Professors (15.67% to 9.34%), and White Male Assistant Professors (13.22% to 9.75%). Small statistically significant increases were observed among female faculty and faculty at multiple ranks who identified as Black or African American or Hispanic, Latino, Spanish Origin, or Multiple Race-Hispanic. We then completed secondary analyses looking at the interaction of race/ethnicity and Gender. We found: (1) a significant increase (p<0.0001) in both genders who identify as Asian although males had a higher rate of increase (6 point difference, p<0.0001); (2) a significant increase for Black or African American females (P<0.01) not found among males; (3) significant increases (p<0.0001) among both genders of faculty who identify as Hispanic, Latino, Spanish Origin, or Multiple Race-Hispanic although females had an approximately 1% higher rate of increase; and (4) among faculty who identify as White, males had a significant decrease (p<0.0001) while females demonstrated an increase (p<0.0001).


Conflict of interest statement

The authors have declared that no competing interests exist.

Figures

Fig 1
Fig 1. Overall changes in race/ethnicity by year (1998–2018).
Graphical representation of raw percentages, unadjusted for autocorrelation, of full-time basic science faculty by race/ethnicity at U.S. Medical schools from December 31, 1998 to December 31, 2018.
Fig 2
Fig 2. Changes in percent female faculty by year and rank (1998–2018).
Graphical representation of raw percentages, unadjusted for autocorrelation, of full-time basic science faculty at U.S. Medical schools from December 31, 1998 to December 31, 2018; reported by faculty who identify as Female at the rank of Instructor, Assistant Professor, Associate Professor, and Professor.
Fig 3
Fig 3. Changes in percent Asian faculty by year and rank (1998–2018).
Graphical representation of raw percentages, unadjusted for autocorrelation, of full-time basic science faculty at U.S. Medical schools from December 31, 1998 to December 31, 2018; reported by faculty who identify as Asian at the rank of Instructor, Assistant Professor, Associate Professor, and Professor.
Fig 4
Fig 4. Changes in percent black or African American faculty by year and rank (1998–2018).
Graphical representation of raw percentages, unadjusted for autocorrelation, of full-time basic science faculty at U.S. Medical schools from December 31, 1998 to December 31, 2018; reported by faculty who identify as Black or African American at the rank of Instructor, Assistant Professor, Associate Professor, and Professor.
Fig 5
Fig 5. Changes in percent Hispanic, Latino, Spanish Origin, or Multiple-Race Hispanic faculty by year and rank (1998–2018).
Graphical representation of raw percentages, unadjusted for autocorrelation, of full-time basic science faculty at U.S. Medical schools from December 31, 1998 to December 31, 2018; reported by faculty who identify as Hispanic, Latino, Spanish Origin, or Multiple Race-Hispanic at the rank of Instructor, Assistant Professor, Associate Professor, and Professor.
Fig 6
Fig 6. Changes in percent White faculty by year and rank (1998–2018).
Graphical representation of raw percentages, unadjusted for autocorrelation, of full-time basic science faculty at U.S. Medical schools from December 31, 1998 to December 31, 2018; reported by faculty who identify as White at the rank of Instructor, Assistant Professor, Associate Professor, and Professor.
Fig 7
Fig 7. Overall changes in percent female faculty by self-reported race/ethnicity over time (1998–2018).
Graphical representation of overall change in raw percentages, unadjusted for autocorrelation, of full-time basic science faculty at U.S. Medical schools from December 31, 1998 to December 31, 2018; separated by race/ethnicity.
Fig 8
Fig 8. Changes in percent Asian faculty by gender and academic rank over time (1998–2018).
Graphical representation of overall change in raw percentages, unadjusted for autocorrelation, of full-time basic science Asian faculty at U.S. Medical schools from December 31, 1998 to December 31, 2018 by rank (Instructor, Assistant Professor, Associate Professor, and Professor).
Fig 9
Fig 9. Changes in percent black or African American faculty by gender and academic rank over time (1998–2018).
Graphical representation of overall change in raw percentages, unadjusted for autocorrelation, of full-time basic science Black of African American faculty at U.S. Medical schools from December 31, 1998 to December 31, 2018 by rank (Instructor, Assistant Professor, Associate Professor, and Professor).
Fig 10
Fig 10. Changes in percent Hispanic, Latino, Spanish Origin, or Multiple Race-Hispanic faculty by gender and academic rank over time (1998–2018).
Graphical representation of overall change in raw percentages, unadjusted for autocorrelation, of full-time basic science Hispanic, Latino, Spanish Origin, or Multiple Race-Hispanic faculty at U.S. Medical schools from December 31, 1998 to December 31, 2018 by rank (Instructor, Assistant Professor, Associate Professor, and Professor).
Fig 11
Fig 11. Changes in percent White faculty by gender and academic rank over time (1998–2018).
Graphical representation of overall change in raw percentages, unadjusted for autocorrelation, of full-time basic science White faculty at U.S. Medical schools from December 31, 1998 to December 31, 2018 by rank (Instructor, Assistant Professor, Associate Professor, and Professor).

References

    1. Page SE. The difference: How the power of diversity creates better groups, firms, schools, and societies. Princeton: Princeton University Press; 2007.
    1. Campbell LG, Mehtani S, Dozier ME, Rinehart J. Gender-heterogeneous working groups produce higher quality science. PLoS One. 2013;8(10):e79147 10.1371/journal.pone.0079147 - DOI - PMC - PubMed
    1. Hong L, Page SE. Groups of diverse problem solvers can outperform groups of high-ability problem solvers. Proc Natl Acad Sci U S A. 2004;101(46):16385–9. - PMC - PubMed
    1. Lett LA, Murdock HM, Orji WU, Aysola J, Sebro R. Trends in racial/ethnic representation among US medical students. JAMA Netw Open. 2019;2(9):e1910490 10.1001/jamanetworkopen.2019.10490 - DOI - PMC - PubMed
    1. Lett LA, Orji WU, Sebro R. Declining racial and ethnic representation in clinical academic medicine: A longitudinal study of 16 US medical specialties. PLoS One. 2018;13(11):e0207274 10.1371/journal.pone.0207274 - DOI - PMC - PubMed

MeSH terms