. 2020 Jul 31;15(7):e0236591.
doi: 10.1371/journal.pone.0236591. eCollection 2020.

Pre-analytical and analytical variables that influence urinary volatile organic compound measurements

Affiliations

Pre-analytical and analytical variables that influence urinary volatile organic compound measurements

Michael McFarlanE et al. PLoS One. .

Abstract

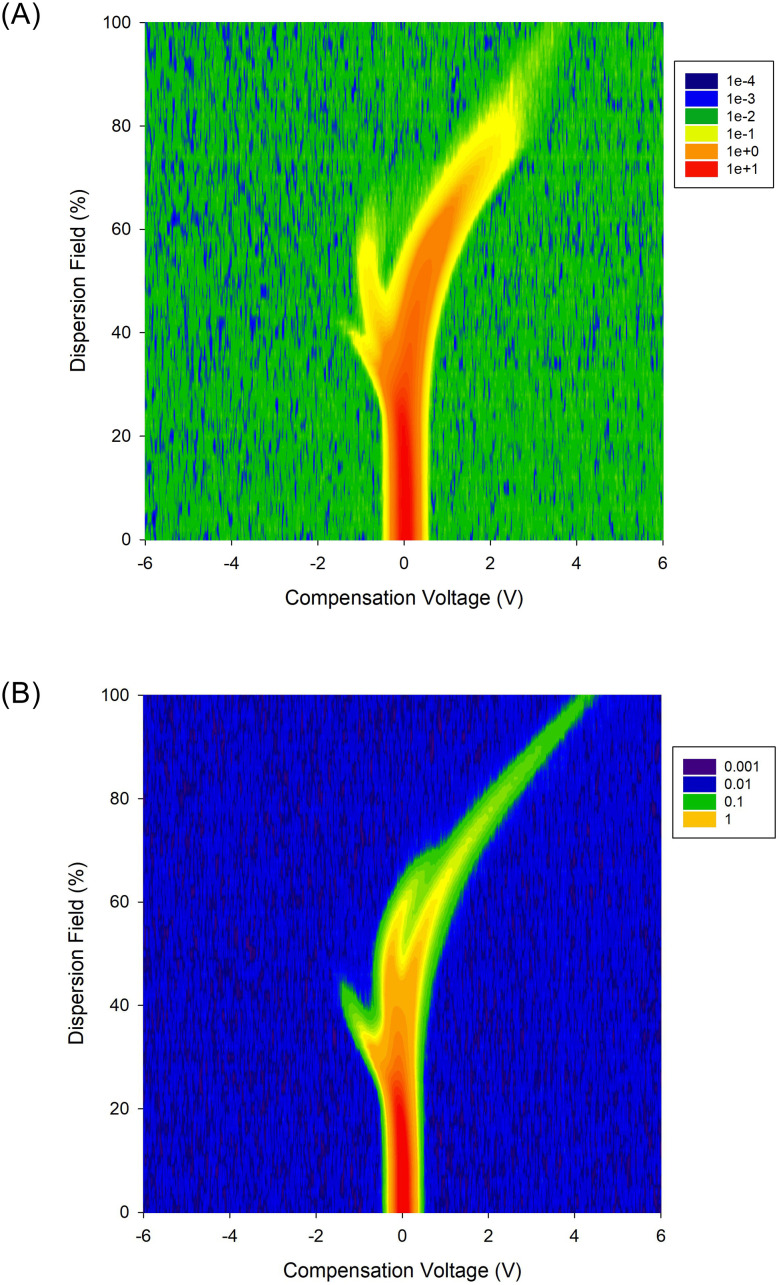
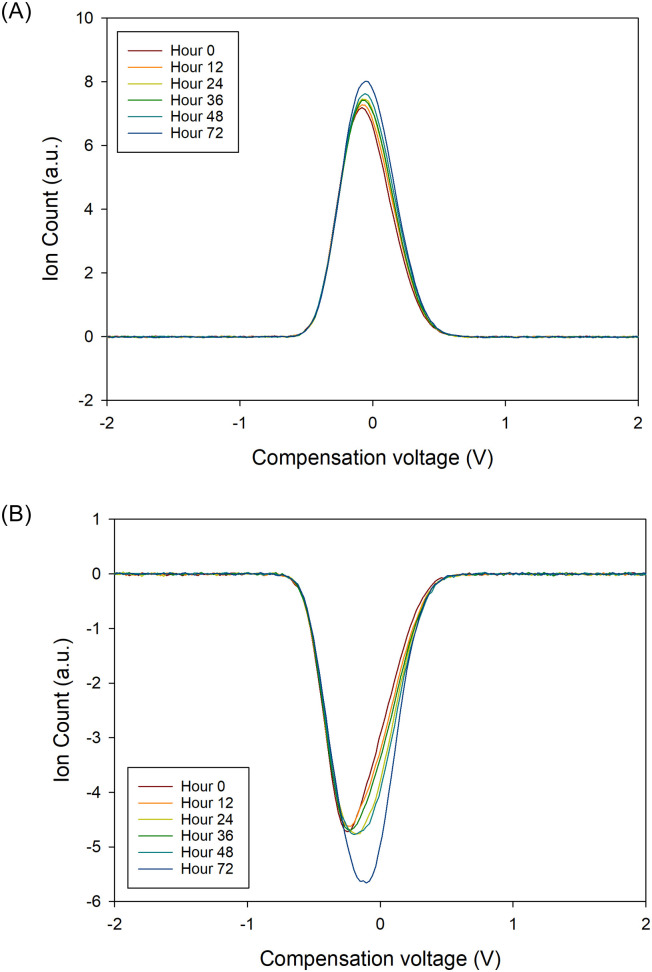
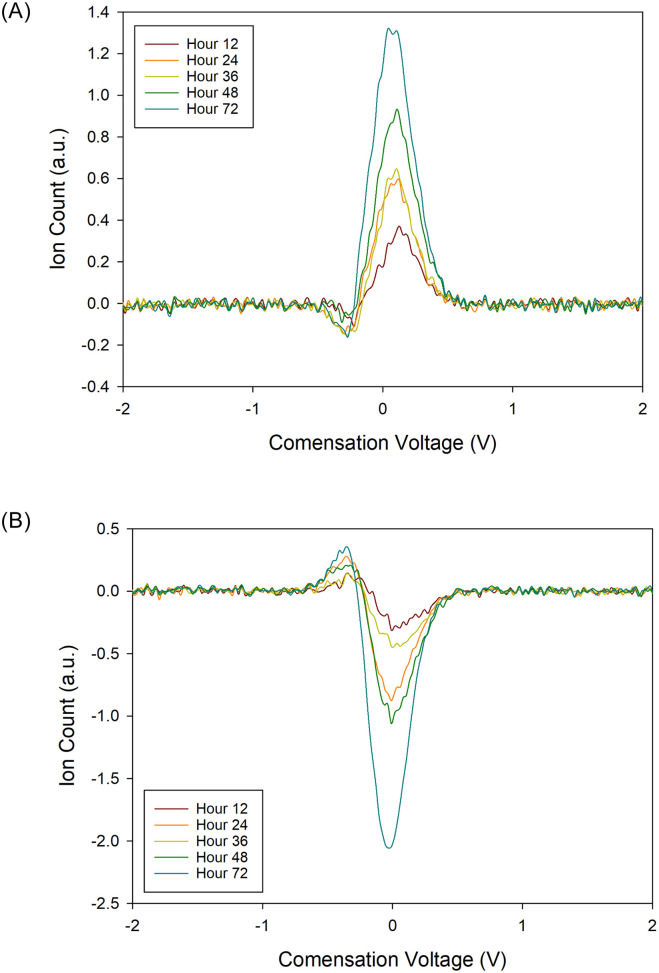
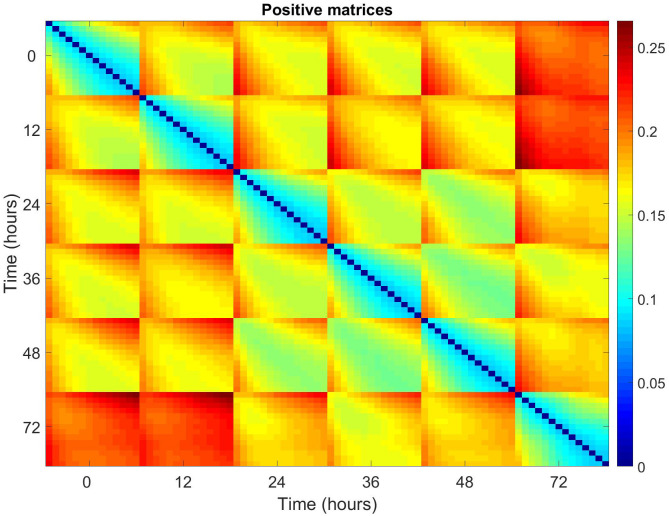
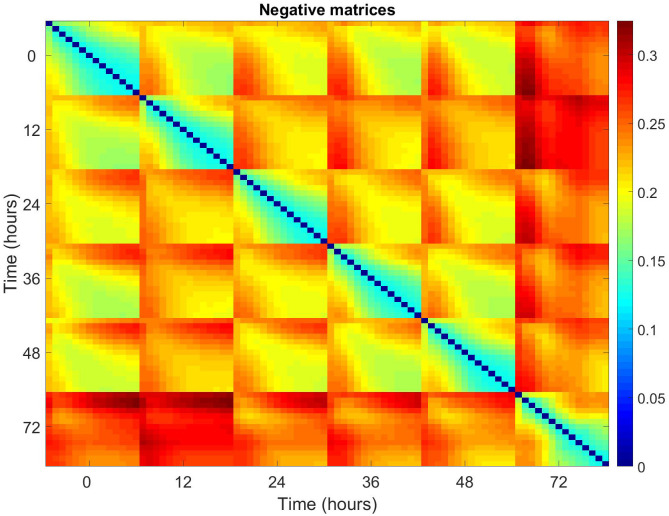
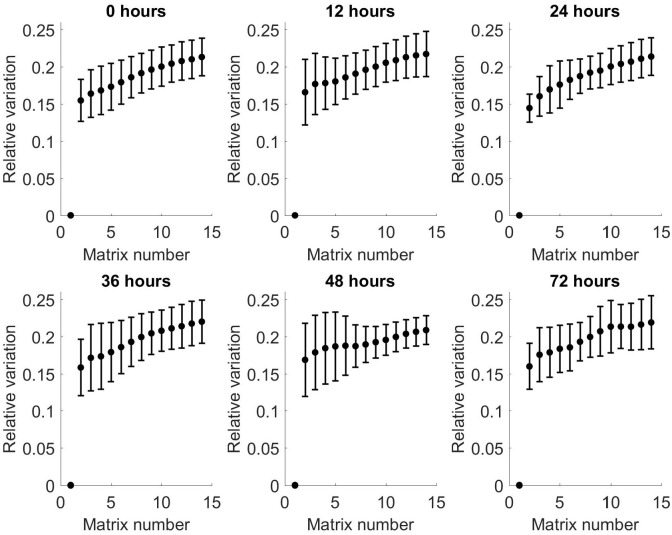
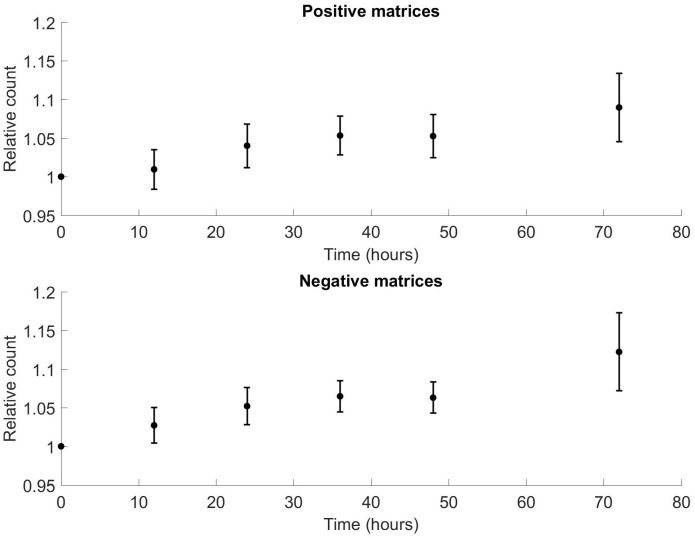
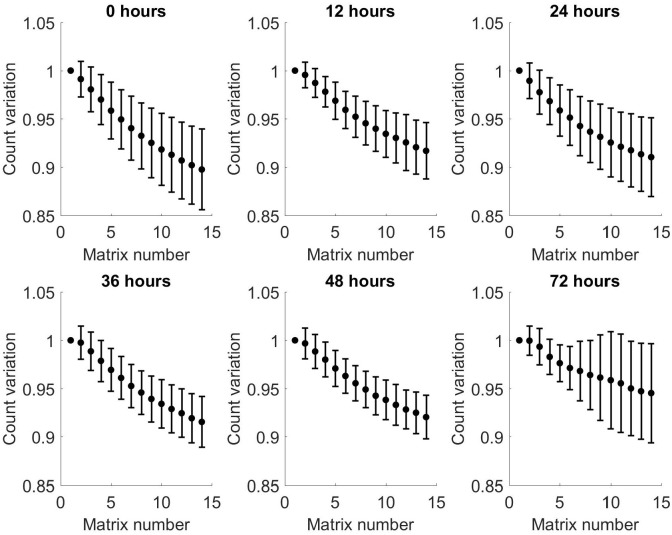
There has been rapidly accelerating interest in the utilization of volatile organic compounds (VOCs) as non-invasive methods for rapid point-of-care medical diagnostics. There is widespread variation in analytical methods and protocols, with little understanding of the effects of sample storage on VOC profiles. This study aimed to determine the effects on VOC profiles of different storage times, at room temperature, prior to freezing, of sealed urine samples from healthy individuals. Analysis using Field Asymmetric Ion Motility Spectrometry (FAIMS) determined the alterations in VOC and total ion count profiles as a result of increasing room temperature storage times. Results indicated that increasing exposure time to room temperature prior to freezing had a threefold effect. Firstly, increased urinary VOC profile variability, with a plateau phase between 12 and 48 hours, before further degradation. Secondly, an increase in total ion count with time exposed to room temperature. Finally, a deterioration in VOCs with each sample run during the analysis process. This provides new insight into the effect of storage of urine samples for VOC analysis using FAIMS technology. Results of this study provide a recommendation for a 12-hour maximum duration at room temperature prior to storage.


Conflict of interest statement

The authors have declared that no competing interests exist.

Figures

Fig 1
Fig 1. Examples FAIMS plumes for (a) positive ions and (b) negative ions, for the sample subject taken at the beginning of the study (note: both are showing absolute values).
The plume contains chemical information, whilst the remainder is background.
Fig 2
Fig 2
(a) Variation of positive FAIMS matrices from the mean of the matrices from t = 0. Bars show standard error. Correlation of mean variation with time: Spearman ρ0.94, p = 0.017. Correlation of all points with time ρ0.52, p < 0.001. Plateau phase seen between 12 and 48 hours. (b) Variation of negative FAIMS matrices from the mean of the matrices from t = 0. Bars show standard error. Correlation of mean variation with time: Spearman ρ0.83, p = 0.058. Correlation of all points with time ρ0.54, p < 0.001. Plateau phase seen between 12 and 48 hours.
Fig 3
Fig 3. 2D plot of compensation voltage versus on count at a single dispersion field and over time for (a) positive ions and (b) negative ions.
Fig 4
Fig 4. 2D plot of compensation voltage versus on count at a single dispersion field and over time for (a) positive ions and (b) negative ions, showing different from hour 0.
Fig 5
Fig 5. Pairwise relative differences for all pairs of positive matrices averaged across all patients.
Blocks correspond to labelled times, with 14x14 elements corresponding to the associated matrices. Each 14x14 block corresponds to the pairwise differences between the matrices at each time point i.e. Time point 0, matrix 1 vs time point 0, matrix 1/2/3/4 etc.
Fig 6
Fig 6. Pairwise relative differences for all pairs of negative matrices averaged across all patients.
Blocks correspond to the labelled times, with 14 x 14 elements corresponding to the associated matrices.
Fig 7
Fig 7. Relative variation from baseline of arithmetic mean of all patients as a function of matrix number for each time point for positive matrices.
Bars show standard deviation.
Fig 8
Fig 8. Relative variation from baseline of arithmetic mean of all patients as a function of matrix number for each time point for negative matrices.
Bars show standard deviation.
Fig 9
Fig 9
(a) Variation in relative ion count for positive matrices from mean of matrices at t = 0. Bars show standard error. Correlation of mean ion count with time: Spearman ρ0.94, p = 0.017; correlation of all points with time: Spearman ρ0.25, p = 0.009. Plateau phase seen between 12 and 48 hours. (b) Variation in relative ion count for negative matrices from mean of matrices at t = 0. Bars show standard error. Correlation of mean ion count with time: Spearman ρ0.94, p = 0.017; correlation of all points with time: Spearman ρ0.27, p = 0.004. Plateau phase seen between 12 and 48 hours.
Fig 10
Fig 10. Relative variation of ion count from baseline of arithmetic mean of all patients as a function of matrix number for each time point for positive matrices.
Bars show standard deviation.
Fig 11
Fig 11. Relative variation of ion count from baseline of arithmetic mean of all patients as a function of matrix number for each time point for negative matrices.
Bars show standard deviation.

References

    1. Arasaradnam R.P.; Covington J.A.; Harmston C.; Nwokolo C.U. Review article: Next generation diagnostic modalities in gastroenterology-gas phase volatile compound biomarker detection. Aliment. Pharmacol. Ther. 2014, 39, 780–789. 10.1111/apt.12657 - DOI - PubMed
    1. Esfahani S; Sagar N.M.; Kyrou I.; Mozdiak E.; O'Connell N.; Nwokolo C, et al. Variation in Gas and Volatile Compound Emissions from Human Urine as It Ages, Measured by an Electronic Nose. Biosensors 2016, 6(1), 4–15. - PMC - PubMed
    1. Wilson A.D.; Baietto M. Advances in electronic-nose technologies developed for biomedical applications. Sensors 2011, 11, 1105–1176. 10.3390/s110101105 - DOI - PMC - PubMed
    1. Covington J.A.; der Schee M.V.; Edge A.S.L.; Boyle B.; Savage R.S.; Arasaradnam R.P. The application of FAIMS gas analysis in medical diagnostics. Analyst 2015, 140, 6775–6781 10.1039/c5an00868a - DOI - PubMed
    1. Montuschi P.; Mores N.; Trové A.; Mondino C.; Barnes P.J. The electronic nose in respiratory medicine. Respiration 2013, 85, 72–84. 10.1159/000340044 - DOI - PubMed

Substances