. 2020 Aug 18;53(2):353-370.e8.
doi: 10.1016/j.immuni.2020.07.003. Epub 2020 Jul 30.

Differential IRF8 Transcription Factor Requirement Defines Two Pathways of Dendritic Cell Development in Humans

Affiliations

Differential IRF8 Transcription Factor Requirement Defines Two Pathways of Dendritic Cell Development in Humans

Urszula Cytlak et al. Immunity. .

Abstract

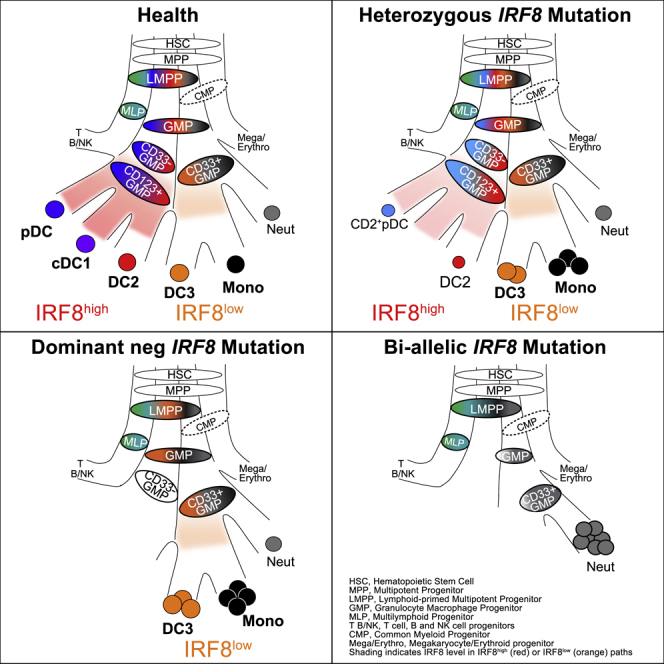
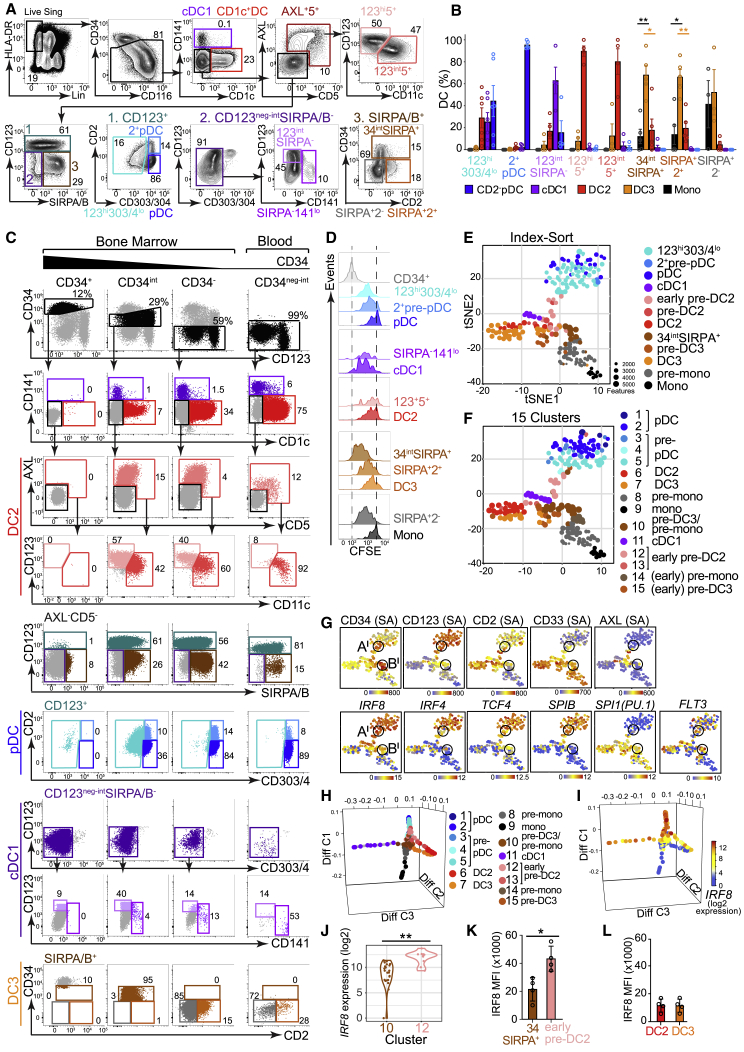
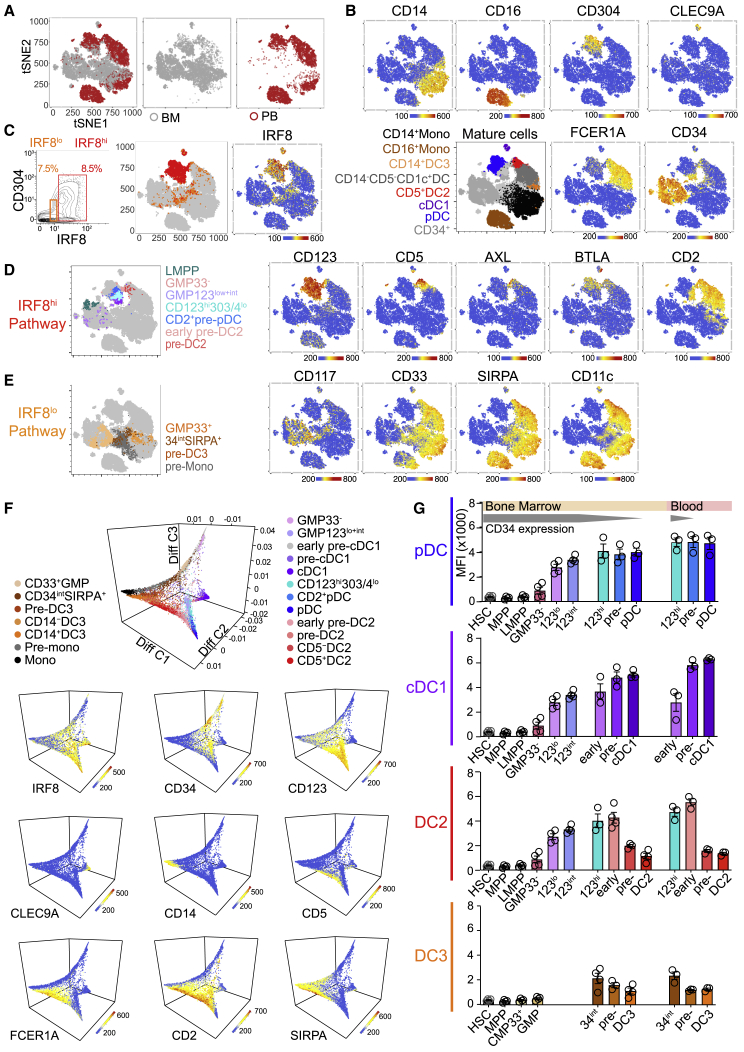
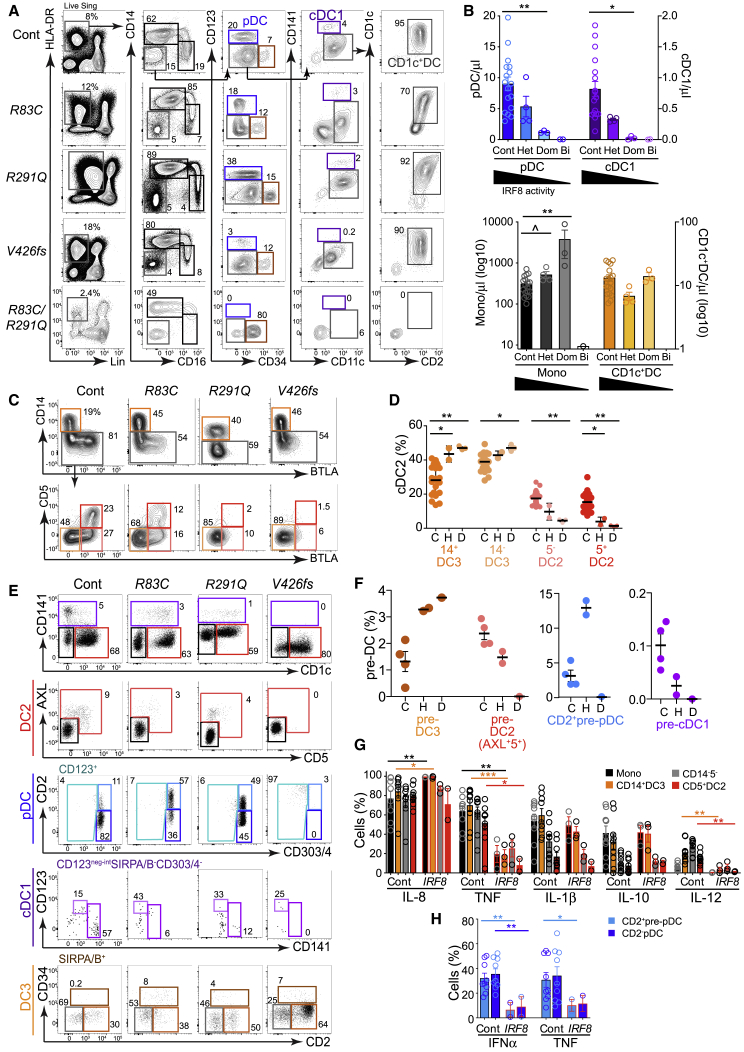
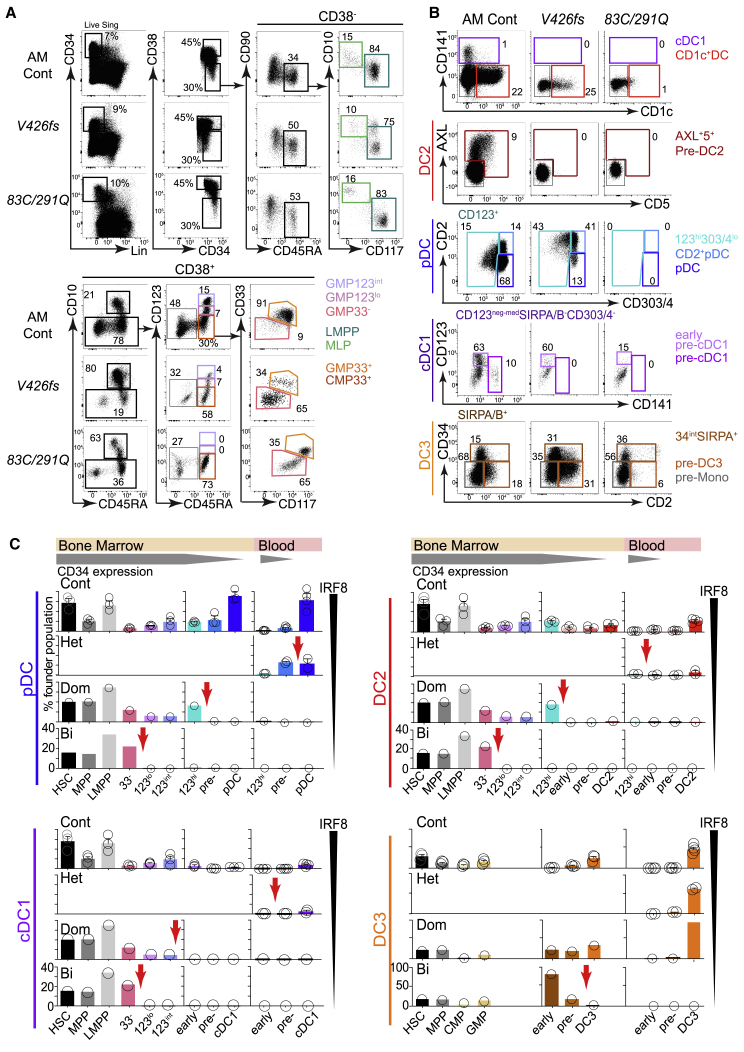
The formation of mammalian dendritic cells (DCs) is controlled by multiple hematopoietic transcription factors, including IRF8. Loss of IRF8 exerts a differential effect on DC subsets, including plasmacytoid DCs (pDCs) and the classical DC lineages cDC1 and cDC2. In humans, cDC2-related subsets have been described including AXL+SIGLEC6+ pre-DC, DC2 and DC3. The origin of this heterogeneity is unknown. Using high-dimensional analysis, in vitro differentiation, and an allelic series of human IRF8 deficiency, we demonstrated that cDC2 (CD1c+DC) heterogeneity originates from two distinct pathways of development. The lymphoid-primed IRF8hi pathway, marked by CD123 and BTLA, carried pDC, cDC1, and DC2 trajectories, while the common myeloid IRF8lo pathway, expressing SIRPA, formed DC3s and monocytes. We traced distinct trajectories through the granulocyte-macrophage progenitor (GMP) compartment showing that AXL+SIGLEC6+ pre-DCs mapped exclusively to the DC2 pathway. In keeping with their lower requirement for IRF8, DC3s expand to replace DC2s in human partial IRF8 deficiency.

Keywords: CyTOF; IRF8; dendritic cell; hematopoiesis; immunity; primary immunodeficiency; single-cell RNA sequencing; transcription factor.


Conflict of interest statement

Declaration of Interests The authors declare no competing interests.

Figures

None
Graphical abstract
Figure 1
Figure 1
CD1c+ DC Heterogeneity Is Evident in Human BM (A) Flow phenotyping of CD1c+ DCs from HC PB mononuclear cells (PBMCs) (representative example of n = 22), distinct from SIRPACD141+ cDC1s, CD123+CD303/4+ pDCs, and CD88+monocytes (Mono). CD14+CD163+BTLA (orange), CD14CD163+BTLA (light orange), CD163BTLA+CD5 (light red), and CD163BTLA+CD5+ (red) CD1c+ DC subsets are indicated. (B) 3D representation of CD14, CD5, and BTLA expression (flow cytometry) across the CD1c+ DC population. Heatmap shows expression of CD163. (C) PCA of NanoString gene expression profiling of fluorescence-activated cell sorting (FACS)-purified DC subsets from n = 3 HC PBMCs. CD1c+ DCs were purified based on their expression of CD14, CD5, and BTLA (A). (D) Intracellular flow analysis of in vitro cytokine elaboration (percentage of positive cells) by PB monocytes (black) and CD1c+DC subsets CD14+ (orange), CD14CD5 (gray), and CD5+ (red) from n = 9 HC donors in response to 14-h stimulation with TLR agonists (CpG, poly(I:C), CL075, and lipopolysaccharide [LPS]). p values were derived from paired two-tailed t tests; p < 0.05; ∗∗p < 0.01; ∗∗∗p < 0.005. Bars show mean ± SEM, and circles represent individual donors. (E and F) Representative examples of the flow profiling of DC subsets in human spleen (n = 3), dermis (n = 3) (E) and BM (n = 13) (F), gated as in (A). Histograms show CD163 and BTLA expression on CD14+ (orange), CD5+ (red) and CD14CD5 (gray) CD1c+ DCs. (G) tSNE visualization of the expression of TFs and surface markers across HC PB and BM lineage(lin, CD3,19,20,56,161)-HLA-DR+ cells by CyTOF analysis. Black gates indicate the CD1c+DC population distinct from CD88+monocytes, CLEC9A+cDC1 and CD303+pDC. Red and orange gates indicate expression of lymphocyte- or monocyte-associated antigens, respectively. (H) Hierarchical clustering of single-cell transcriptomes of mature DCs from BM using all protein-coding, non-cell-cycle genes. Marker genes were identified within SC3 with parameters p < 0.01, area under the receiver operating characteristic curve (AUROC) > 0.85; cluster 1, pDCs (GZMB, JCHAIN); cluster 2, monocytes (S100A8, VCAN); cluster 3, CD14+ DC3s (HLA-DPB1); cluster 5, cDC1s (CD59). The top rows show fluorescence intensity of surface antigens (“Antigens”) from index-sorted cells, and “Phenotype” denotes their classification defined by surface markers. See also Figure S1.
Figure 2
Figure 2
CD14 Expression Distinguishes between CD1c+DC Subsets Generated In Vitro (A) Gating strategy used to identify DCs and monocytes generated from HC BM CD34+ progenitors at day 21 (D21) of culture on OP9 in the presence of SCF, FL, and GM-CSF. A minimum of two antigens was used to define the following populations: CD141+CLEC9A+ cDC1s, CD123+CD303+CD304+ pDCs, CD2+CD1c+ DCs encompassing CD14+ and CD5+ populations, and CD14+CD1cCD2 monocytes. (B) Flow analysis of the expression of population-specific markers across in vitro-generated monocytes (black), CD14+ (orange), CD5+ (red), or CD5 (pink) CD14CD1c+ DCs as defined in (A). (C) Intracellular flow evaluation of the expression of IRF4 and IRF8 by PB and culture-derived monocytes and DCs, gated as shown in Figure 1A and (A), respectively. (D) Kinetics of DC culture output over 21 days plotted as the number of DCs or monocytes generated per CD34+ progenitor. n = 6 donors with minimum n = 3 at each time point. Dots and bars show mean and SEM. (E) Flow analysis of the expression of population-specific markers by FACS-purified PB monocytes and CD1c+ subsets at day 7 of culture. (F) Flow analysis of CD14 expression by FACS-purified PB CD1c+subsets at day 7 of culture. Histogram shows a representative example from n = 7 (CD14 DC3 and CD5 DC2) or n = 5 (CD5+ DC2) HC donors, summarized in the graph. Bars represent mean ± SEM. Circles represent individual donors. ∗∗∗p < 0.005 by paired two-tailed t test. (G) PCA of NanoString gene expression of FACS-purified PB DCs (“PB”) (n = 3) and DCs derived from BM CD34+ progenitors at D21 of culture (“C”; black outline) (n = 3) after removal of a “culture signature” generated by pairwise comparison of all PB versus all culture-generated cells. (H) Heatmap of Z scores of differentially expressed signature genes (NanoString) derived from pairwise comparisons of PB CD1c+ DC subsets and monocytes, shown next to the Z scores of expression of the same genes by culture-derived CD14 and CD14+ DCs and monocytes. (I) Intracellular flow analysis of in vitro cytokine elaboration (percentage of positive cells) in response to TLR agonists, as described in Figure 1D, by CD14+CD1c monocytes (black bars), CD14+ DC3s (orange), and CD14 DC2s (red) generated from n = 4 BM CD34+ progenitors at day 21 of culture. p values from paired two-tailed t tests; p < 0.05; ∗∗p < 0.01; ∗∗∗p < 0.005. Bars show mean ± SEM. See also Figure S2.
Figure 3
Figure 3
High IRF8 Expression Defines LMPP-Associated DC Progenitors (A) Flow gating strategy used to define and FACS-purify components of the CD34+ lin(CD3,14,16,19,20,7) compartment of human BM. HSC, hematopoietic stem cell; MPP, multipotent progenitor; MEP, megakaryocyte-erythroid progenitor; MLP, multilymphoid progenitor; LMPP, lymphoid-primed multipotent progenitor; CMP, common myeloid progenitor; GMP, granulocyte-macrophage progenitor. (B) Heatmap of intracellular IRF8 protein expression across CMP and GMP as defined in (A) (gate 1). (C) Monocyte and DC subset output from purified BM CD34+ populations at day 14 of culture gated as in Figure 2A. Populations were quantified as percentage of the total cells captured by all DC and monocyte gates. Absolute output is shown in Figure S3C. Bulk CD34+ (22 experiments from 13 donors: 22;13); CMP (7;5); GMP33+ (7;6); LMPP (7;6); GMP33 (6;6); GMP123lo (3;3); GMP123int (8;7) (Table S4). Bars represent mean + SEM, and circles represent individual experiments. Significant differences in the proportional output of DC2s versus DC3s are indicated in red; p < 0.05; ∗∗p < 0.01; ∗∗∗∗p = 0.0001 (paired two-tailed t tests). (D) Unsupervised hierarchical clustering of transcriptomes of single cells within the GMP index-sorting gate, using all protein-coding, non-cell-cycle genes, independent of surface antigen expression. Marker genes for four clusters identified within the single-cell consensus clustering 3 (SC3) tool (p < 0.1, AUROC > 0.75) and IRF8 are displayed. The top rows show fluorescence intensity of surface antigens from index-sorted cells. Flow annotation (“Flow annot”) denotes the classification of cells by their surface phenotype (Figures 3A and S3F). (E–G) tSNE visualization of the first 10 principal components (25% of total variance) of the transcriptomes of 262 CD34+ progenitor cells, independently of their surface phenotype. tSNE plots are shown annotated by (E), gate of origin from index-linked flow (Figure S3F), or (F), 10 clusters from hierarchical clustering (Figure S3J), Heatmaps (G) show flow surface antigen expression (“SA”) and log2 expression of key DC TFs, IRF8, TCF4, SPIB, and SPI1(PU.1), displayed across the tSNE plot (E and F). Black circles represent regions of high (“A”) or low (“B”) IRF8 expression. (H and I) Diffusion map using all protein-coding, non-cell-cycle genes. (H) The key specifies the designated cluster color, identity, and cluster number from Figure S3J. (I) IRF8 expression. Diff Comp, diffusion component. (J) Violin plot of differential IRF8 expression (log2) in progenitor clusters 5 (HSCs and MPPs), 1 (monocyte enriched), and 8 (DC related). ∗∗p = 0.001 by Mann-Whitney U. (K) Median fluorescence intensity (MFI) of intracellular IRF8 by flow analysis across gates identifying HC BM CD34+ HSCs and CD123neg-lo CD33+ and CD123int GMPs (n = 4) as defined in (A). p = 0.028 by Mann-Whitney U. See also Figure S3.
Figure 4
Figure 4
Two Trajectories of DC Development Connect the Progenitor Compartment with Mature DCs (A) Flow gating strategy used to identify DCs and their precursors in BM, including CD141+ cDC1s; CD1c+ DCs; AXL+CD5+ cells composed of CD123hiCD11c (light pink) and CD123intCD11c+ (dark pink) fractions; CD2+ (light blue) and CD2 (dark blue) pDCs; CD123+CD303/4lo cells (turquoise); SIRPA/BCD123intCD141 (lightest purple) and CD141lo (light purple) populations; and CD123SIRPA/B CD34int (brown), CD34CD2+ (dark orange), and CD34CD2 (gray) precursors. (B) The output of in vitro culture of CD34int DC precursors FACS-purified from BM using the gating strategy described in (A). Population-specific output is expressed as a proportion (%) of the total cells captured by all DC and monocyte gates. CD123hi303/4lo (six experiments from four donors; 6;4); CD2+ pre-pDCs (5;3); CD123hi5+ (4;3); CD123int5+ (4;3); CD34intCD123int (4;4); CD34intSIRPA+ (5;5); SIRPA+2+ (4;4); SIRPA+2 (4;4). Bars represent mean + SEM, and circles represent individual experiments. Significant differences in the proportional output of DC2s versus DC3s (red) or DC3s versus monocyte (black) are indicated: p < 0.05; ∗∗p < 0.01 (paired, two-tailed t test). (C) Flow gating strategy from (A) applied to linHLA-DR+ cells from HC BM fractionated by high, intermediate, and low CD34 expression, next to blood (columns) for comparison of antigen expression levels among progenitor, precursor, and mature populations. Individual DC lineages are ordered in rows. (D) Proliferative potential of FACS-purified DC and DC precursors estimated by CFSE dilution (see STAR Methods). CD34+progenitors and CD14+monocytes were included as positive and negative controls, respectively. The CFSE dilution histograms for each precursor are grouped and ordered according to their proposed position in the developmental trajectory for each DC lineage. Plots shown are representative of n = 3 experiments (summarized in Figure S4H). (E and F) tSNE visualization of the first 20 principal components (explaining 35% total variance) of the transcriptomes of 244 single cells adaptively sampled from linHLA-DR+ CD34neg-int precursor and mature DC populations of BM. tSNE plots are annotated by the gate of origin from index-linked flow (E) or by 15 clusters generated from hierarchical clustering of all protein-coding non-cell-cycle genes (F), independently of surface phenotype (Figure S4K). (G) Heatmaps showing the expression of key surface antigens (SAs) (index-linked flow) or log2 gene expression of TFs and FLT3 (scRNA-seq) across the tSNE plot in (E) and (F). Black circles represent regions of high or low IRF8 expression, marked Al or Bl, respectively. The differential expression patterns of these regions correspond to the patterns of regions “A” (IRF8hiCD123intGMP) and “B” (IRF8loGMP33+) in Figures 3E–3G. (H and I) Diffusion map generated with all protein-coding, non-cell-cycle genes to infer pseudo-temporal ordering of cells and reconstruct lineage branching. (H) Cells are colored according to the hierarchical clusters generated in Figure S4K. (I) IRF8 expression (log2). Diff C, diffusion component. (J) Violin plot of differential IRF8 expression (log2) in clusters 10 (SIRPA+34int) and 12 (early pre-DC2). ∗∗p < 0.001 by Mann-Whitney U. (K and L) MFI of intracellular IRF8 by flow analysis across gates identifying BM 34intSIRPA+ pre-DC3s and pre-mono and CD123hiCD5+ early pre-DC2s (K) and CD5+ DC2s and CD5 DC3s (L) (n = 4). p = 0.028 by Mann-Whitney U. See also Figure S4.
Figure 5
Figure 5
Differential IRF8 Expression Defines the Two Trajectories of DC Development (A–E) CyTOF analysis of FACS-purified CD45+lin(CD3,19,20,56,161) PB and BM progenitors, precursors, and mature DCs and monocytes using a panel of 33 surface antigens and two intracellular stains (IRF4 and IRF8). (A) tSNE visualization of linHLA-DR+ cells, down-sampled to select 75,000 cells (20,000 CD11b+CD14+ monocytes, 4,000 CD11b+CD16+ monocytes, and 50,000 non-monocyte cells). PB (red) and BM (gray) cells were distinguished by differential CD45+ conjugate staining and displayed across tSNE space. (B) Heatmap of DC or monocyte-subset-specific antigens displayed on tSNE plots as in (A) (blue-yellow-red scales represent channel values). “Mature cells” plot shows the location of DC and monocyte subsets and CD34+ progenitors, identified by back-gating from bivariate plots (Figures S5B–S5D). (C) The location in tSNE space of IRF8hi (red) and IRF8lo (orange) expressing cells identified by (1) standard gating on a bivariate plot of IRF8 versus CD304 and superimposition of these gated cells on tSNE space and (2) a heatmap of IRF8 expression across all cells. (D and E) Location in tSNE space of progenitors and precursors with pDC, cDC1, or DC2 (D) and DC3 or monocyte (E) potential as defined by previous experiments, identified by back-gating from bivariate plots (Figures S5B and S5C), and heatmaps of associated antigens. (F) Diffusion map generated with 14,000 cells including GMPs, precursor and mature DCs, and monocytes. Populations were identified and color-coded according to Figures 3A (progenitors) and 4A (precursors, DCs, and monocytes), applied to CyTOF data as shown in Figures S5B and S5C. Heatmaps show the expression (log2) of IRF8 and key antigens superimposed across the diffusion map trajectories. See also Figure S5E. Diff C, diffusion component. (G) Histograms summarizing IRF8 protein expression by flow cytometry (MFI) in progenitors, precursors, and mature cells of pDC, cDC1, DC2, and DC3 lineages from BM and PB. Bars show mean ± SEM. Circles show individual donors (BM progenitors, n = 4; BM and PB precursors and mature DCs, n = 3). See also Figure S5.
Figure 6
Figure 6
IRF8hi and IRF8lo Pathways Are Differentially Compromised in IRF8 Deficiency (A) PB flow analysis of monocytes and DCs in subjects carrying heterozygous IRF8R83C or IRF8R291Q mutation (Het), their child carrying IRF8R83C/R291Q (Bi), and a carrier of dominant-negative heterozygous mutation IRF8V426fs (Dom) compared with HC (Cont). (B) Trucount quantification of PB DCs and monocytes in subjects carrying IRF8 mutations (gating shown in Figure S6A; Hambleton et al., 2011; Bigley et al., 2018)). Cont, n = 25; Het, n = 4 (IRF8R83C, IRF8R291Q, and two subjects carrying IRF8K108E); Dom, n = 3 (IRF8V426fs); Bi, n = 2 (IRF8R83C/R291Q and IRF8K108E/K108E). (C) Flow cytometry phenotyping of CD1c+ DC subsets derived from the CD1c+CD2+ gate (gray) in (A) to identify CD14+ DC3s (orange), CD14BTLA DC3s (light orange), CD5BTLA+ DC2s (light red), and CD5+BTLA+ DC2s (red). (D) Proportion of CD1c+ DC subsets (gated as in C, from the individuals represented in B). C, control; H, heterozygous parents; D, dominant-negative heterozygotes (IRF8V426fs). (E) Flow analysis of DC and monocyte precursors in PB of subjects carrying IRF8 mutations as shown, gated as in Figure 4C. (F) Proportion of DC and monocyte precursors out of all pre-DCs in PB of subjects carrying IRF8 mutations, gated as in (E). C, control; H, heterozygous; D, IRF8V426fs (G and H) Intracellular flow analysis of in vitro cytokine elaboration (percentage of positive cells) by CD14+ monocytes (black), CD14+ DC3s (orange), CD14CD5CD1c+ DCs (gray), and CD5+ DC2s (red) (G) and CD2+ pre-pDCs and pDCs from HC (n = 8) and subjects carrying heterozygous IRF8R83C, IRF8R291Q (mean of technical duplicates) or IRF8V426fs (IRF8, red-outlined bars) (H). See also STAR Methods and Figure 1H. Bars show mean ± SEM, and circles represent individual subjects. p < 0.05; ∗∗p < 0.01; ∗∗∗p < 0.001; ˆp = 0.053, Mann-Whitney U. See also Figure S6.
Figure 7
Figure 7
IRF8 Deficiency Causes Dose-Dependent Blockade of the IRF8hi Pathway (A and B) Flow cytometry analysis of BM CD34+ progenitors (A) and DC and monocyte precursors (B) from the subjects carrying dominant-negative IRF8V426fs and bi-allelic IRF8 mutations and an age-matched control (AM Cont). BM was not available from healthy heterozygotes IRF8R83C and IRF8R291Q. Gating and color coding as in Figures 3A and 4C. (C) The relative proportions of progenitors and precursors in BM and PB from controls (n = 3 BM, n = 4 PB) and individuals carrying heterozygous IRF8R83C and IRF8R291Q (PB, Het), IRF8V426fs (Dom), or IRF8R83C/R291Q(Bi) to pinpoint the block associated with progressive loss of IRF8 activity for each DC lineage. CD34+ populations were expressed as a proportion of total gated CD34+ cells. Precursor and mature DC populations were expressed as a proportion of the total number of gated CD34neg-int cells. Likely points of blockade are indicated by red arrows. See also Figure S7.

Comment in

References

    1. Afzali B., Grönholm J., Vandrovcova J., O’Brien C., Sun H.W., Vanderleyden I., Davis F.P., Khoder A., Zhang Y., Hegazy A.N. BACH2 immunodeficiency illustrates an association between super-enhancers and haploinsufficiency. Nat. Immunol. 2017;18:813–823. - PMC - PubMed
    1. Alcántara-Hernández M., Leylek R., Wagar L.E., Engleman E.G., Keler T., Marinkovich M.P., Davis M.M., Nolan G.P., Idoyaga J. High-dimensional phenotypic mapping of human dendritic cells reveals interindividual variation and tissue specialization. Immunity. 2017;47:1037–1050.e6. - PMC - PubMed
    1. Anders S., Pyl P.T., Huber W. HTSeq—a Python framework to work with high-throughput sequencing data. Bioinformatics. 2015;31:166–169. - PMC - PubMed
    1. Angerer P., Haghverdi L., Büttner M., Theis F.J., Marr C., Buettner F. destiny: diffusion maps for large-scale single-cell data in R. Bioinformatics. 2016;32:1241–1243. - PubMed
    1. Becker A.M., Michael D.G., Satpathy A.T., Sciammas R., Singh H., Bhattacharya D. IRF-8 extinguishes neutrophil production and promotes dendritic cell lineage commitment in both myeloid and lymphoid mouse progenitors. Blood. 2012;119:2003–2012. - PMC - PubMed

Publication types

MeSH terms