. 2020 Sep 9;28(3):475-485.e5.
doi: 10.1016/j.chom.2020.06.021. Epub 2020 Jul 3.

Neutralizing Antibody and Soluble ACE2 Inhibition of a Replication-Competent VSV-SARS-CoV-2 and a Clinical Isolate of SARS-CoV-2

Affiliations

Neutralizing Antibody and Soluble ACE2 Inhibition of a Replication-Competent VSV-SARS-CoV-2 and a Clinical Isolate of SARS-CoV-2

James Brett Case et al. Cell Host Microbe. .

Abstract

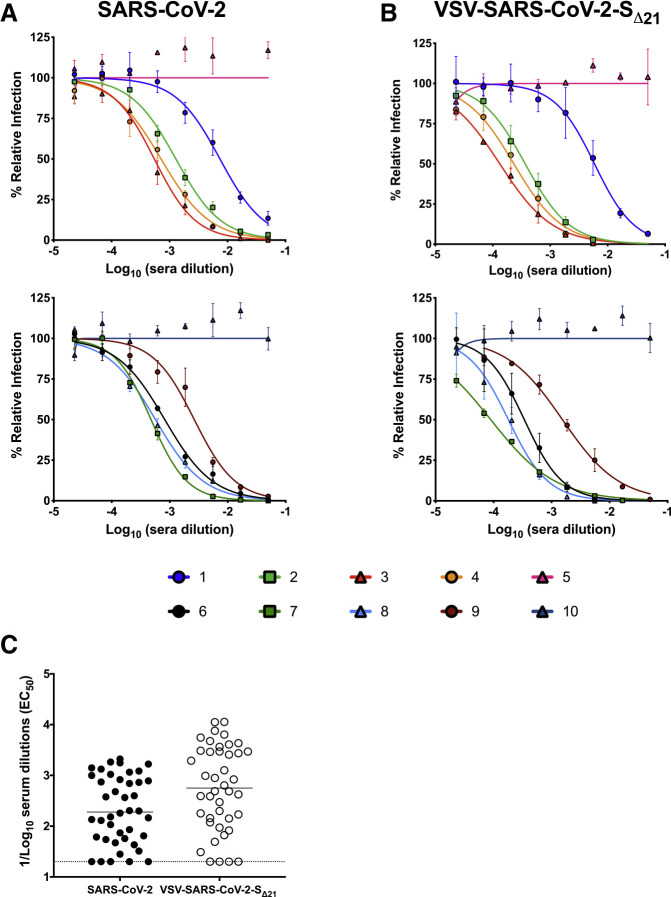
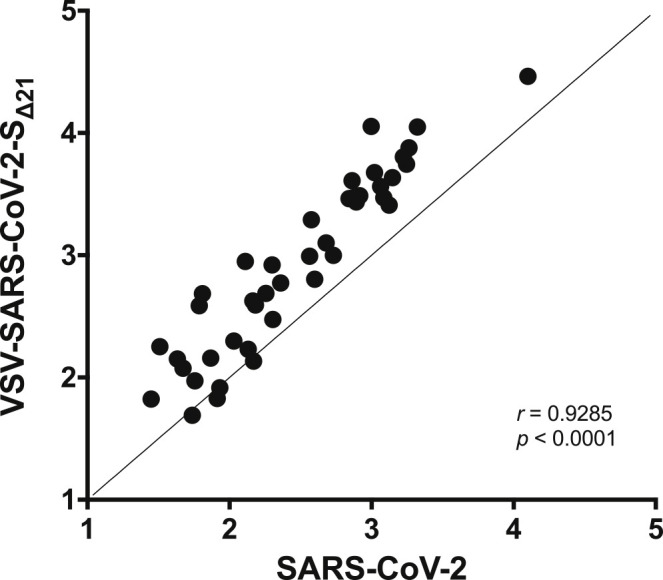
Antibody-based interventions against SARS-CoV-2 could limit morbidity, mortality, and possibly transmission. An anticipated correlate of such countermeasures is the level of neutralizing antibodies against the SARS-CoV-2 spike protein, which engages with host ACE2 receptor for entry. Using an infectious molecular clone of vesicular stomatitis virus (VSV) expressing eGFP as a marker of infection, we replaced the glycoprotein gene (G) with the spike protein of SARS-CoV-2 (VSV-eGFP-SARS-CoV-2) and developed a high-throughput-imaging-based neutralization assay at biosafety level 2. We also developed a focus-reduction neutralization test with a clinical isolate of SARS-CoV-2 at biosafety level 3. Comparing the neutralizing activities of various antibodies and ACE2-Fc soluble decoy protein in both assays revealed a high degree of concordance. These assays will help define correlates of protection for antibody-based countermeasures and vaccines against SARS-CoV-2. Additionally, replication-competent VSV-eGFP-SARS-CoV-2 provides a tool for testing inhibitors of SARS-CoV-2 mediated entry under reduced biosafety containment.

Keywords: ACE2; COVID19; SARS-CoV-2; VSV; antibody; coronavirus; neutralizing; serum; surrogate assay.


Conflict of interest statement

Declaration of Interests M.S.D. is a consultant for Inbios, Eli Lilly, Vir Biotechnology, and NGM Biopharmaceuticals and is on the Scientific Advisory Board of Moderna. The Diamond laboratory has received unrelated funding under sponsored research agreements from Moderna and Emergent BioSolutions. D.C. and H.W.V. are employees of Vir Biotechnology Inc. and may hold shares in Vir Biotechnology Inc. S.P.J.W. and P.W.R. have filed a disclosure with Washington University for the recombinant VSV.

Figures

None
Graphical abstract
Figure 1
Figure 1
Generation and Characterization of an Infectious VSV-SARS-CoV-2 Chimera (A) A schematic diagram depicting the genomic organization of the VSV recombinants. Shown 3′ to 5′ are the leader region (Le), eGFP, nucleocapsid (N), phosphoprotein (P), matrix (M), glycoprotein (G) or SARS-CoV-2 S, large polymerase (L), and trailer region (Tr). On right, infection of Vero CCL81 cells with supernatant from cells transfected with the eGFP reporter VSV-SARS-CoV-2-SAA. Images were acquired 44 h post-infection (hpi) using a fluorescence microscope, and GFP and transmitted light images were merged using ImageJ. Shown at bottom, the alignment of the cytoplasmic tail of the VSV-SARS-CoV-2-SAA and the sequence resulting from forward genetic selection of a mutant, which truncated the cytoplasmic tail by 21 amino acids. Mutations deviating from the wild-type spike are indicated in red, and an asterisk signifies a mutation to a stop codon. (B) Plaque assays were performed to compare the spread of VSV-SARS-CoV-2-SAA rescue supernatant and VSV-SARS-CoV-2-SΔ21 on Vero CCL81, Vero E6, Vero-furin, and MA104 cells. Plates were scanned on a biomolecular imager and expression of eGFP is shown 92 hpi (representative images are shown; n > 3 except for SAA on Vero E6, Vero-furin, and MA104 cells). (C) The indicated cell types were infected with VSV-SARS-CoV-2-SΔ21 at an MOI of 0.5. Cells and supernatants were harvested at 24 hpi and titrated on MA104 cells (data are pooled from three or more independent experiments; error bars indicate standard deviation of the mean. (D Top: the indicated cells were infected with VSV-SARS-CoV-2-SΔ21 at an MOI of 2. Images were acquired 7.5 hpi using a fluorescence microscope and GFP, and transmitted light images were processed and merged using ImageJ (data are representative of two independent experiments). Bottom: Plaque assays were performed on the indicated cell types using VSV-SARS-CoV-2-SΔ21. Images showing GFP expression were acquired 48 hpi using a biomolecular imager (data are representative of at least three independent experiments; standard deviations of the mean are shown). (E) Western blotting was performed on concentrated VSV-SARS-CoV-2-SΔ21 and wild-type VSV particles on an 8% non-reducing SDS-PAGE gel. S1 was detected using a cross-reactive anti-SARS-CoV mAb (CR3022) (data are representative of two independent experiments). (F) BSRT7/5 cells were inoculated at an MOI of 10 with VSV-eGFP, G-complemented VSV-SARS-CoV-2-SΔ21, or mock infected (not shown), and were metabolically labeled with [35S] methionine and cysteine for 20 h starting at 5 hpi in the presence of actinomycin D. Viral supernatants were analyzed by SDS-PAGE. A representative phosphor-image is shown from two independent experiments. An asterisk indicates a band that also was detected in the mock lane (not shown). (G) Purified VSV-WT and VSV-SARS-CoV-2-SΔ21 particles were subjected to negative stain electron microscopy; scale bars are equivalent to 100 nm. Prefusion structures of each respective glycoprotein are modeled above each EM image (PDB: 5I2S and 6VSB). See also Figures S1 and S2.
Figure 2
Figure 2
Development of a SARS-CoV-2 Focus-Forming Assay and a VSV-SARS-CoV-2-SΔ21 eGFP-Reduction Assay (A–C) Representative focus forming assay images (A) of viral stocks generated from each producer cell type (top) were developed on the indicated cell substrates (indicated on the left side). Data are representative of two independent experiments. Foci obtained in (A) were counted (B) and the size was determined (C) using an ImmunoSpot plate reader (p < 0.05, ∗∗p < 0.01, ∗∗∗p < 0.001 by one-way ANOVA with Tukey’s multiple comparisons test; error bars indicate standard error of the mean). (D) Representative serial dilution series of VSV-SARS-CoV-2-SΔ21 on Vero E6 cells. The total number of infected cells per well was quantified using an automated microscope. Insets of enhanced magnification are shown in red. Data are representative of two independent experiments.
Figure 3
Figure 3
Neutralization of VSV-SARS-CoV-2-SΔ21 and SARS-CoV-2 by Human Monoclonal Antibodies and hACE2 Decoy Receptors (A and B) Cross-reactive mAbs isolated from a SARS-CoV survivor were tested for neutralizing activity against SARS-CoV-2 (A) or VSV-SARS-CoV-2-SΔ21 (B) (n = 2 and 3, respectively). (C and D) SARS-CoV-2 RBD-specific antibodies obtained from a phage library were tested for their capacity to neutralize SARS-CoV-2 (C) or VSV-SARS-CoV-2-SΔ21 (D) (n = 2 and 2, respectively). (E and F) hACE2-Fc or mACE2-Fc were tested for their neutralization activity against SARS-CoV-2 (E) or VSV-SARS-CoV-2-SΔ21 (F) (n = 2 and 3, respectively). Error bars in (A)–(F) represent the standard error of the mean. See also Figure S3.
Figure 4
Figure 4
Human Immune Serum Neutralization of SARS-CoV-2 and VSV-SARS-CoV-2-SΔ21 (A and B) Representative neutralization curves of serum from SARS-CoV-2-infected donors with low, medium, and high inhibitory activity against SARS-CoV-2 (A) or VSV-SARS-CoV-2-SΔ21 (B) (n = 2 and 2, respectively). Error bars in (A) and (B) represent the standard error of the mean. (C) EC50 values of all human serum tested for neutralization of SARS-CoV-2 and VSV-SARS-CoV-2-SΔ21. Differences in the geometric mean or median titers were 3.0-fold between FRNT and GRNT assays. See also Figure S4.
Figure 5
Figure 5
Correlation Analysis of Neutralization of SARS-CoV-2 and VSV-SARS-CoV-2-SΔ21 EC50 values determined in Figures 3A–3D and 4A–4B were used to determine correlation between neutralization assays. Spearman’s correlation r and p values are indicated.

Update of

Comment in

  • Snatching the Crown from SARS-CoV-2.
    Coughlan L. Coughlan L. Cell Host Microbe. 2020 Sep 9;28(3):360-363. doi: 10.1016/j.chom.2020.08.007. Cell Host Microbe. 2020. PMID: 32910919 Free PMC article.

Similar articles

Cited by

References

    1. Bai Y., Yao L., Wei T., Tian F., Jin D.Y., Chen L., Wang M. Presumed Asymptomatic Carrier Transmission of COVID-19. JAMA. 2020 doi: 10.1001/jama.2020.2565. - DOI - PMC - PubMed
    1. Bankevich A., Nurk S., Antipov D., Gurevich A.A., Dvorkin M., Kulikov A.S., Lesin V.M., Nikolenko S.I., Pham S., Prjibelski A.D. SPAdes: a new genome assembly algorithm and its applications to single-cell sequencing. J Comp. Biol. 2012;19:455–477. - PMC - PubMed
    1. Bloch E.M., Shoham S., Casadevall A., Sachais B.S., Shaz B., Winters J.L., van Buskirk C., Grossman B.J., Joyner M., Henderson J.P. Deployment of convalescent plasma for the prevention and treatment of COVID-19. J Clin Invest. 2020;130:2757–2765. - PMC - PubMed
    1. Brown K.S., Safronetz D., Marzi A., Ebihara H., Feldmann H. Vesicular stomatitis virus-based vaccine protects hamsters against lethal challenge with Andes virus. J. Virol. 2011;85:12781–12791. - PMC - PubMed
    1. Buchholz U.J., Finke S., Conzelmann K.K. Generation of bovine respiratory syncytial virus (BRSV) from cDNA: BRSV NS2 is not essential for virus replication in tissue culture, and the human RSV leader region acts as a functional BRSV genome promoter. J. Virol. 1999;73:251–259. - PMC - PubMed

Publication types

MeSH terms

Substances