. 2020 Oct:257:120234.
doi: 10.1016/j.biomaterials.2020.120234. Epub 2020 Jul 15.

A nephrotoxicity-free, iron-based contrast agent for magnetic resonance imaging of tumors

Affiliations

A nephrotoxicity-free, iron-based contrast agent for magnetic resonance imaging of tumors

Xiangdong Xue et al. Biomaterials. 2020 Oct.

Abstract

Gadolinium-based contrast agents (GBCAs) are the most widely used T1 contrast agents for magnetic resonance imaging (MRI) and have achieved remarkable success in clinical cancer diagnosis. However, GBCAs could cause severe nephrogenic systemic fibrosis to patients with renal insufficiency. Nevertheless, GBCAs are quickly excreted from the kidneys, which shortens their imaging window and prevents long-term monitoring of the disease per injection. Herein, a nephrotoxicity-free T1 MRI contrast agent is developed by coordinating ferric iron into a telodendritic, micellar nanostructure. This new nano-enabled, iron-based contrast agent (nIBCA) not only can reduce the renal accumulation and relieve the kidney burden, but also exhibit a significantly higher tumor to noise ratio (TNR) for cancer diagnosis. In comparison with Magnevist (a clinical-used GBCA), Magnevist induces obvious nephrotoxicity while nIBCA does not, indicating that such a novel contrast agent may be applicable to renally compromised patients requiring a contrast-enhanced MRI. The nIBCA could precisely image subcutaneous brain tumors in a mouse model and the effective imaging window lasted for at least 24 h. The nIBCA also precisely highlights the intracranial brain tumor with high TNR. The nIBCA presents a potential alternative to GBCAs as it has superior biocompatibility, high TNR and effective imaging window.

Keywords: Contrast agents; Magnetic resonance imaging; Nanoparticle; Nephrotoxicity-free; Tumor imaging.


Conflict of interest statement

Competing interests

The authors declare no competing financial interest.

Declaration of interests

The authors declare that they have no known competing financial interests or personal relationships that could have appeared to influence the work reported in this paper.

Figures

Figure 1.
Figure 1.. Characterization of the nIBCA.
a) Size distributions of nIBCA. The hydrodynamic diameter (Dhyd) and polydispersity index (PDI) were measured by dynamic light scattering (DLS). b) TEM showed the morphology of the nIBCA. The scale bar is 100 nm. c) Stability of nIBCA in the presence of 10% of fetal bovine serum. The size distribution and PDI were employed for stability evaluation. 0 day denote the fresh-made nIBCA. d) UV-vis spectra of PEG-catechol, NDGA, FeCl3, physical mixture of the reactants (PEG-catechol, NDGA and FeCl3) and ICT. The concentration of ICT was set as 5 μM. The reactants were set to their corresponding concentrations in ICT. e) Relaxivity (r1) of nIBCA. The inset showed the MRI images. L, low concentration; H, high concentration. f) Hemolysis of nIBCA at different concentrations with water and PBS as a positive and negative control, respectively.
Figure 2.
Figure 2.. nIBCA-mediated T1-weighted MRI in brain tumor (U251 MG) bearing mouse.
a) T1-weighted MR images of the subcutaneous brain tumors (upper panel) and kidneys (lower panel) in nude mouse obtained at different timepoints after i.v. injection of nIBCA. 0 h indicates the timepoint before the administration of the contrast agent. b) Quantitative analysis of the MRI signal in the tumor. c) Tumor to normal tissue ratio (TNR) of the MRI signal on the mouse. d) Quantitative analysis of the MRI signal on the kidney. e) Comparison of TNR between nIBCA (24 h) and Magnevist (10 min) from the tumor MRI. Since the tumor accumulation time between nIBCA and Magnevist are different, the timepoints that showed the highest MRI signal were compared. The statistical analysis of b), c) and d) were compared with 0 h. *, p<0.05; **, p<0.01; ***, p<0.001; ns, not significantly. 100 mg/kg of nIBCA or 67 mg/kg of Magnevist were i.v. administrated into brain tumor-bearing mice (n=3). 100 mg/kg nIBCA and 67 mg/kg Magnevist contained the same amounts of the metal (iron in nIBCA and Gd in Magnevist).
Figure 3.
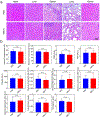
Figure 3.. Nephrotoxicity of nIBCA and Magnevist on a mouse model of kidney disease.
a) The procedures for the establishment of the mouse model of KD and the following treatments. b) H&E analysis of the kidneys from the mice with different treatments. The results were presented at 40× and 400× magnification. Cont.: control mice without any treatment. Cis: mice treated with cisplatin to induce kidney disease. Cis+Mag: the mice with kidney disease treated with Magnevist. Cis+nIBCA, the mice with kidney disease treated with nIBCA. The white spaces represent increased luminal diameters of the proximal convoluted tubules due to epithelial loss and sloughing (asterisk). Cellular casts formed by the sloughed epithelial cells occlude the luminal space (arrow). Ballooning degeneration and individual cell necrosis are highlighted by dashed and solid circles, respectively. The scale bar in 40× is 200 μm, and 400× is 20 μm. c) Creatine and d) blood urea nitrogen (BUN) indexes of the mice (n=3). *, p<0.05; **, p<0.01. 100 mg/kg of nIBCA or 67 mg/kg of Magnevist were i.v. administrated into brain tumor-bearing mice (n=3). 100 mg/kg nIBCA and 67 mg/kg Magnevist contained the same amounts of the metal (iron in nIBCA and Gd in Magnevist).
Figure 4.
Figure 4.. Pharmacokinetics (PK) of nIBCA.
PK profile of a) Magnevist and b) nIBCA in nude mice (n=3). The insets showed the PK profile from 0 to 120 min, due to the short circulation time of Magnevist. c) Quantification of PKs of Magnevist and nIBCA. AUC, area under the curve; T1/2 α, distribution phase of circulation half-time; T1/2 β, elimination phase.
Figure 5.
Figure 5.. Application of nIBCA in intracranial brain tumor (U251 MG) diagnosis.
a) Schematic illustration of the establishment of the orthotopic brain tumor model. b) T1-weighted MR images of orthotopic brain tumor by using nIBCA as a contrast agent. c) Quantitative analysis of the T1 MRI signal of an orthotopic brain tumor. d) TNR of the T1-weighted MRI in mouse brain tumor imaging. e) H&E staining that indicates the morphology, location, and size of the intracranial brain tumor. Red circle encloses the tumor tissue. The scale bar is 2 mm. ***, p<0.001. 100 mg/kg of nIBCA or 67 mg/kg of Magnevist were i.v. administrated into brain tumor-bearing mice (n=3). 100 mg/kg nIBCA and 67 mg/kg Magnevist contained the same amounts of the metal (iron in nIBCA and Gd in Magnevist).
Figure 6.
Figure 6.. Tumor selectivity of nIBCA on an intracranial brain tumor.
a) CLSM images of nIBCA distribution in intracranial brain tumor. Upper panel, CLSM images of the whole brain, the scale bar is 2 mm. Lower panel, detailed tissue distribution of nIBCA by CLSM with high magnification, the scale bar is 100 μm. The whole-brain of mice was collected for cryo-section. The nuclei were stained with Hoechst 33342. The distribution of nIBCA was indicated by the fluorescence of DiD. B) H&E stain of the brain tissue. Upper panel, H&E image of the whole brain. The H&E slice was next to the one for CLSM and well-corresponded to the whole brain image of CLSM. The tumor tissue was enclosed in the black dash circle. The scale bar is 2 mm. Lower panel, the tumor/normal tissue boundary was differentiated at high magnification of optical microscope (not corresponding to CLSM image). The black dash line showed the boundary of the normal tissue and tumor tissue. N denotes normal tissue; T denotes tumor. The scale bar is 100 μm. The adjacent slice to the one for CLSM image was processed for H&E stain.
Figure 7.
Figure 7.. Systemic toxicity of nIBCA.
a) H&E stain of the main organs of the nIBCA treated mice. The scale bar is 100 μm. b) Hematology of nIBCA treated mice. The PBS-treated mice were employed as the normal controls.
Scheme 1.
Scheme 1.. Schematic illustration of the advantages of nIBCA over a commercial GBCA.
The nIBCA selectively accumulates at the tumor site and had a significantly lower concentration in normal tissue. This selective accumulation enhances the MRI signal in the tumor site and has a high TNR. The GBCA not only infuses into tumor site, but also diffuses into normal tissues which result in a low TNR. GBCA is excreted through renal clearance and lead to a high accumulation of GBCA in the kidneys, which may be the main cause of NSF to patients with kidney disease. The nIBCA would not get to the kidneys and should, therefore, have little or no nephrotoxicity. Acronyms or abbreviations: ICT, iron-coordinated telodendrimer; PEG, polyethylene glycol; NDGA, nordihydroguaiaretic acid; DHCA, 3,4-dihydroxyhydrocinnamic acid; TNR, tumor to normal tissue ratio.

References

    1. Greene FL, Balch CM, Fleming ID, Fritz A, Haller DG, Morrow M, Page DL, AJCC cancer staging handbook: TNM classification of malignant tumors, Springer Science & Business Media, 2002.
    1. Gambhir SS, Molecular imaging of cancer with positron emission tomography, Nat. Rev. Cancer 2(9) (2002) 683–693. - PubMed
    1. Lardinois D, Weder W, Hany TF, Kamel EM, Korom S, Seifert B, von Schulthess GK, Steinert HC, Staging of Non–Small-Cell Lung Cancer with Integrated Positron-Emission Tomography and Computed Tomography, N. Engl. J. Med 348(25) (2003) 2500–2507. - PubMed
    1. Edward Coleman R, Single photon emission computed tomography and positron emission tomography in cancer imaging, Cancer 67(S4) (1991) 1261–1270. - PubMed
    1. Wiele C.V.d., Lahorte C, Vermeersch H, Loose D, Mervillie K, Steinmetz ND, Vanderheyden J-L, Cuvelier CA, Slegers G, Dierck RA, Quantitative Tumor Apoptosis Imaging Using Technetium-99m–HYNIC Annexin V Single Photon Emission Computed Tomography, J. Clin. Oncol 21(18) (2003) 3483–3487. - PubMed

Publication types