

Uncovering spatial variation in maternal healthcare service use at subnational level in Jimma Zone, Ethiopia
- PMID: 32736622
- PMCID: PMC7394677
- DOI: 10.1186/s12913-020-05572-0
Uncovering spatial variation in maternal healthcare service use at subnational level in Jimma Zone, Ethiopia
Abstract
Background: Analysis of disaggregated national data suggest uneven access to essential maternal healthcare services within countries. This is of concern as it hinders equitable progress in health outcomes. Mounting an effective response requires identification of subnational areas that may be lagging behind. This paper aims to explore spatial variation in maternal healthcare service use at health centre catchment, village and household levels. Spatial correlations of service use with household wealth and women's education levels were also assessed.
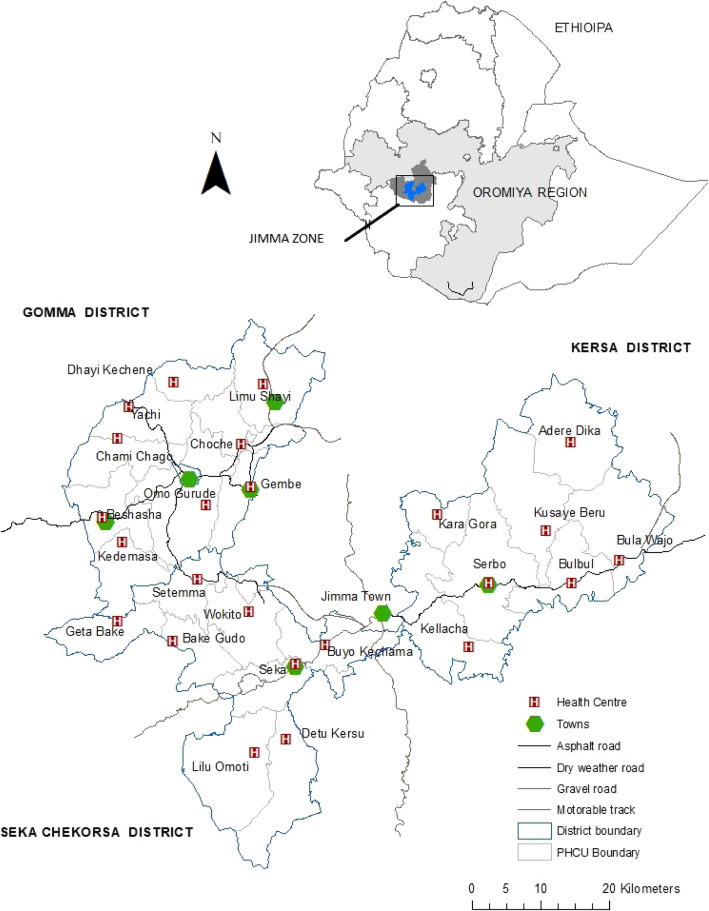
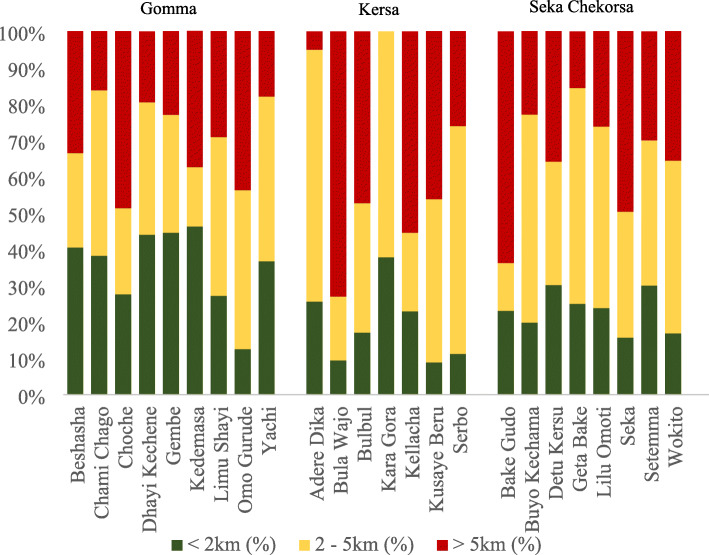
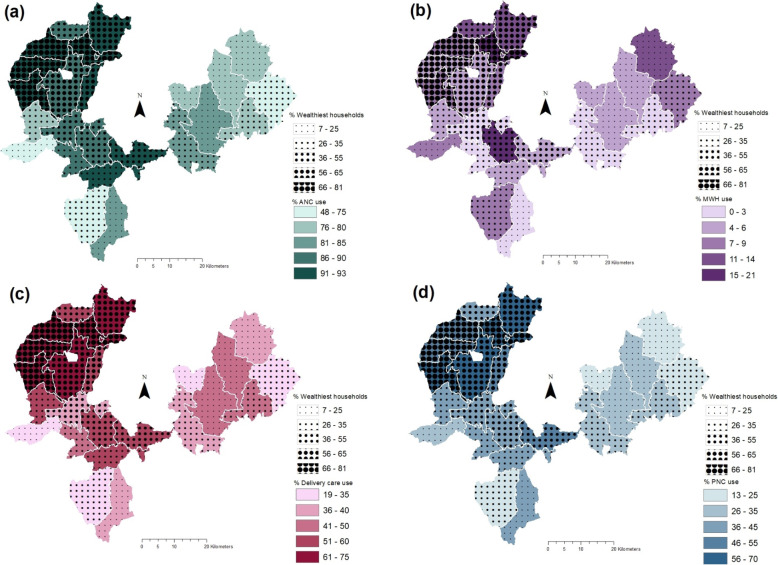
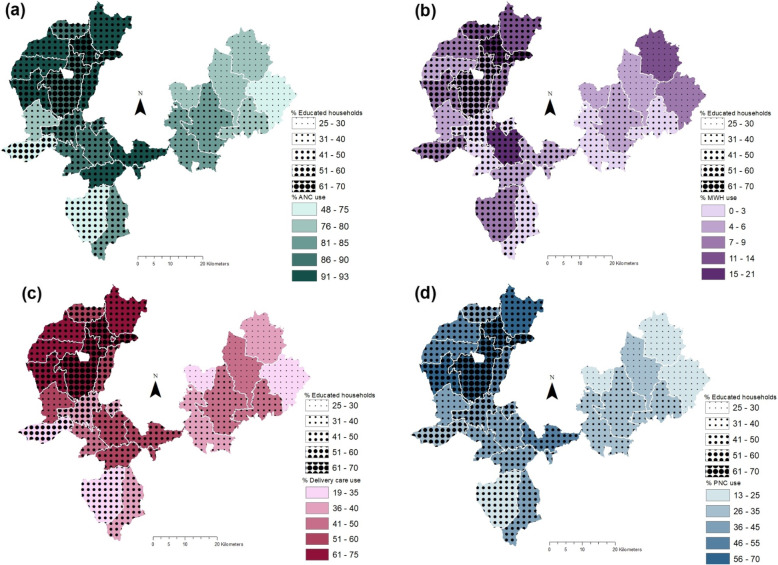
Methods: Using survey data from 3758 households enrolled in a cluster randomized trial geographical variation in the use of maternity waiting homes (MWH), antenatal care (ANC), delivery care and postnatal care (PNC) was investigated in three districts in Jimma Zone. Correlations of service use with education and wealth levels were also explored among 24 health centre catchment areas using choropleth maps. Global spatial autocorrelation was assessed using Moran's I. Cluster analyses were performed at village and household levels using Getis Ord Gi* and Kulldorf spatial scan statistics to identify cluster locations.
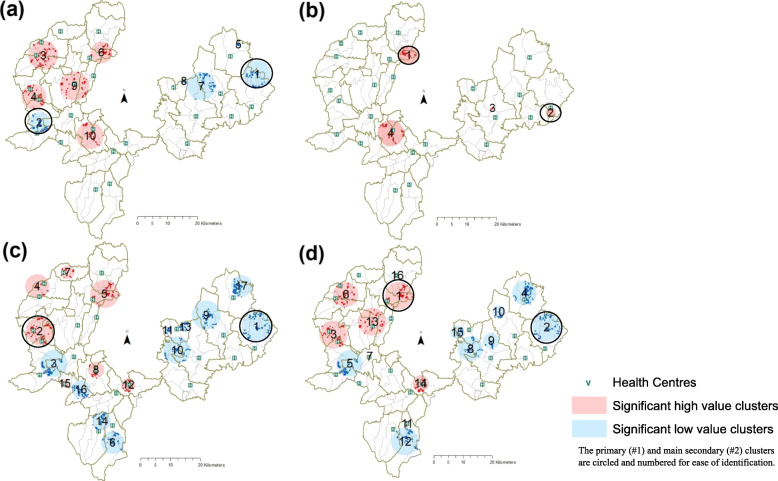
Results: Significant global spatial autocorrelation was present in ANC use (Moran's I = 0.15, p value = 0.025), delivery care (Moran's I = 0.17, p value = 0.01) and PNC use (Moran's I = 0.31, p value < 0.01), but not MWH use (Moran's I = -0.005, p value = 0.94) suggesting clustering of villages with similarly high (hot spots) and/or low (cold spots) service use. Hot spots were detected in health centre catchments in Gomma district while Kersa district had cold spots. High poverty or low education catchments generally had low levels of service use, but there were exceptions. At village level, hot and cold spots were detected for ANC, delivery care and PNC use. Household-level analyses revealed a primary cluster of elevated MWH-use not detected previously. Further investigation of spatial heterogeneity is warranted.
Conclusions: Sub-national variation in maternal healthcare services exists in Jimma Zone. There was relatively higher poverty and lower education in areas where service use cold spots were identified. Re-directing resources to vulnerable sub-groups and locations lagging behind will be necessary to ensure equitable progress in maternal health.
Keywords: Clusters; Equity; Ethiopia; Maternal health service use; Spatial analysis; Sub-national data.
Conflict of interest statement
The authors declare that they have no competing interests.
Figures

References
-
- Central Statistical Agency (CSA) [Ethiopia] and ICF. 2016. Ethiopia Demographic and Health Survey 2016. Addis Ababa, Ethiopia, and Rockville, Maryland, USA: CSA and ICF. https://dhsprogram.com/publications/publication-FR328-DHS-Final-Reports.cfm.
MeSH terms
Grants and funding
LinkOut - more resources
Full Text Sources
Medical
