. 2020 Jul 31;5(49):eaat7117.
doi: 10.1126/sciimmunol.aat7117.

Gut T cell-independent IgA responses to commensal bacteria require engagement of the TACI receptor on B cells

Affiliations

Gut T cell-independent IgA responses to commensal bacteria require engagement of the TACI receptor on B cells

E K Grasset et al. Sci Immunol. .

Abstract

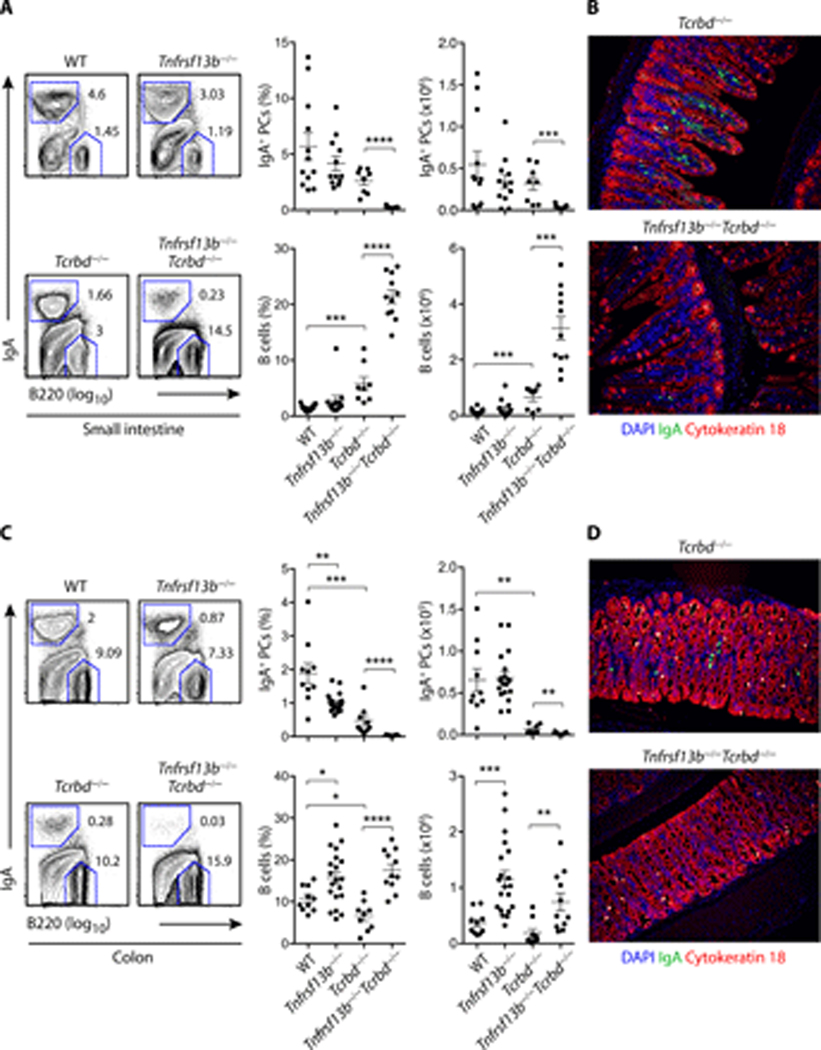
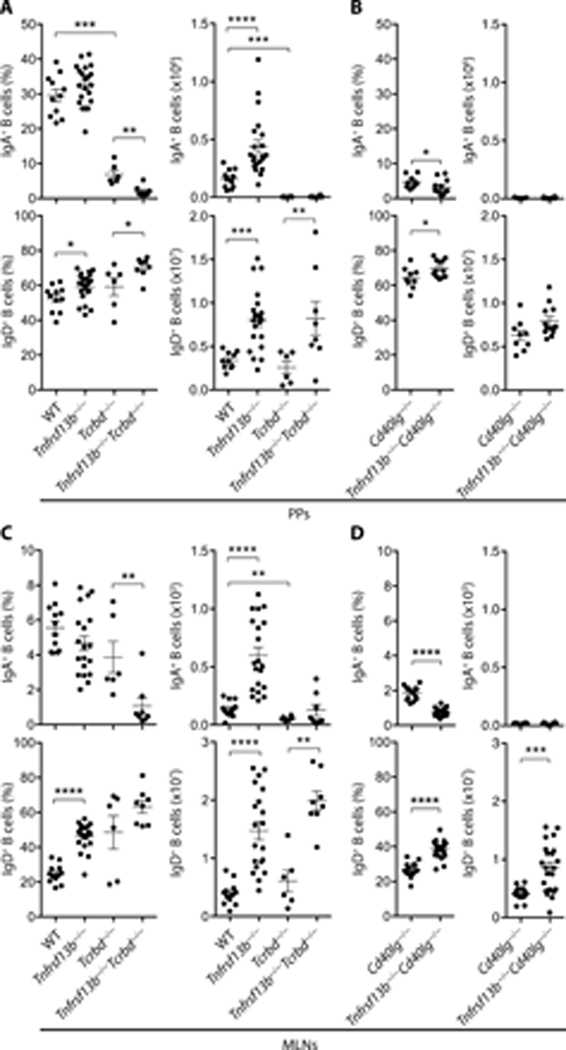
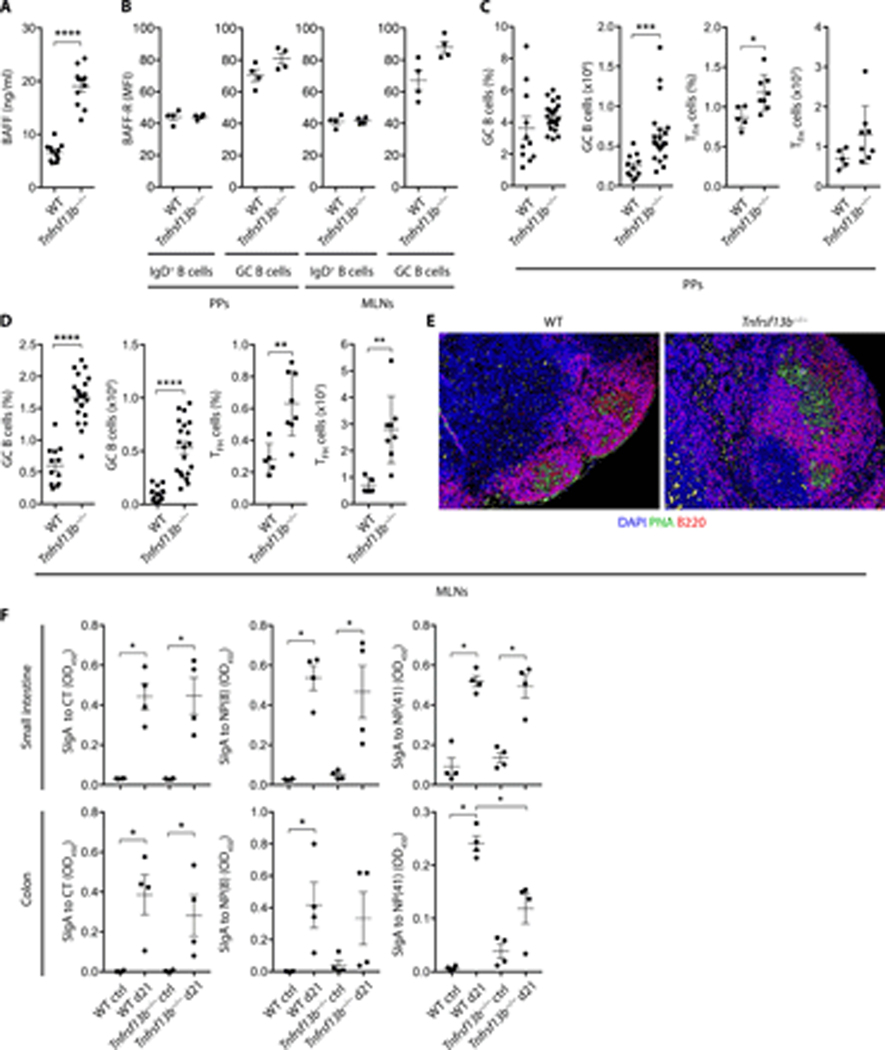
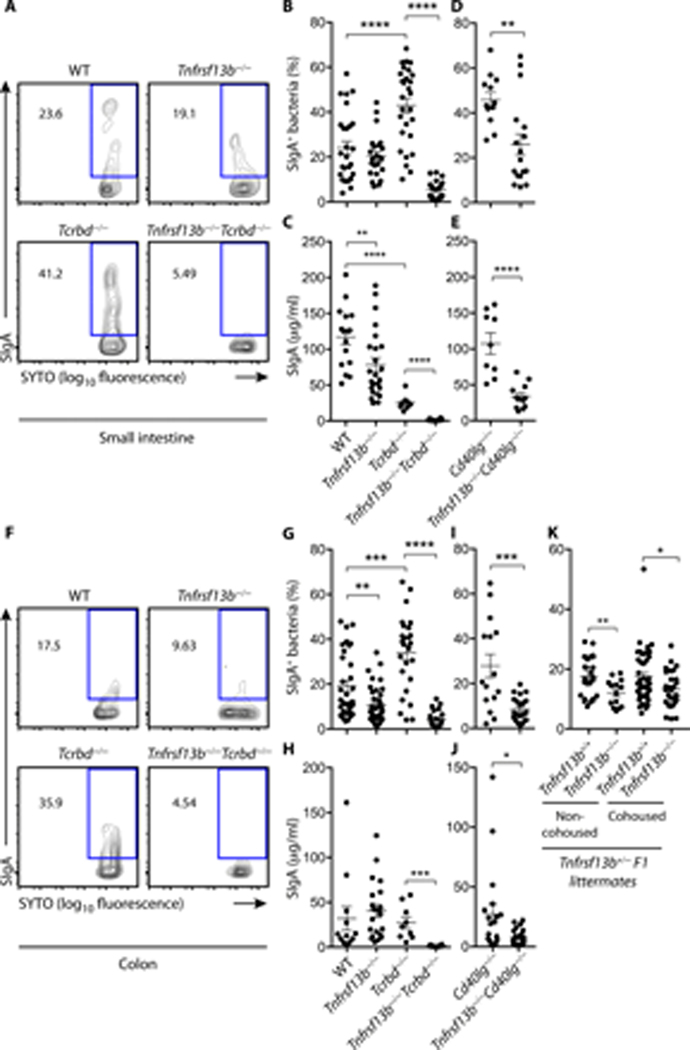
The gut mounts secretory immunoglobulin A (SIgA) responses to commensal bacteria through nonredundant T cell-dependent (TD) and T cell-independent (TI) pathways that promote the establishment of mutualistic host-microbiota interactions. SIgAs from the TD pathway target penetrant bacteria, and their induction requires engagement of CD40 on B cells by CD40 ligand on T follicular helper cells. In contrast, SIgAs from the TI pathway bind a larger spectrum of bacteria, but the mechanism underpinning their production remains elusive. Here, we show that the intestinal TI pathway required CD40-independent B cell-activating signals from TACI, a receptor for the innate CD40 ligand-like factors BAFF and APRIL. TACI-induced SIgA responses targeted a fraction of the gut microbiota without shaping its overall composition. Of note, TACI was dispensable for TD induction of IgA in gut-associated lymphoid organs. Thus, BAFF/APRIL signals acting on TACI orchestrate commensal bacteria-specific SIgA responses through an intestinal TI program.


Figures

Figure 1.
Figure 1.
TACI drives homeostatic induction of IgA class-switched PCs through intestinal TI but not TD pathways. (A) Flow cytometric analysis of frequency (% of live) and absolute number of B220IgA+ PCs and B220+IgA B cells from the small intestine lamina propria of control WT or Tnfrsf13b/, Tcrbd/ and Tnfrsf13b/Tcrbd/ mice. Left: representative flow cytometric contour plots. Numbers indicate cell frequency. Right: summary of multiple independent experiments. (B) IFA of small intestine from Tcrbd/ and Tnfrsf13b/Tcrbd/ mice stained for IgA (green), cytokeratin 18 (red) and counterstained with DNA-binding 4',6-diamidino-2-phenylindole (DAPI, blue), which labels nuclei. (C-D) Results from the colon lamina propria obtained through experimental settings identical to those depicted in (A) and (B). Flow cytometry plots show data representative of the mean (A, C, left panels) or pooled 2–4 independent experiments from 8 to 21 (A, C, right panels) 9–17-week-old mice or show one representative experiment of at least two yielding similar results (B, D). Error bars, s.e.m.; * p < 0.05, ** p < 0.01, *** p < 0.001, **** p < 0.0001 (two-tailed Student’s t test for normally distributed data and Mann-Whitney U test for other data).
Figure 2.
Figure 2.
TACI drives homeostatic induction of IgA class-switched PCs through an intestinal GC-independent pathway. (A) Flow cytometric analysis of frequency (% of live) and absolute number of B220IgA+ PCs and B220+IgA B cells from the small intestine lamina propria of Cd40lg/ and Tnfrsf13b/Cd40lg/ mice. (B) IgA+ PCs and B cells from the colon lamina propria of Cd40lg/ and Tnfrsf13b/Cd40lg/ mice. Data shown pooled from 2 independent experiments from 9 to 12 mice that were 13–15-week-old. Error bars, s.e.m.; * p < 0.05, ** p < 0.01, *** p <0.001 (two-tailed Student’s t test for normally distributed data and Mann-Whitney U test for other data).
Figure 3.
Figure 3.
TACI does not regulate TD induction of IgA in gut-associated lymphoid tissue. (A-D) Flow cytometric analysis of frequency and absolute numbers of IgA class-switched IgDB220+IgA+ B cells (% of IgDB220+ cells) and unswitched IgD+B220+ B cells (% of live cells) from (A-B) PPs or (C-D) MLNs of WT, Tnfrsf13b/, Tcrbd/, Tnfrsf13b/Tcrbd/, Cd40lg/ or Tnfrsf13b/Cd40l/ mice. Data summarize 2–4 independent experiments from 6 to 22 mice that were 9–17-week-old. Error bars, s.e.m.; * p < 0.05, ** p < 0.01, *** p < 0.001, **** p < 0.0001 (two-tailed Student’s t test for normally distributed data and Mann-Whitney U test for other data).
Figure 4.
Figure 4.
TACI modulates B cell and TFH cell numbers but not IgA affinity in gut GCs. (A) Plasma BAFF ELISA of WT or Tnfrsf13b/ mice. (B-D) Flow cytometric analysis of PPs and MLNs of WT or Tnfrsf13b/ mice of (B) BAFF-R on IgD+B220+ and IgDB220+GL7+CD95+ GC B cells, MFI, median fluorescence intensity, (C-D) frequency (% of live) and absolute numbers of GC B cells and TCRβ+CD4+PD-1highCXCR5high TFH cells. (E) IFA of MLNs from WT or Tnfrsf13b/ mice stained with peanut agglutinin (PNA, green), B220 (red) and DAPI (blue). (F) Cholera toxin (CT)- or NP-specific fecal SIgA ELISA from the small intestine or colon of WT or Tnfrsf13b/ mice orally immunized with NP-OVA and CT. Bovine serum albumin (BSA) haptenated with 8 or 41 NP epitopes (NP(8)-BSA or NP(41)-BSA) used to measure high- and low-affinity SIgA to NP, respectively. Ctrl, PBS-immunized mice. OD, optical density. Data summarize 2–4 independent experiments from 5 to 21 9–15-week-old mice (A, C-D) or one representative experiment of at least two (B, E) or one experiment (n=4) (F). Error bars, s.e.m.; * p < 0.05, ** p < 0.01, *** p < 0.001, **** p < 0.0001 (two-tailed Student’s t test or Mann-Whitney U test).
Figure 5.
Figure 5.
TACI deficiency does not perturb the prevailing TD clonal architecture of IgA+ PCs from adult mice. (A) Next generation sequencing (NGS) of the IgA VHDJH gene repertoire from the small intestine (SI) or colon lamina propria (LP) of WT or Tnfrsf13b/ mice. (B) NGS analysis of non-silent (replacement) and silent mutations targeting the FR1, CDR1, FR2, CDR2 and FR3 regions of IgA VHDJH genes from the SI or colon LP of WT or Tnfrsf13b/ mice. (C-E) NGS analysis of (C) clonal IgA VHDJH gene networks in the colon, (D) clonal IgA VHDJH gene diversity, and (E) clonal IgA VHDJH gene relatedness between the SI and colon LP of WT or Tnfrsf13b/ mice. (F) Fluorescent in situ hybridization analysis of the colon from WT or Tnfrsf13b/ mice stained with a fluorochrome-labeled universal eubacterial probe (red) and counterstained with DAPI (blue). Data summarize one experiment including 2 to 4 mice (A-B, D-E) that were 10–14-week-old or show one representative mouse (C) or experiment of two yielding similar results (F). Error bars, s.d. (A-B); horizontal bar, mean (D, E).
Figure 6.
Figure 6.
TACI drives TI homeostatic SIgA responses to the intestinal microbiota. (A-B, D, F-G, I, K) Flow cytometry of SIgA+SYTO+ bacteria from the small intestine (A-B, D) or colon (F-G, I, K) of WT, Tnfrsf13b/, Tcrbd/, Tnfrsf13b/Tcrbd/, Cd40lg/ or Tnfrsf13b/Cd40lg/ mice. Representative flow cytometric contour plots from (A) small intestinal or (F) colonic contents. Numbers indicate % of SIgA-coated bacteria. (B-D, G-I) graphs summarize 3–5 independent experiments involving 12 to 33 mice that were 6–13 week-old. ELISA of free SIgA from (C, E) small intestine or (H, J) colon feces from WT, Tnfrsf13b/, Tcrbd/, Tnfrsf13b/Tcrbd/, Cd40lg/ or Tnfrsf13b/Cd40lg/ mice. (K) Flow cytometry of SIgA+SYTO+ bacteria from non-cohoused and cohoused Tnfrsf13b+/+ and Tnfrsf13b/ littermates from Tnfrsf13b+/ breeders. Data pooled from 8–16-week-old mice from 2–5 independent experiments (n=14 to 47). Error bars, s.e.m. (B-E, G-K). * p < 0.05, ** p < 0.01, *** p < 0.001, **** p < 0.0001 (two-tailed Student’s t test for normally distributed data and Mann-Whitney U test for other data).
Figure 7.
Figure 7.
SIgAs from the TACI-controlled intestinal TI pathway do not affect microbiota richness and diversity in the presence of an intact CD40-controlled TD pathway. (A-B) Relative abundance of microbial phyla from the stool (A) or colon tissue-associated microbiota (colon) (B) of co-housed Tnfrsf13b+/+ or Tnfrsf13b/ mice from Tnfrsf13b+/ breeders. (C) Rarefaction plot comparing alpha-diversity of the microbiota from the stool or colon of Tnfrsf13b+/+ or Tnfrsf13b/ mice. (D) Principal component analysis of beta-diversity of the microbiota from the stool and colon of Tnfrsf13b+/+ or Tnfrsf13b/ mice. Data show one experiment including 8–9-week-old mice co-housed littermates from Tnfrsf13b+/ breeders (Tnfrsf13b+/+ n=27, Tnfrsf13b/ n=20). Error bars, s.e.m.. * p < 0.05 (Wilcoxon rank sum test).

References

    1. Fagarasan S, Kawamoto S, Kanagawa O, Suzuki K, Adaptive immune regulation in the gut: T cell-dependent and T cell-independent IgA synthesis. Annu Rev Immunol 28, 243 (2010). - PubMed
    1. Kubinak JL, Round JL, Do antibodies select a healthy microbiota? Nat Rev Immunol 16, 767 (2016). - PMC - PubMed
    1. Nakajima A, Vogelzang A, Maruya M, Miyajima M, Murata M, Son A, Kuwahara T, Tsuruyama T, Yamada S, Matsuura M, Nakase H, Peterson DA, Fagarasan S, Suzuki K, IgA regulates the composition and metabolic function of gut microbiota by promoting symbiosis between bacteria. J Exp Med 215, 2019 (2018). - PMC - PubMed
    1. Macpherson AJ, Yilmaz B, Limenitakis JP, Ganal-Vonarburg SC, IgA Function in Relation to the Intestinal Microbiota. Annu Rev Immunol 36, 359 (2018). - PubMed
    1. Hapfelmeier S, Lawson MA, Slack E, Kirundi JK, Stoel M, Heikenwalder M, Cahenzli J, Velykoredko Y, Balmer ML, Endt K, Geuking MB, Curtiss R 3rd, McCoy KD, Macpherson AJ, Reversible microbial colonization of germ-free mice reveals the dynamics of IgA immune responses. Science 328, 1705 (2010). - PMC - PubMed

Publication types

Substances