. 2020 Aug 18;117(33):19694-19704.
doi: 10.1073/pnas.1920263117. Epub 2020 Jul 31.

Eco-evolutionary control of pathogens

Affiliations

Eco-evolutionary control of pathogens

Michael Lässig et al. Proc Natl Acad Sci U S A. .

Abstract

Control can alter the eco-evolutionary dynamics of a target pathogen in two ways, by changing its population size and by directed evolution of new functions. Here, we develop a payoff model of eco-evolutionary control based on strategies of evolution, regulation, and computational forecasting. We apply this model to pathogen control by molecular antibody-antigen binding with a tunable dosage of antibodies. By analytical solution, we obtain optimal dosage protocols and establish a phase diagram with an error threshold delineating parameter regimes of successful and compromised control. The solution identifies few independently measurable fitness parameters that predict the outcome of control. Our analysis shows how optimal control strategies depend on mutation rate and population size of the pathogen, and how monitoring and computational forecasting affect protocols and efficiency of control. We argue that these results carry over to more general systems and are elements of an emerging eco-evolutionary control theory.

Keywords: biophysics; control theory; immune systems; population genetics.


Conflict of interest statement

The authors declare no competing interest.

Figures
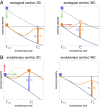
Fig. 1.
Fig. 1.
Modes and leverage of eco-evolutionary control. A pathogen population with mean trait Γ under control with amplitude ζ lives in a free fitness landscape ψp(Γ,ζ) (orange lines), which is the sum of a background component ψb(Γ) (blue lines) and a control landscape fc(Γ,ζ). An evolutionary path from the wild type Γwt to an optimal evolved state Γe* involves the control leverage Θc=2Npe[fc(Γe*,ζ)fc(Γwt,ζ)] (orange arrows) and a change in background free fitness, Θb=ψb(Γe*)ψb(Γwt) (blue arrows). (A) Ecological control, starting from an uncontrolled wild-type pathogen (blue dots), has the objective of reducing the pathogen’s carrying capacity (green arrows)—here by antibody binding—and the collateral effect of resistance evolution (red arrows). SC (Θc+Θb<0) suppresses the evolution of resistance and generates a stable wild type (orange dot; i.e., the reverse path from Γe* to Γwt fulfils the minimum-leverage condition [5]). WC (Θc+Θb>0) triggers the evolution of resistance (orange circle). (B) Evolutionary control has the objective of eliciting a new pathogen trait (green arrow) and the collateral of increasing its carrying capacity (red arrow). Dynamical control elicits the evolved trait along a path of positively selected trait increments, which requires elevated transient control amplitudes (dotted orange line). SC (Θc+Θb>0) generates a stable evolved trait (orange dot; i.e., the path from Γwt to Γe* fulfils the minimum-leverage condition [5]). WC (Θc+Θb<0) cannot elicit an evolved state (or triggers a reversal to the wild type).
Fig. 2.
Fig. 2.
Fitness and payoff landscapes of pathogen control. (A and B) Ecological control and (C and D) evolutionary control. Pathogen fitness fp (A and C) and host payoff ψh (B and D) are shown as functions of the log control amplitude (antibody dosage), logζ, and the pathogen trait, G. Specific control loci: pathogen fitness minimum (dotted), pathogen fitness maxima (stable: solid; metastable: dashed; stability switch: horizontal lines), computational equilibrium control (logζ*,G*) (dots), Nash equilibrium of evolutionary control, (logζ,G) (circles). Model parameters: fp,0=1,qph=1/qph=0.9,cp=0.09,ch=0.001 (ecological control); fp,0=1,qph=0.9,qhp=5/9,cp=0.09,ch=5 (evolutionary control).
Fig. 3.
Fig. 3.
Phase diagrams of stationary control. (A) Ecological control and (B) evolutionary control. The control efficiency η* is shown as a function of the (scaled) cost parameters cp and ch. A yellow line marks the error threshold ch(cp) between WC and SC.
Fig. 4.
Fig. 4.
Control dynamics. (A–C) Ecological control by instantaneous-update protocols. (A) Control paths (Γ,ζ) generated by local deterministic (dashed orange) and greedy (solid orange) control dynamics. These paths start with a pathogen escape mutation (gray square) and converge to the optimal stationary protocol (Γ*,ζ*) (red dot), which is a computational and a Nash equilibrium. (B) Time-dependent pathogen fitness, fp(t), and host payoff, ψh(t), of these control paths. (C) Pathogen flux, Θp(t), and host flux, Θh(t). Both fluxes are monotonically increasing functions of the path coordinate Γ(t). (D–G) Evolutionary control for adaptive trait formation. (D) Deterministic computational control path in the SC regime (orange line). This path maximizes the score Ω(Γ,ζ) for given values of the speed parameter and of the pathogen sequence diversity (here λ=0, θ=1) (SI Appendix, Fig. S3). The initiation phase (ΓGin) with a gain-of-function mutation (gray square) is followed by a breeding phase (Γ>Gin); the path converges to the optimal stationary protocol (red dot), which is a computational but not a Nash equilibrium. (E) Pathogen fitness, fp(t), and host payoff, ψh(t), along the computational control path. (F) Fluxes Θp(t) and Θh(t) as functions of the path coordinate Γ(t). This path has negative increments of the host flux (Θ/Γ<0) at the start and in the final segment. (G) Cost of adaptation, (ΔΩ) (orange), and initial gain-of-function trait, Gin (blue), of the maximum-score computational protocol as a function of the pathogen diversity, θ for λ=0. (H–K) Metastable ecological control. (H) Time-dependent protocol ζ(t) with baseline dosage ζbase, boost dosage ζres, and boost duration Tres (orange); pathogen escape mutant frequency x(t) (blue) using a detection threshold x(t)>0.05 to initiate rescue boost (dashed line). (I) Pathogen mean fitness, f¯p(t), and host payoff, ψh(t). (J) Fluxes, Θp(t) and Θh(t). (K) Efficiency of maximum-score metastable protocols, ηms (orange), as a function of the pathogen diversity, θ, together with the efficiency of the optimal stationary protocol, η* (red dashed). For θ<θc, metastable control outperforms stationary control. Parameters: ϵ0=1, others as in Fig. 2.

References

    1. Perelson A. S., et al. , HIV-1 dynamics in vivo: Virion clearance rate, infected cell life-span, and viral generation time. Science 271, 1582–1586 (1996). - PubMed
    1. Schoener T. W., The newest synthesis: Understanding ecological dynamics. Science 331, 426–429 (2011). - PubMed
    1. Carroll S. P., et al. , Applying evolutionary biology to address global challenges. Science 346, 1245993 (2014). - PMC - PubMed
    1. Read A. F., Day T., Huijben S., The evolution of drug resistance and the curious orthodoxy of aggressive chemotherapy. Proc. Natl. Acad. Sci. 108, 10871–10877 (2011). - PMC - PubMed
    1. Gatenby R. A., et al. , Adaptive therapy. Cancer Res 69, 4894–4903 (2010). - PMC - PubMed

Publication types

LinkOut - more resources