. 2020 Jul 31;11(1):3839.
doi: 10.1038/s41467-020-17551-4.

Symmetric neural progenitor divisions require chromatin-mediated homologous recombination DNA repair by Ino80

Affiliations

Symmetric neural progenitor divisions require chromatin-mediated homologous recombination DNA repair by Ino80

Jason M Keil et al. Nat Commun. .

Abstract

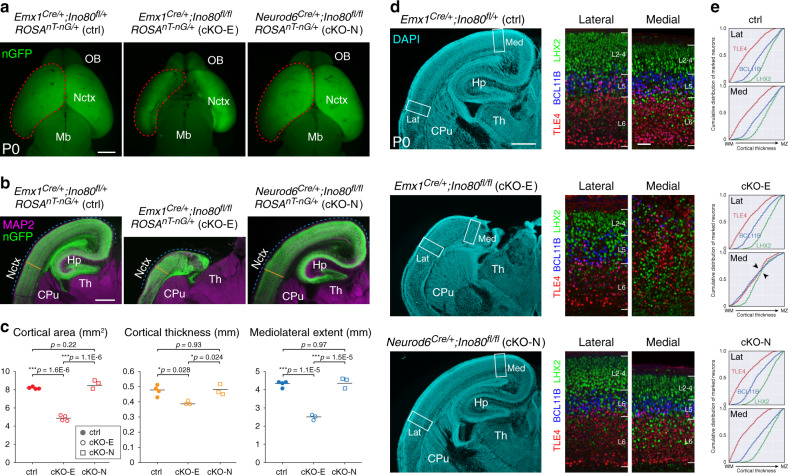
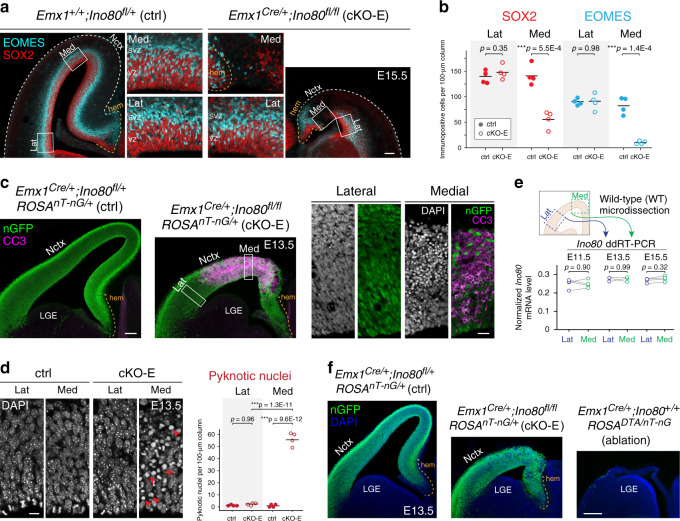
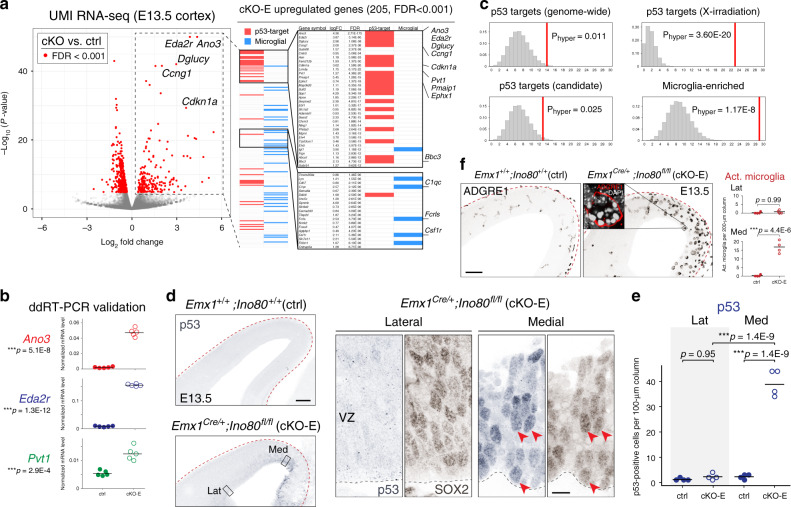
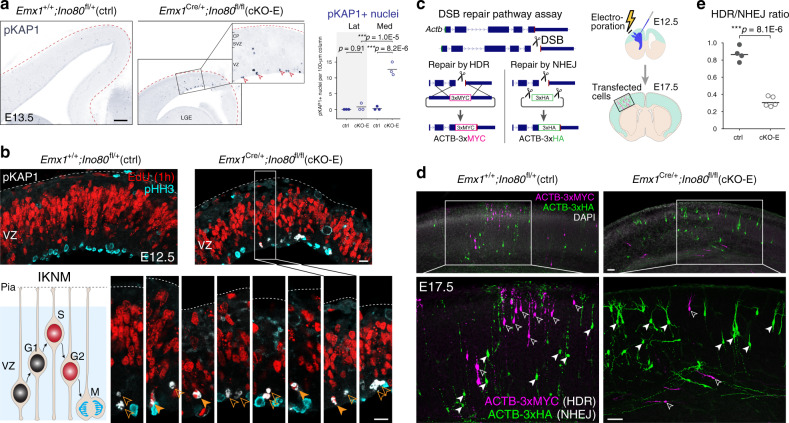
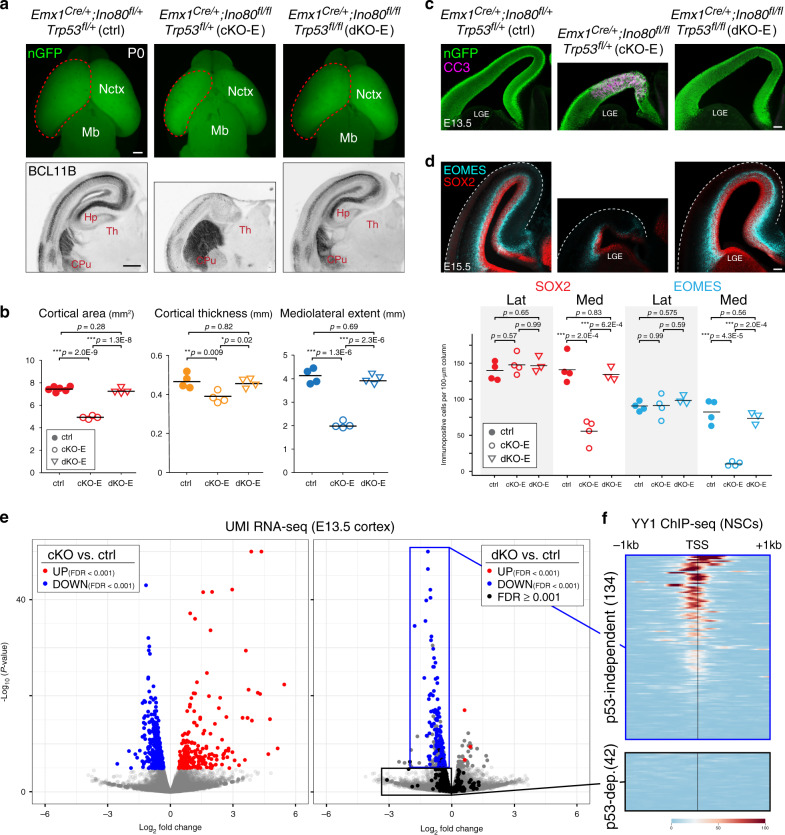
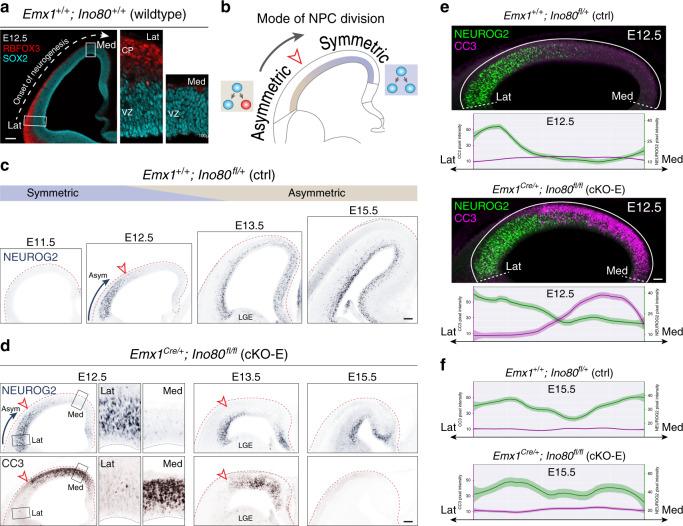
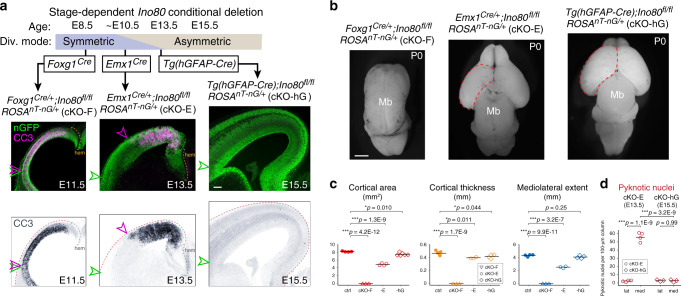
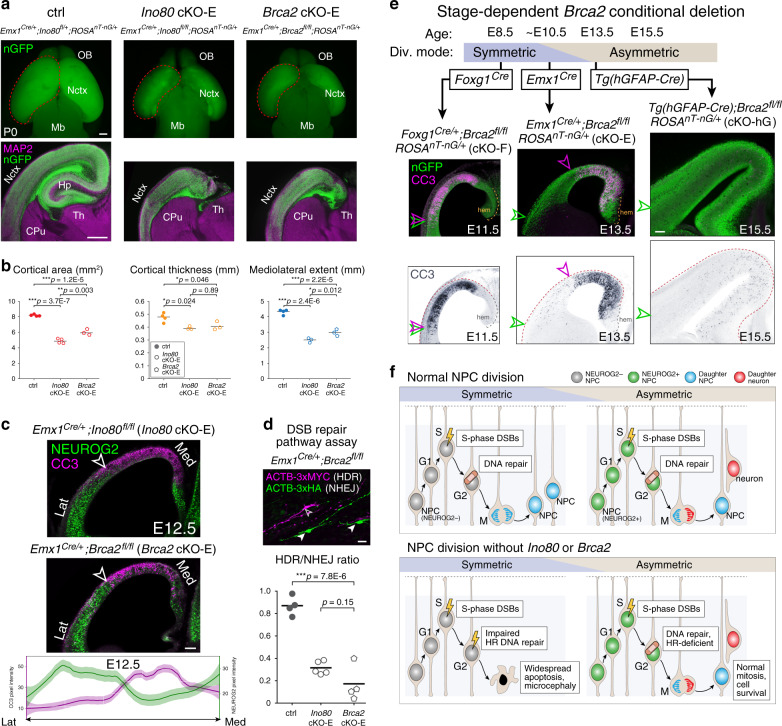
Chromatin regulates spatiotemporal gene expression during neurodevelopment, but it also mediates DNA damage repair essential to proliferating neural progenitor cells (NPCs). Here, we uncover molecularly dissociable roles for nucleosome remodeler Ino80 in chromatin-mediated transcriptional regulation and genome maintenance in corticogenesis. We find that conditional Ino80 deletion from cortical NPCs impairs DNA double-strand break (DSB) repair, triggering p53-dependent apoptosis and microcephaly. Using an in vivo DSB repair pathway assay, we find that Ino80 is selectively required for homologous recombination (HR) DNA repair, which is mechanistically distinct from Ino80 function in YY1-associated transcription. Unexpectedly, sensitivity to loss of Ino80-mediated HR is dependent on NPC division mode: Ino80 deletion leads to unrepaired DNA breaks and apoptosis in symmetric NPC-NPC divisions, but not in asymmetric neurogenic divisions. This division mode dependence is phenocopied following conditional deletion of HR gene Brca2. Thus, distinct modes of NPC division have divergent requirements for Ino80-dependent HR DNA repair.


Conflict of interest statement

The authors declare no competing interests.

Figures

Fig. 1
Fig. 1. Microcephaly and disrupted medial corticogenesis following Ino80 deletion from NPCs.
a Dorsal view of whole-mount P0 control (ctrl) and Ino80 conditional mutant (cKO) brains. Nuclear (n)GFP (green) was expressed Cre-dependently from ROSAnT-nG. Emx1Cre-mediated Ino80 deletion from cortical NPCs (cKO-E) led to microcephaly, whereas Neurod6Cre-mediated Ino80 deletion from postmitotic excitatory neurons (cKO-N) did not. Sample measurements of cortical area (red) quantified in c are indicated (ctrl: n = 4, cKO-E: n = 4, cKO-N: n = 3 animals). OB olfactory bulb, Nctx neocortex, Mb midbrain. b MAP2 (magenta) and nGFP (green) immunostaining of coronal P0 brain sections. cKO-E, but not cKO-N, was characterized by microcephaly and severe hippocampal hypoplasia. Sample measurements of cortical thickness (yellow) and mediolateral extent (blue) quantified in c are indicated (ctrl: n = 4, cKO-E: n = 3, cKO-N: n = 3 animals). CPu caudate putamen, Hp hippocampus, Th thalamus. c Cortical area (red), thickness (yellow), and mediolateral extent (blue) were each significantly decreased in cKO-E, but not cKO-N, compared with ctrl (data are mean, one-way ANOVA with Tukey’s post hoc test, Cortical area, ctrl: n = 4, cKO-E: n = 4, cKO-N: n = 3 animals, thickness and mediolateral extent, ctrl: n = 4, cKO-E: n = 3, cKO-N: n = 3 animals). d DAPI staining (cyan) of coronal P0 sections revealed altered lamination of medial neocortex and severe hypoplasia of hippocampus in cKO-E (n = 3 animals). Analyzed by marker immunostaining (insets), the lamination of LHX2 + (L2-5, green), BCL11B + (L5, blue), and TLE4 + (L6, red) neurons was correctly ordered in lateral (Lat) neocortex of cKO-E, but severely disrupted in medial (Med) neocortex. In cKO-N, normal lamination was present in medial and lateral neocortex. e, Analysis of cumulative distribution of layer marker-expressing neurons through thickness of cortex from white matter (WM) to marginal zone (MZ) revealed disrupted lamination in medial cKO-E cortex (n = 3 animals). Scale bar: 1 mm in a; 500 μm in b, d; 50 μm in d inset.
Fig. 2
Fig. 2. Selective loss of medial NPCs to apoptosis following Ino80 deletion.
a, b NPC marker immunostaining of coronal E15.5 sections revealed significant loss of SOX2 + apical progenitors (red) and EOMES + intermediate progenitors (cyan) in medial, but not lateral, cKO-E neocortex compared with ctrl (data are mean, two-tailed unpaired t test, n = 4 animals). NPC marker expression was unaffected in cortical hem in cKO-E. VZ ventricular zone, SVZ subventricular zone. c Cleaved Caspase 3 (CC3) immunostaining (magenta) of coronal E13.5 sections showed extensive apoptosis in medial, but not lateral, cKO-E neocortex. Cre-dependent expression of nGFP (green) from ROSAnT-nG was present in both medial and lateral cKO-E neocortex (n = 3 animals). DAPI staining (inset, white) revealed pyknotic nuclei, another marker of apoptosis, in medial, but not lateral, cKO-E neocortex. Neither CC3 immunostaining nor pyknotic nuclei were increased in cKO-E cortical hem. LGE lateral ganglionic eminence. d At E13.5, pyknotic nuclei (red arrowheads) were significantly increased in medial, but not lateral, cKO-E neocortex compared with ctrl (data are mean, ANOVA with Tukey’s post hoc test, n = 4 animals). e Quantitative analysis of Ino80 mRNA expression in wild-type (WT) embryonic neocortex by droplet digital (dd)RT-PCR revealed consistent Ino80 expression in lateral and medial neocortex at E11.5, E13.5, and E15.5 (data are mean, two-tailed paired t test, E11.5: n = 4, E13.5: n = 3, E15.5: n = 4 animals). f, Comparison of ctrl, cKO-E, and Emx1Cre;ROSADTA/nT-nG E13.5 cortex (n = 3 animals). In ctrl, Cre-dependent nGFP reporter (green) expression was present in both medial and lateral neocortex, and cortical hem. Similarly, in cKO-E, nGFP was present in both medial neocortex affected by apoptosis, and lateral neocortex unaffected by apoptosis. In Emx1Cre;ROSADTA/nT-nG, both medial and lateral neocortex, as well as cortical hem, were extensively ablated by Cre-dependent expression of DTA, consistent with uniform Emx1Cre activity throughout the cortex. Scale bar: 100 μm in a, c; 20 μm in c inset; 10 μm in d; 200 μm in f.
Fig. 3
Fig. 3. p53 and microglial activation in medial cortex following Ino80 deletion.
a Volcano plot of unique molecular identifier (UMI) RNA-seq comparing E13.5 cortex of cKO-E (n = 5 animals) with ctrl (n = 7 animals). For each gene, P value was calculated with likelihood ratio tests and false discovery rate (FDR) was calculated using the Benjamini–Hochberg procedure. Differentially expressed genes (FDR < 0.001) are indicated by red dots. Of the 205 significantly upregulated genes in cKO-E, 36 are known p53 targets (red bars) and 31 are expressed selectively in microglia (blue bars). b ddRT-PCR validated significant upregulation of p53-target genes Ano3, Eda2r, and Pvt1 in cKO-E compared with ctrl E13.5 cortex (data are mean, two-tailed unpaired t test, n = 5 animals). c Intersectional analysis of the 205 upregulated genes in cKO-E revealed significant enrichment of p53 targets and microglia genes. The distribution of random overlap is shown in histogram, and the observed overlap is indicated by vertical red line (hypergeometric test, Bonferroni correction, α = 0.0125). The subset of p53-target genes upregulated by X-irradiation-induced DSBs were especially overrepresented in cKO-E-upregulated genes. d, e p53 immunostaining (blue) revealed significant increase in the number of p53-positive cells in medial, but not lateral, cKO-E E13.5 neocortex compared with ctrl (data are mean, one-way ANOVA with Tukey’s post hoc test, n = 4 animals). p53 activation was present in SOX2 + (brown) NPCs (solid arrowheads) in cKO-E. f ADGRE1 (F4/80) immunostaining revealed an increase in morphologically activated (Act.) microglia in medial, but not lateral, cKO-E neocortex at E13.5 (data are mean, two-tailed unpaired t test, n = 4 animals). ADGRE1 + microglia (red, inset) phagocytosed numerous pyknotic nuclei labeled by DAPI (white). Scale bar: 100 μm in d, f; 10 μm in d inset.
Fig. 4
Fig. 4. Impaired HR DNA repair and unrepaired DSBs following Ino80 deletion.
a Immunostaining for DSB marker pKAP1 (blue) revealed a significant increase in unrepaired DSBs in medial, but not lateral, E13.5 cKO-E neocortex (data are mean, one-way ANOVA with Tukey’s post hoc test, n = 3 animals). A majority of pKAP1 + nuclei in cKO-E were positioned near the ventricular surface (open arrowheads). CP cortical plate. b Analysis of S-phase NPCs by 1-h pulse of thymidine analog EdU (red), M-phase NPCs by phospho-H3 (pHH3) immunostaining (cyan), and DSBs by pKAP1 immunostaining (white) in E12.5 cortex. NPCs undergo interkinetic nuclear migration (IKNM) and their nuclear position in distinct phases of the cell cycle is depicted in the schematic. pKAP1 staining revealed unrepaired DSBs in 1-h EdU-positive (solid arrowheads, S-phase) and EdU-negative (open arrowheads, post-S-phase) cells near the ventricular surface. Ventricular pKAP1 staining did not colocalize with pHH3, suggesting that NPCs with unrepaired DSBs did not progress successfully into mitosis. c Schematic illustration of in vivo DSB repair assay. A genomic DSB is induced by CRISPR–Cas9 within the coding region of Actb near the C terminus. Two reporter repair templates were designed such that repair of the DSB by HDR would lead to in-frame expression of ACTB-3xMYC, whereas repair by NHEJ would lead to expression of ACTB-3xHA. CRISPR–Cas9 and reporter repair constructs were co-transfected into cortical NPCs at E12.5 by in utero electroporation (IUE). Electroporated brains were analyzed at E17.5. d, e In electroporated E17.5 brains, MYC tag-labeled cells (magenta) have undergone HDR of the Actb DSB (open arrowheads), whereas HA tag-labeled cells (green) have undergone NHEJ repair (solid arrowheads). Quantification of HDR/NHEJ ratio demonstrated a significant decrease in HDR relative to NHEJ in cKO-E cortex compared with ctrl (data are mean, two-tailed unpaired t test, ctrl: n = 4, cKO-E: n = 5 animals, > 100 cells per animal). Scale bar: 100 μm in a; 10 μm in b; 50 μm in d.
Fig. 5
Fig. 5. Trp53 co-deletion rescued Ino80 phenotypes and revealed mechanistically distinct Ino80 roles.
a Dorsal view of P0 whole-mount brains and BCL11B immunostaining (black) of P0 coronal sections. Co-deletion of Trp53 with Ino80 (dKO-E) rescued major Ino80 deletion (cKO-E) phenotypes, including microcephaly, severe hippocampal hypoplasia, and disrupted neocortical lamination. Sample measurements quantified in b are indicated (ctrl cortical area: n = 6, all other measurements: n = 4 animals). b Cortical area (red), thickness (yellow), and mediolateral extent (blue) were restored in dKO-E and not significantly different compared with ctrl (data are mean, one-way ANOVA with Tukey’s post hoc test, ctrl cortical area: n = 6, all other measurements: n = 4 animals). c CC3 immunostaining (magenta) revealed no increase in apoptosis in dKO-E E13.5 neocortex (n = 3 animals). d The number of SOX2 + (red) and EOMES + (cyan) NPCs in E15.5 dKO-E cortex were restored to levels not significantly different compared with ctrl (data are mean, one-way ANOVA with Tukey’s post hoc test, ctrl: n = 4, cKO-E: n = 4, dKO-E: n = 3 animals). e UMI RNA-seq volcano plots comparing cKO-E with ctrl, and dKO-E (n = 7 animals) with ctrl E13.5 cortex. In the cKO-E versus ctrl comparison (left panel), differentially regulated genes are indicated (upregulated, red dots; downregulated, blue dots). The same genes are labeled in the dKO-E versus ctrl comparison (right panel). Genes that remained differentially regulated (FDR < 0.001) following Trp53 co-deletion are indicated by dots of the same color. Genes that lost differential expression (FDR ≥ 0.001) are indicated by black dots. The vast majority of cKO-E-upregulated genes (202/205) were rescued by Trp53 co-deletion, indicating that their upregulation was p53-dependent. About one-third of cKO-E-downregulated genes (134/418), however, remained significantly downregulated in dKO-E, consistent with p53-independent gene regulation by Ino80. f Intersectional analysis of the 134 p53-independent downregulated genes with published ChIP-seq data from mouse neural stem cells (NSCs) revealed an enrichment of genes bound at their transcriptional start site (TSS) by transcription factor YY1, a known binding partner of INO80. This enrichment was absent from the 42 cKO-E downregulated genes that were reversed by Trp53 co-deletion. Scale bar: 500 μm in a; 100 μm in c, d.
Fig. 6
Fig. 6. Spatiotemporal correlation of Ino80 cKO-E apoptosis with mode of NPC division.
a At the onset of cortical neurogenesis, the mode of NPC division transitions from symmetric NPC–NPC to asymmetric neurogenic in a lateral–rostral first, medial–caudal last manner along the transverse neurogenetic gradient (TNG). In wild-type E12.5 coronal section, lateral neocortex was characterized by a cortical plate (CP) formed by several rows of RBFOX3 + (red) postmitotic neurons, indicating that the SOX2 + (cyan) NPCs in lateral VZ had transitioned to asymmetric neurogenic divisions. In medial neocortex, the CP was not developed, indicating that medial NPCs had not initiated asymmetric neurogenic divisions (n = 3 animals). b The progression of the TNG is illustrated in schematic. c Neurogenic NPC marker NEUROG2 immunostaining (blue) of ctrl coronal sections. At E11.5, NPCs were largely NEUROG2-negative and divided symmetrically. At E12.5, NEUROG2 staining was present in lateral, but not medial, NPCs, consistent with progression of the TNG. At E13.5, neurogenesis had progressed more medially, and by E15.5, neurogenic NPCs were present throughout the mediolateral extent of the neocortex (n = 3 animals). d NEUROG2 (blue) and CC3 (brown) immunostaining of cKO-E coronal sections. In E12.5 and E13.5 cKO-E cortex, lateral NPCs underwent asymmetric (Asym) neurogenic divisions (NEUROG2+) and were not apoptotic (CC3–), whereas medial NPCs underwent symmetric divisions (NEUROG2–) and were robustly apoptotic (CC3+). At E15.5, when NPCs had largely transitioned to asymmetric neurogenic divisions (NEUROG2+), they no longer underwent apoptosis (n = 3 animals). e Analysis of immunofluorescent pixel intensity from lateral (Lat) to medial (Med) E12.5 cortex revealed complementary gradients of asymmetric neurogenic divisions (NEUROG2, green) and apoptosis (CC3, magenta) in cKO-E (data are LOESS curve ± 99% confidence interval, n = 3 animals). f Analysis of immunofluorescent pixel intensity revealed asymmetric neurogenic divisions throughout the mediolateral extent of the E15.5 cortex, and no additional apoptosis in cKO-E (data are LOESS curve ± 99% confidence interval, n = 3 animals). Scale bar: 100 μm in a, c, d; 50 μm in e.
Fig. 7
Fig. 7. Systematic deletion of Ino80 from NPCs pre-, peri-, and post transition to asymmetric division.
a Ino80 was systematically deleted from NPCs pre-, peri-, and post transition from symmetric to asymmetric division (Div.). Cre-dependent nGFP reporter (green) was expressed from ROSAnT-nG. Foxg1Cre deletion of Ino80 (cKO-F) during exclusively symmetric NPC–NPC divisions led to widespread CC3 staining (magenta in overlay, blue in monochrome) throughout the mediolateral axis of E11.5 cortex. The lateral extent of apoptosis (magenta arrowhead) reached the lateral extent of the neocortex (green arrowhead). Emx1Cre deletion of Ino80 (cKO-E) near the onset of transition between symmetric and asymmetric divisions led to robust apoptosis in medial, but not lateral, neocortex. Tg(hGFAP-Cre) deletion of Ino80 (cKO-hG) after most NPCs transitioned to asymmetric neurogenic division did not lead to an increase in apoptosis (n = 3 animals). b Dorsal view of P0 whole-mount brains. cKO-F was characterized by forebrain agenesis. cKO-E exhibited microcephaly and medial defects in corticogenesis. cKO-hG brains were similar to ctrl in size and morphology (cKO-F: n = 3, cKO-E: n = 4, cKO-hG: n = 6). c Cortical area (red), thickness (yellow), and mediolateral extent (blue) of P0 cKO-F, cKO-E, and cKO-hG compared with ctrl (data are mean, one-way ANOVA with Tukey’s post hoc test, ctrl: n = 4, cKO-F: n = 3, cKO-E cortical area: n = 4, cKO-E thickness and mediolateral extent: n = 3, cKO-hG cortical area: n = 6, cKO-hG thickness and mediolateral extent: n = 4 animals). d Pyknosis was significantly increased in medial E13.5 cKO-E cortex, but not in E15.5 cKO-hG cortex (data are mean, one-way ANOVA with Tukey’s post hoc test, cKO-E: n = 4, cKO-hG: n = 3 animals). Scale bar: 100 μm in a; 1 mm in b.
Fig. 8
Fig. 8. A selective requirement for Ino80-mediated HR in symmetric NPC–NPC divisions.
a P0 whole-mount brains and immunostaining for MAP2 (magenta) and nGFP (green). Emx1Cre-mediated deletion of HR gene Brca2 (Brca2 cKO-E) led to microcephaly and hippocampal hypoplasia reminiscent of Ino80 cKO-E (n = 3 animals). b The significant reductions in Ino80 cKO-E cortical area (red), thickness (yellow), and mediolateral extent (blue) were each phenocopied in Brca2 cKO-E (data are mean, one-way ANOVA with Tukey’s post hoc test, ctrl: n = 4, Ino80 cKO-E cortical area: n = 4, thickness, mediolateral extent: n = 3, Brca2 cKO-E: n = 3 animals). c Complementary gradients of asymmetric neurogenic divisions (NEUROG2, green) and apoptosis (CC3, magenta) in Brca2 cKO-E E12.5 cortex similar to those found in Ino80 cKO-E (data are LOESS curve ± 99% confidence interval, n = 3 animals). d In vivo DSB repair pathway assay revealed significant decrease in HDR (ACTB-3xMYC, magenta) relative to NHEJ (ACTB-3xHA, green) in Brca2 cKO-E compared with ctrl (data are mean, one-way ANOVA with Tukey’s post hoc test, ctrl: n = 4, Ino80 cKO-E: n = 5, Brca2 cKO-E: n = 4 animals). e Foxg1Cre deletion of Brca2 (cKO-F) during exclusively symmetric NPC–NPC divisions led to widespread CC3 (magenta in overlay, blue in monochrome) throughout the mediolateral axis of E11.5 cortex. The lateral extent of apoptosis (magenta arrowhead) reached the lateral extent of neocortex (green arrowhead). Emx1Cre deletion of Brca2 (cKO-E) near the onset of transition between symmetric and asymmetric divisions led to robust apoptosis in medial, but not lateral, neocortex. Tg(hGFAP-Cre) deletion of Brca2 (cKO-hG) after most NPCs had transitioned to asymmetric neurogenic division did not lead to widespread increase in apoptosis. These Cre-by-Cre phenotypes were reminiscent of those found in Ino80 cKOs (n = 3 animals). f During corticogenesis, synthesis-associated DSBs in dividing NPCs are repaired in S, G2, or M phase to safeguard genome integrity. Following Ino80 or Brca2 deletion from NPCs, HR was selectively disrupted. In symmetrically dividing NPCs, loss of HR led to unrepaired DSBs and apoptosis. In asymmetrically dividing NPCs, Ino80 or Brca2 deletion did not give rise to unrepaired DSBs or apoptosis, suggesting that homology-independent DNA repair pathways were sufficient. Thus, distinct modes of NPC division have divergent requirements for HR DNA repair. Scale bar: 500 μm in a; 100 μm in c, e; 20 μm in d.

References

    1. De Rubeis S, et al. Synaptic, transcriptional and chromatin genes disrupted in autism. Nature. 2014;515:209–215. - PMC - PubMed
    1. Sanders SJ, et al. Insights into autism spectrum disorder genomic architecture and biology from 71 risk loci. Neuron. 2015;87:1215–1233. - PMC - PubMed
    1. Gallegos DA, Chan U, Chen LF, West AE. Chromatin regulation of neuronal maturation and plasticity. Trends Neurosci. 2018;41:311–324. - PMC - PubMed
    1. Lasalle JM. Autism genes keep turning up chromatin. OA Autism. 2013;1:14. - PMC - PubMed
    1. Hauer MH, Gasser SM. Chromatin and nucleosome dynamics in DNA damage and repair. Genes Dev. 2017;31:2204–2221. - PMC - PubMed

Publication types

MeSH terms