

Distinct genetic architectures and environmental factors associate with host response to the γ2-herpesvirus infections
- PMID: 32737300
- PMCID: PMC7395761
- DOI: 10.1038/s41467-020-17696-2
Distinct genetic architectures and environmental factors associate with host response to the γ2-herpesvirus infections
Abstract
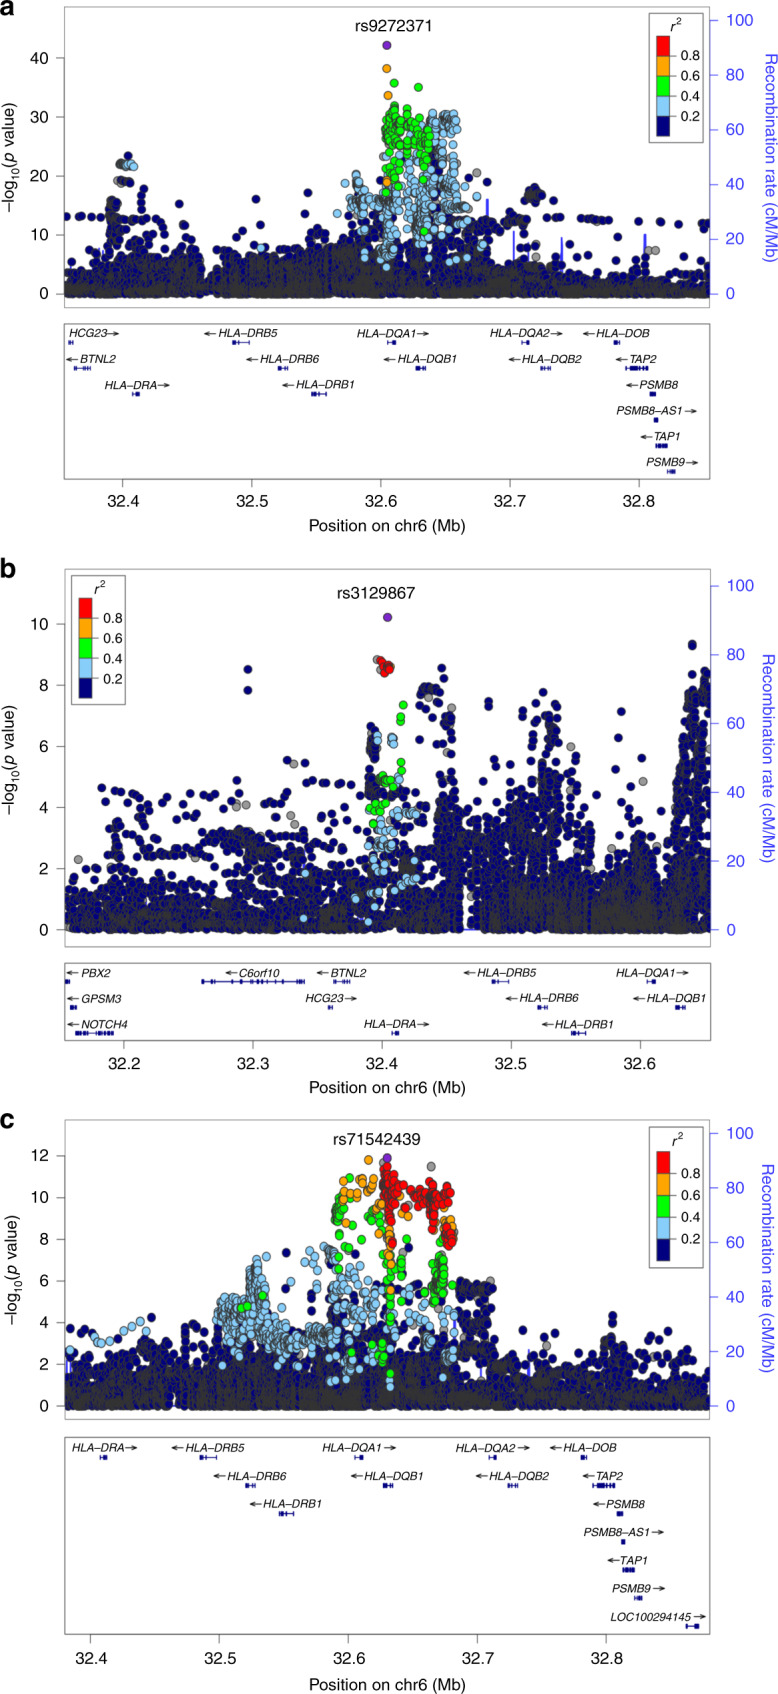
Kaposi's sarcoma-associated herpesvirus (KSHV) and Epstein-Barr Virus (EBV) establish life-long infections and are associated with malignancies. Striking geographic variation in incidence and the fact that virus alone is insufficient to cause disease, suggests other co-factors are involved. Here we present epidemiological analysis and genome-wide association study (GWAS) in 4365 individuals from an African population cohort, to assess the influence of host genetic and non-genetic factors on virus antibody responses. EBV/KSHV co-infection (OR = 5.71(1.58-7.12)), HIV positivity (OR = 2.22(1.32-3.73)) and living in a more rural area (OR = 1.38(1.01-1.89)) are strongly associated with immunogenicity. GWAS reveals associations with KSHV antibody response in the HLA-B/C region (p = 6.64 × 10-09). For EBV, associations are identified for VCA (rs71542439, p = 1.15 × 10⁻¹²). Human leucocyte antigen (HLA) and trans-ancestry fine-mapping substantiate that distinct variants in HLA-DQA1 (p = 5.24 × 10-44) are driving associations for EBNA-1 in Africa. This study highlights complex interactions between KSHV and EBV, in addition to distinct genetic architectures resulting in important differences in pathogenesis and transmission.
Conflict of interest statement
The authors declare no competing interests.
Figures
Similar articles
-
Genetics of immune response to Epstein-Barr virus: prospects for multiple sclerosis pathogenesis.Brain. 2024 Oct 3;147(10):3573-3582. doi: 10.1093/brain/awae110. Brain. 2024. PMID: 38630618 Free PMC article.
-
A prospective study of Kaposi's sarcoma-associated herpesvirus and Epstein-Barr virus in adults with human immunodeficiency virus-1.Br J Cancer. 2006 May 22;94(10):1504-9. doi: 10.1038/sj.bjc.6603100. Br J Cancer. 2006. PMID: 16705315 Free PMC article. Clinical Trial.
-
Epstein-Barr virus enhances genome maintenance of Kaposi sarcoma-associated herpesvirus.Proc Natl Acad Sci U S A. 2018 Nov 27;115(48):E11379-E11387. doi: 10.1073/pnas.1810128115. Epub 2018 Nov 14. Proc Natl Acad Sci U S A. 2018. PMID: 30429324 Free PMC article.
-
[Epstein-Barr virus (EBV) and Kaposi's sarcoma-associated herpesvirus (KSHV, HHV-8)].Uirusu. 2010 Dec;60(2):237-45. doi: 10.2222/jsv.60.237. Uirusu. 2010. PMID: 21488336 Review. Japanese.
-
[EBV/KSHV co-infection: an effective partnership].Med Sci (Paris). 2018 Jan;34(1):79-82. doi: 10.1051/medsci/20183401017. Epub 2018 Jan 31. Med Sci (Paris). 2018. PMID: 29384100 Review. French.
Cited by
-
Co-Infection of the Epstein-Barr Virus and the Kaposi Sarcoma-Associated Herpesvirus.Viruses. 2022 Dec 2;14(12):2709. doi: 10.3390/v14122709. Viruses. 2022. PMID: 36560713 Free PMC article. Review.
-
Human leukocyte antigen-DQA1*04:01 and rs2040406 variants are associated with elevated risk of childhood Burkitt lymphoma.Commun Biol. 2024 Jan 5;7(1):41. doi: 10.1038/s42003-023-05701-5. Commun Biol. 2024. PMID: 38182727 Free PMC article.
-
Roles of Lytic Viral Replication and Co-Infections in the Oncogenesis and Immune Control of the Epstein-Barr Virus.Cancers (Basel). 2021 May 10;13(9):2275. doi: 10.3390/cancers13092275. Cancers (Basel). 2021. PMID: 34068598 Free PMC article. Review.
-
Role of the Killer Immunoglobulin-like Receptor and Human Leukocyte Antigen I Complex Polymorphisms in Kaposi Sarcoma-Associated Herpesvirus Infection.Open Forum Infect Dis. 2023 Aug 18;10(8):ofad435. doi: 10.1093/ofid/ofad435. eCollection 2023 Aug. Open Forum Infect Dis. 2023. PMID: 37636520 Free PMC article.
-
Comparative Analysis of the Humoral Immune Response to the EBV Proteome across EBV-Related Malignancies.Cancer Epidemiol Biomarkers Prev. 2023 May 1;32(5):687-696. doi: 10.1158/1055-9965.EPI-22-0452. Cancer Epidemiol Biomarkers Prev. 2023. PMID: 36788424 Free PMC article.
References
-
- Plummer M, et al. Global burden of cancers attributable to infections in 2012: a synthetic analysis. Lancet Glob. Health. 2016;4:e609–e616. - PubMed
-
- de Sanjose S, et al. Geographic variation in the prevalence of Kaposi sarcoma-associated herpesvirus and risk factors for transmission. J. Infect. Dis. 2009;199:1449–1456. - PubMed
Publication types
MeSH terms
Substances
Grants and funding
LinkOut - more resources
Full Text Sources
Medical
Research Materials
