. 2020 Jul 31;11(1):3853.
doi: 10.1038/s41467-020-17710-7.

Anthropogenic climate change has driven over 5 million km2 of drylands towards desertification

Affiliations

Anthropogenic climate change has driven over 5 million km2 of drylands towards desertification

A L Burrell et al. Nat Commun. .

Abstract

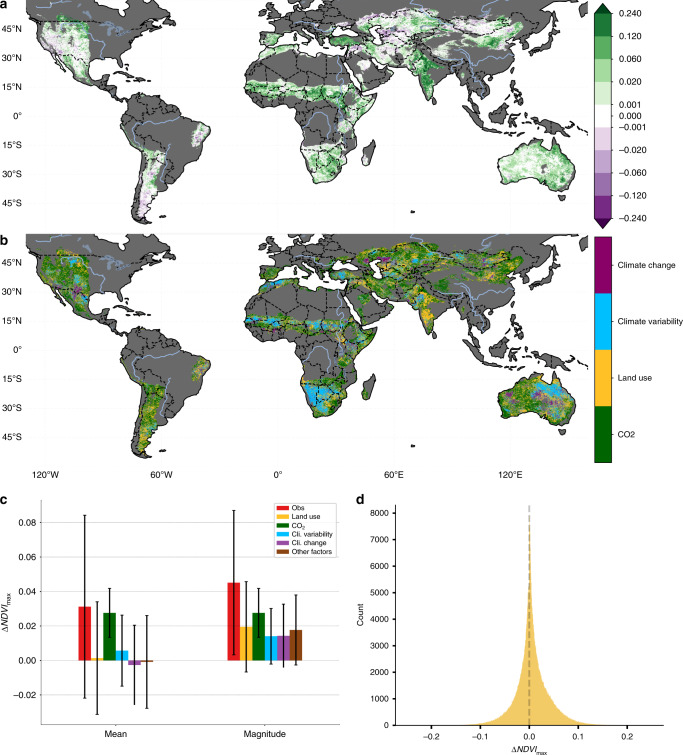
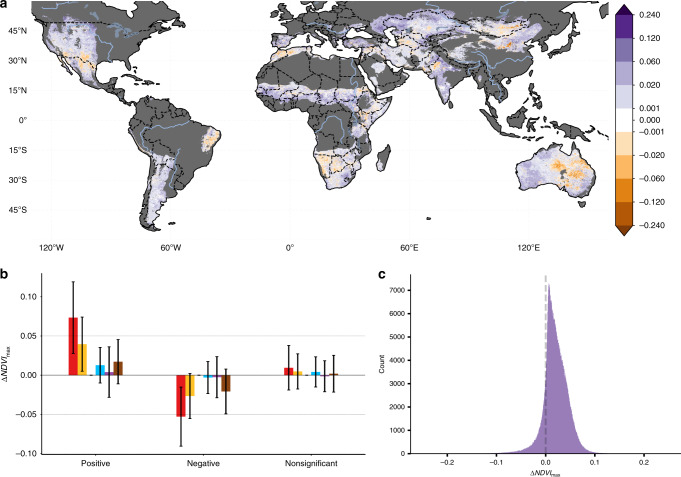
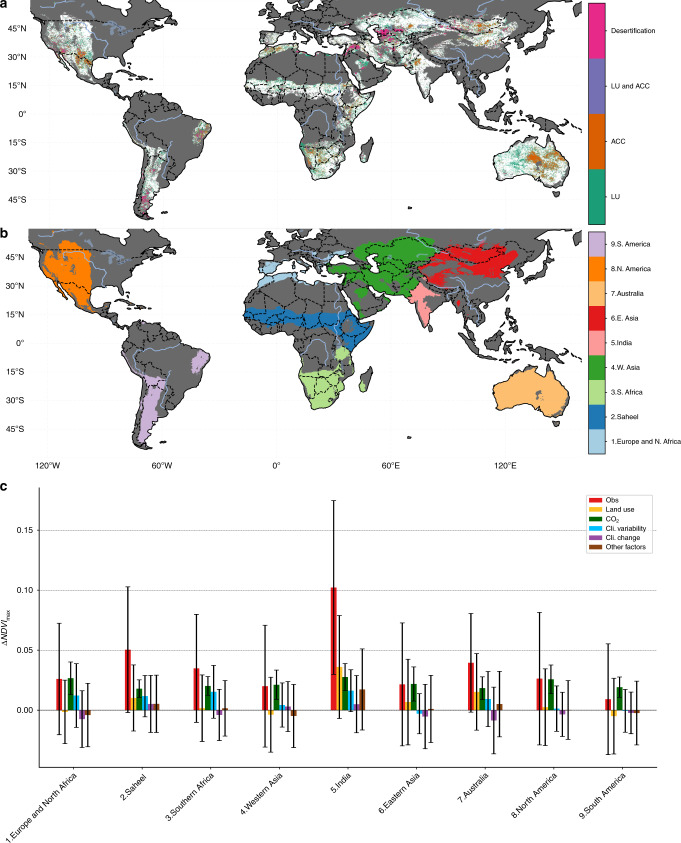
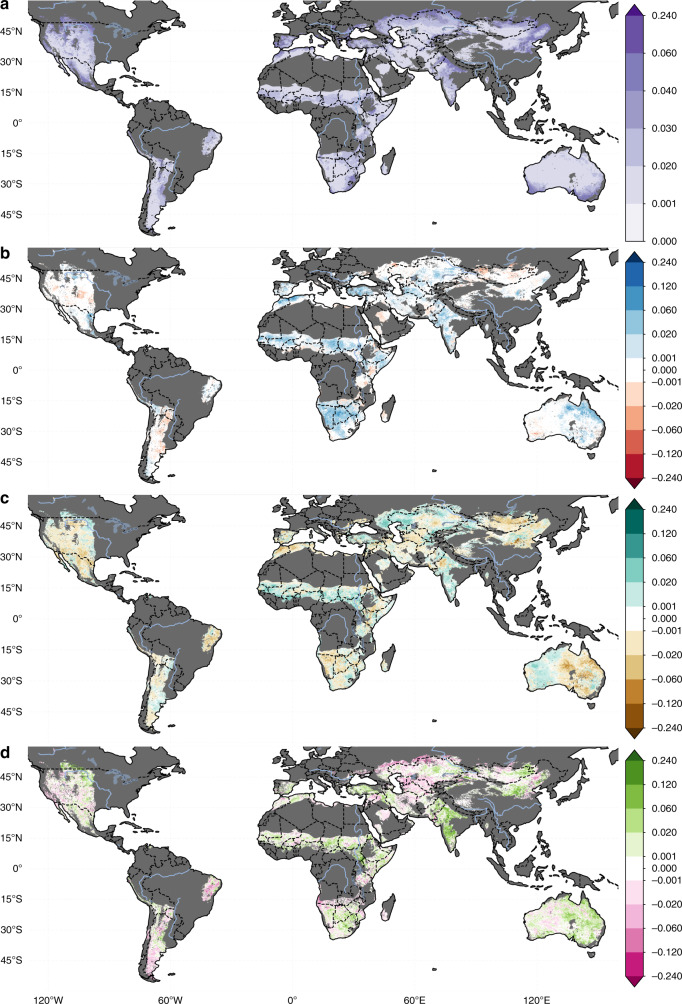
Drylands cover 41% of the earth's land surface and include 45% of the world's agricultural land. These regions are among the most vulnerable ecosystems to anthropogenic climate and land use change and are under threat of desertification. Understanding the roles of anthropogenic climate change, which includes the CO2 fertilization effect, and land use in driving desertification is essential for effective policy responses but remains poorly quantified with methodological differences resulting in large variations in attribution. Here, we perform the first observation-based attribution study of desertification that accounts for climate change, climate variability, CO2 fertilization as well as both the gradual and rapid ecosystem changes caused by land use. We found that, between 1982 and 2015, 6% of the world's drylands underwent desertification driven by unsustainable land use practices compounded by anthropogenic climate change. Despite an average global greening, anthropogenic climate change has degraded 12.6% (5.43 million km2) of drylands, contributing to desertification and affecting 213 million people, 93% of who live in developing economies.


Conflict of interest statement

The authors declare no competing interests.

Figures

Fig. 1
Fig. 1. Primary drivers of vegetation changes between 1982 and 2015.
a The observed dryland vegetation change from 1982 to 2015 measured using the change in p Normalized Difference Vegetation Index (ΔNDVImax). Non-dryland and hyper-arid regions are masked in dark gray and areas where the change is insignificant (αFDR = 0.10) or smaller than the error in the sensors (±0.001) are masked in white. b Map showing the largest absolute attributed driver (CO2, land use, climate change, and climate variability). Non-dryland regions are masked in dark gray and the magnitude of other factors is not considered. c The mean and magnitude (mean absolute value) of the different drivers of change in NDVImax between 1982 and 2015. The error bars show the SD of the area-weight grid cells. d Frequency distribution function for the change in NDVImax (1982–2015) attributed to land use, which shows that there are opposing changes at local scales which cancel out when averaged globally.
Fig. 2
Fig. 2. The contribution of anthropogenic climate change to vegetation change from 1982 to 2015.
a The contribution of anthropogenic climate change (Climate Change + O2) component to the change in vegetation between 1982 and 2015 (ΔNDVImax). Non-dryland and hyper-arid regions are masked in dark gray and areas where the change is insignificant (αFDR  = 0.10) or smaller than the error in the sensors (±0.001) are masked in white. b The mean area-weighted pixel effect size of the drivers of observed vegetation broken down by observed vegetation change direction. Positive indicates greening and negative is desertification. Error bars show the SD. c Frequency distribution function for the change in NDVImax (1982–2015) attributed to by anthropogenic climate change.
Fig. 3
Fig. 3. Desertification risk and regional drivers.
a Regions experiencing, or at risk of experiencing, desertification. Areas with a significant negative change in vegetation (αFDR = 0.10) are classified “Desertification,” areas where the anthropogenic climate change (ACC: CO2  + Climate Change) and land-use (LU) components are both negative but the change in vegetation is not significant are classified as “LU and ACC.” Areas where the anthropogenic climate change has had a negative effect are classified as “ACC” and areas where land use had a negative impact classified as “LU.” b map of the regional subdivisions used. c The mean per-pixel ΔNDVImax and its drivers broken down by regions shown in b. The error bars show the SD.
Fig. 4
Fig. 4. The drivers of global vegetation change.
The changes in NDVImax between 1982 and 2015 (ΔNDVImax) attributed to (a) CO2 fertilization, (b) climate variability, (c) climate change, and (d) land use. Non-dryland and hyper-arid regions are masked in dark gray. Areas where the change did not meet the multi-run ensemble significance criteria detailed in the “ Methods,” or are smaller than the error in the sensors (±0.001) are masked in white.

References

    1. Bai, Z. G., Dent, D. L., Olsson, L. & Schaepman, M. E. Global Assessment of Land Degradation and Improvement. 1. Identification by Remote Sensing (ISRIC, Wageningen, 2008).
    1. Dudley, N. & Alexander, S. Global Land Outlook (UNCCD, 2017).
    1. Scholes, R. et al. Summary for Policymakers of the Thematic Assessment Report on Land Degradation and Restoration of the Intergovernmental Science-Policy Platform on Biodiversity and Ecosystem Services. https://www.ipbes.net/sites/default/files/downloads/ipbes-6-15-add-5_spm... (IPBES, Bonn, 2018).
    1. Reynolds JF, et al. Global desertification: building a science for dryland development. Science. 2007;316:847–851. - PubMed
    1. Gibbs HK, Salmon JM. Mapping the world’s degraded lands. Appl. Geogr. 2015;57:12–21.

Publication types