. 2020 Jul 31;10(1):12991.
doi: 10.1038/s41598-020-69822-1.

Mutation accumulation and developmental lineages in normal and Down syndrome human fetal haematopoiesis

Affiliations

Mutation accumulation and developmental lineages in normal and Down syndrome human fetal haematopoiesis

Karlijn A L Hasaart et al. Sci Rep. .

Abstract

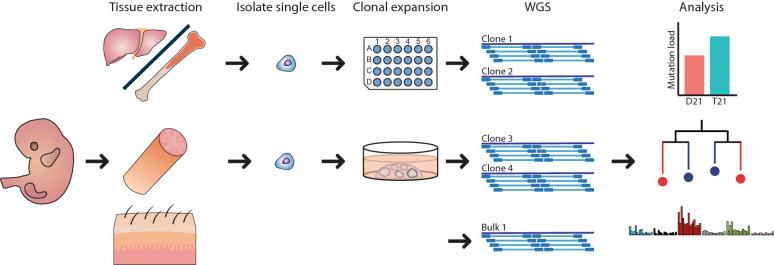
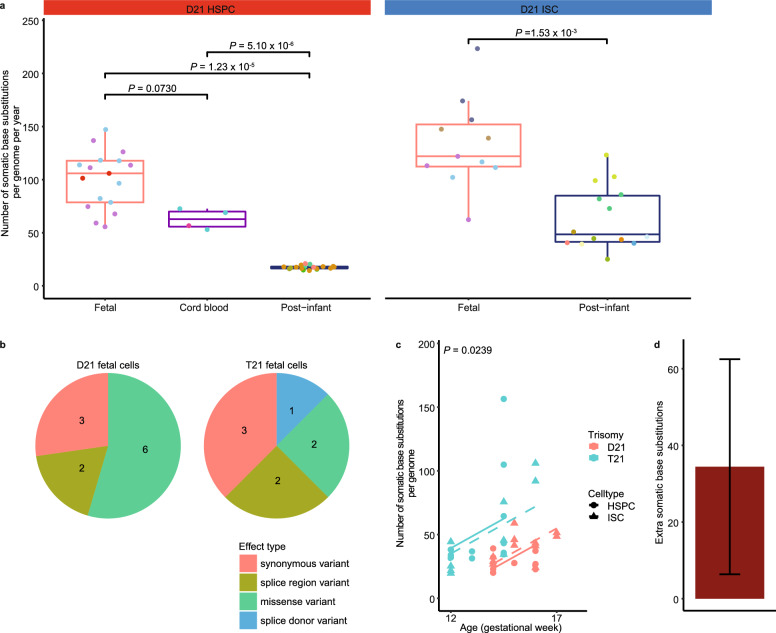
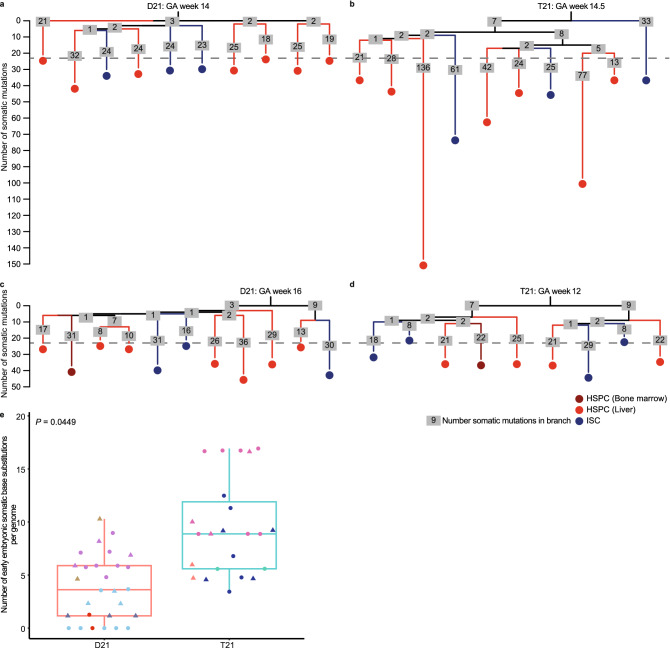
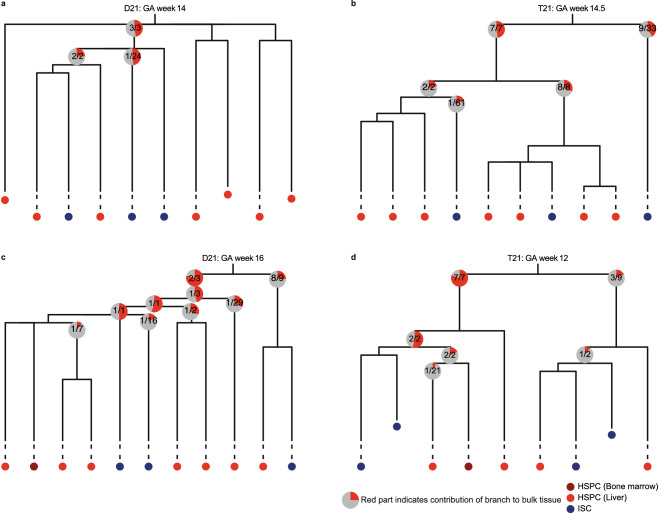
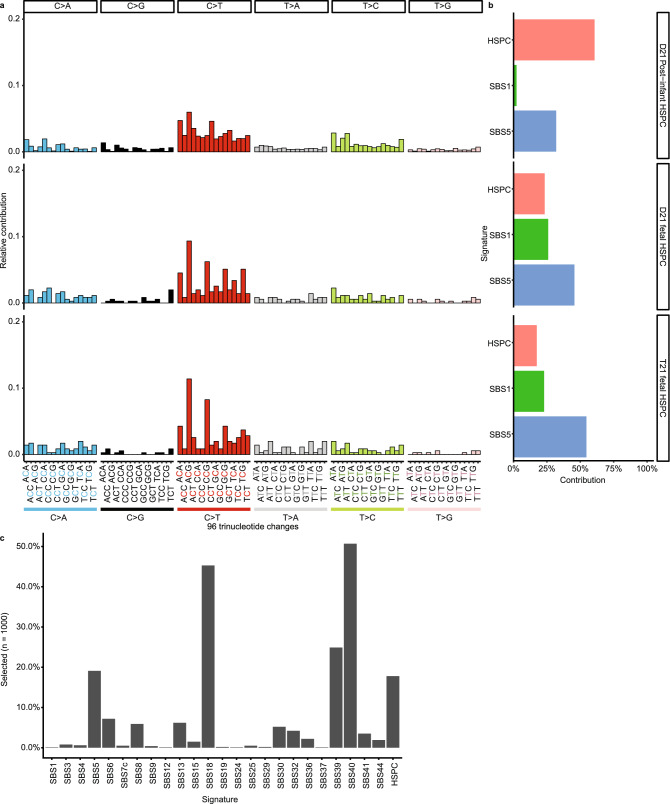
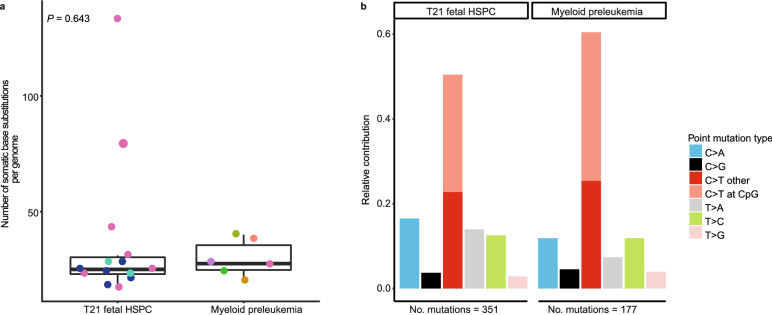
Children show a higher incidence of leukemia compared to young adolescents, yet their cells have less age-related (oncogenic) somatic mutations. Newborns with Down syndrome have an even higher risk of developing leukemia, which is thought to be driven by mutations that accumulate during fetal development. To characterize mutation accumulation in individual stem and progenitor cells of Down syndrome and karyotypically normal fetuses, we clonally expanded single cells and performed whole-genome sequencing. We found a higher mutation rate in haematopoietic stem and progenitor cells during fetal development compared to the post-infant rate. In fetal trisomy 21 cells the number of somatic mutations is even further increased, which was already apparent during the first cell divisions of embryogenesis before gastrulation. The number and types of mutations in fetal trisomy 21 haematopoietic stem and progenitor cells were similar to those in Down syndrome-associated myeloid preleukemia and could be attributed to mutational processes that were active during normal fetal haematopoiesis. Finally, we found that the contribution of early embryonic cells to human fetal tissues can vary considerably between individuals. The increased mutation rates found in this study, may contribute to the increased risk of leukemia early during life and the higher incidence of leukemia in Down syndrome.


Conflict of interest statement

The authors declare no competing interests.

Figures

Figure 1
Figure 1
Characterizing somatic mutations in single fetal haematopoietic stem and progenitor cells (HSPCs) and fetal intestinal stem cells (ISCs). (a) Experimental strategy for characterizing somatic mutations in single cells of disomy 21 (D21) and trisomy (T21) fetuses. HSPCs and ISC were clonally expanded to obtain sufficient DNA for whole-genome sequencing (WGS). DNA from bulk skin or intestine was used as a reference to control for germline variants. After characterizing the somatic mutations in single cells, the somatic mutation load between D21 and T21 fetal cells was compared. In addition, signature analysis and phylogenetic lineage tree analyses were performed.
Figure 2
Figure 2
Accumulation of somatic base pair substitutions in haematopoietic stem and progenitor cells (HSPCs) and intestinal stem cells (ISCs) during human fetal development and after birth. (a) Comparison of the number of autosomal somatic base substitutions per genome per year between D21 HSPCs (D21 fetal: 17 clones; 3 donors, Cord blood: 4 clones; 2 donors, Post-infant: 18 clones; 6 donors) and D21 ISCs (D21 fetal: 11 clones; 4 donors, Post-infant: 14 clones; 9 donors) of fetuses, cord blood and post infant (linear mixed-effects model). Points with the same color indicate single cells from the same subject. (b) Pie charts showing the number of somatic mutations for different types of exonic mutations in D21 and T21 fetal stem and progenitor cells (D21 fetal: 28 clones; 5 donors, T21 fetal: 23 clones; 4 donors). c The number of somatic base substitutions per genome plotted against the donor age (D21 fetal: 28 clones; 5 donors, T21 fetal: 23 clones; 4 donors). Dashed line: ISC, full line: HSPC. P-value shows the difference between T21 and D21 fetal stem and progenitor cells. (linear mixed-effects model, two-tailed t-test). d Extra somatic base substitutions per genome in T21 fetal stem and progenitor cells. Error bars represent 95% confidence intervals.
Figure 3
Figure 3
Phylogenetic lineage trees of disomy 21 (D21) and trisomy 21 (T21) fetuses. (a) Lineage trees of a gestational age (GA) week 14 D21 fetus, b gestational age week 14,5 T21 fetus, c gestational age week 16 D21 fetus and d gestational age week 12 T21 fetus. Each tip represents a single clonally expanded cell. The length of the branches indicates the number of somatic mutations in that branch of the tree. The number of somatic mutations in each branch are shown in grey boxes. e Comparison of the number of somatic base substitutions per genome between D21 and T21 fetal stem and progenitor cells, that occurred early in the development of the fetus (D21 fetal: 28 clones; 5 donors, T21 fetal: 23 clones; 4 donors). Circle: Haematopoietic stem and progenitor cells, Triangle: intestinal stem cells. Points with the same color indicate single cells from the same subject. (linear mixed-effects model, two-tailed t-test).
Figure 4
Figure 4
Relative contribution of the developmental lineage branches to fetal skin tissue. (a) Lineage trees of a gestational age (GA) week 14 D21 fetus, (b) gestational age week 14,5 T21 fetus, (c) gestational age week 16 D21 fetus and (d) gestational age week 12 T21 fetus. Each tip represents a single clonally expanded cell. The pie charts show the median contribution of the contributing mutations in a branch to the bulk skin tissue. The grey part of the pie chart indicates the total skin tissue, while the red part shows the contribution of a single branch to the skin tissue. The text in the pie charts shows how many of the mutations in that branch contributed to the skin tissue. Mutations not contributing to the skin tissue at all, are not used to calculate the median. Multiple pie charts in a single branch indicate that the mutations in that branch occurred during different cell divisions.
Figure 5
Figure 5
Somatic mutation patterns of disomy 21 (D21) and Trisomy 21 (T21) haematopoietic stem and progenitor cells (HSPCs). (a) Spectra of somatic point substitutions. The substitutions are pooled per category. (D21 Post-infant HSPC: n = 10,924; 18 clones; 5 donors, D21 fetal HSPC: n = 353; 17 clones; 3 donors, T21 fetal HSPC: n = 351; 13 clones; 3 donors). (b) The relative contribution of each mutational signature to the spectra of point substitutions. (c) Bar plot depicting how often each signature was selected during a bootstrapped (1000 iterations) signature selection process for the T21 fetal HSPC with extremely high somatic mutation load.
Figure 6
Figure 6
Somatic mutation patterns of preleukemic bulk blast cells from DS-associated myeloid preleukemia patients. (a) Comparison of the number of autosomal somatic base substitutions per genome per year for T21 fetal haematopoietic stem and progenitor cells (14 clones; 3 donors) and DS-associated myeloid preleukemia (6 donors). Points with the same color indicate single cells from the same subject. (linear mixed-effects model, two-tailed t-test). (b) 7-Spectrum of somatic base substitutions. The total number of somatic base substitutions is indicated.

References

    1. Stratton MR, Campbell PJ, Futreal PA. The cancer genome. Nature. 2009;458:719–724. doi: 10.1038/nature07943. - DOI - PMC - PubMed
    1. Tomasetti C, Vogelstein B. Variation in cancer risk among tissues can be explained by the number of stem cell divisions. Science (80-) 2015;347:78–81. doi: 10.1126/science.1260825. - DOI - PMC - PubMed
    1. Tomasetti C, Li L, Vogelstein B. Stem cell divisions, somatic mutations, cancer etiology, and cancer prevention. Science (80-) 2017;355:1330–1334. doi: 10.1126/science.aaf9011. - DOI - PMC - PubMed
    1. Osorio FG, et al. Somatic mutations reveal lineage relationships and age-related mutagenesis in human hematopoiesis. Cell Rep. 2018;25:2308–2316.e4. doi: 10.1016/j.celrep.2018.11.014. - DOI - PMC - PubMed
    1. Blokzijl F, et al. Tissue-specific mutation accumulation in human adult stem cells during life. Nature. 2016;538:260–264. doi: 10.1038/nature19768. - DOI - PMC - PubMed

Publication types