. 2021 Feb;31(2):187-205.
doi: 10.1038/s41422-020-0385-7. Epub 2020 Jul 31.

Stabilization of heterochromatin by CLOCK promotes stem cell rejuvenation and cartilage regeneration

Affiliations

Stabilization of heterochromatin by CLOCK promotes stem cell rejuvenation and cartilage regeneration

Chuqian Liang et al. Cell Res. 2021 Feb.

Abstract

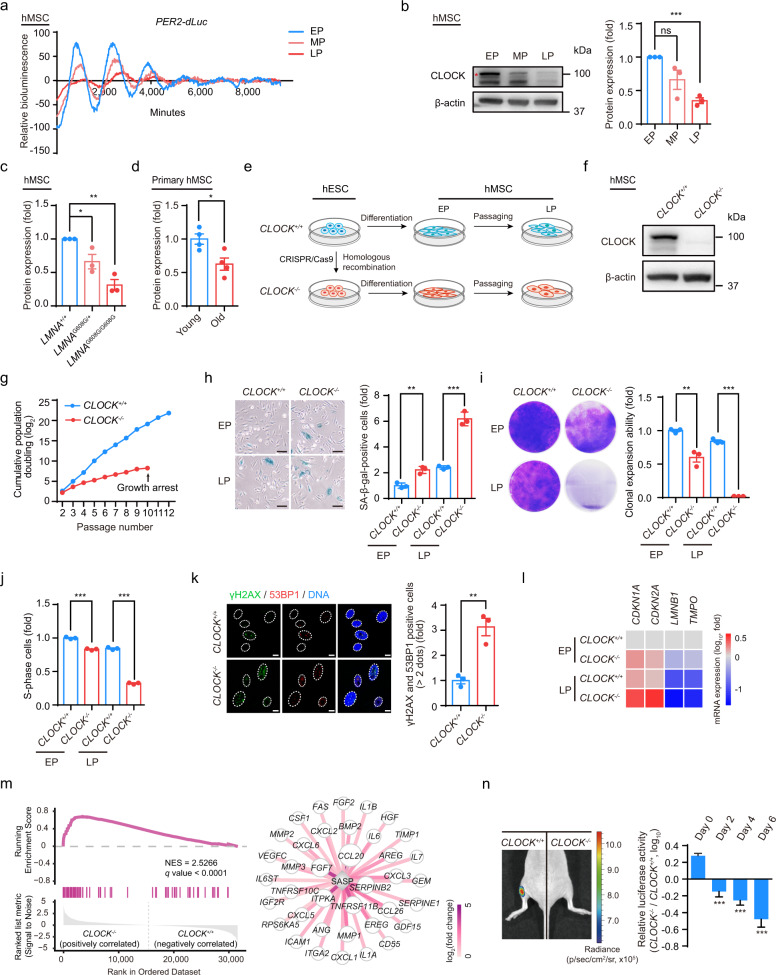
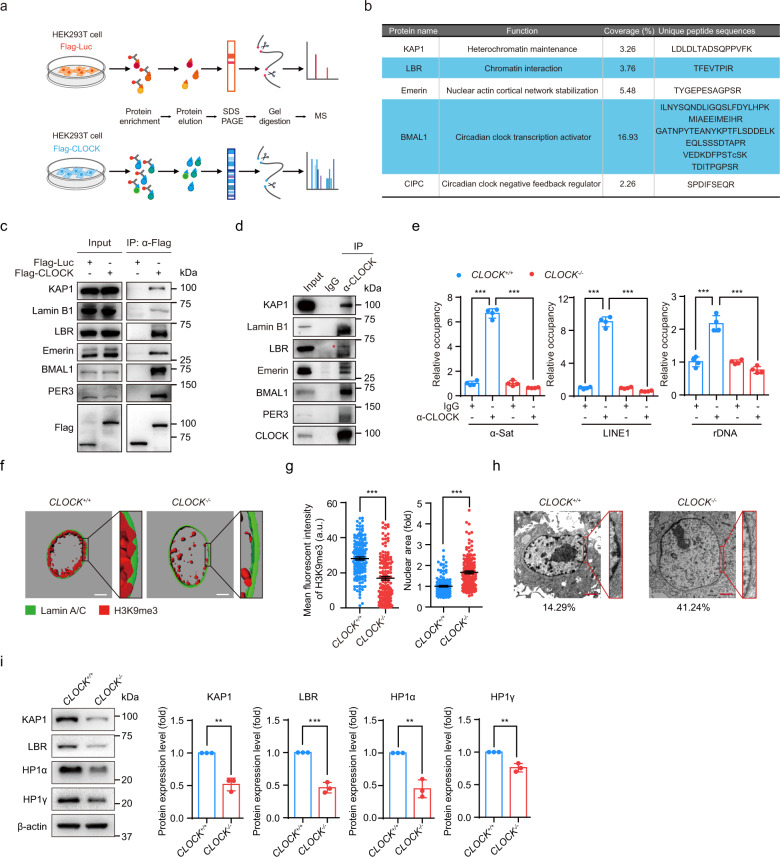
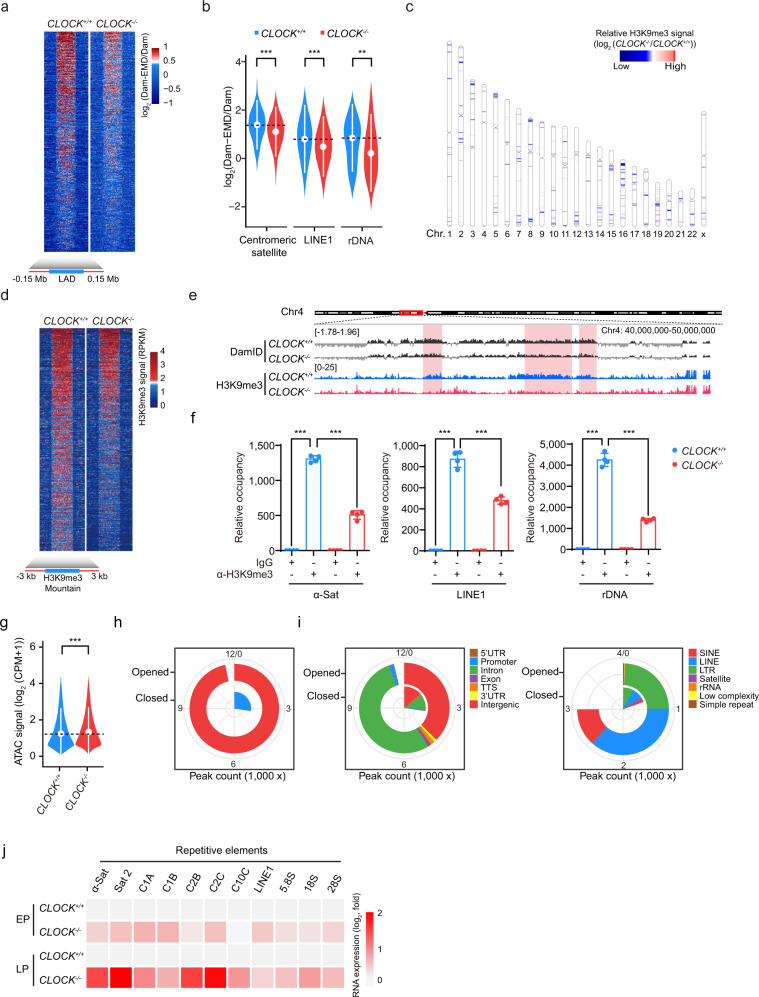
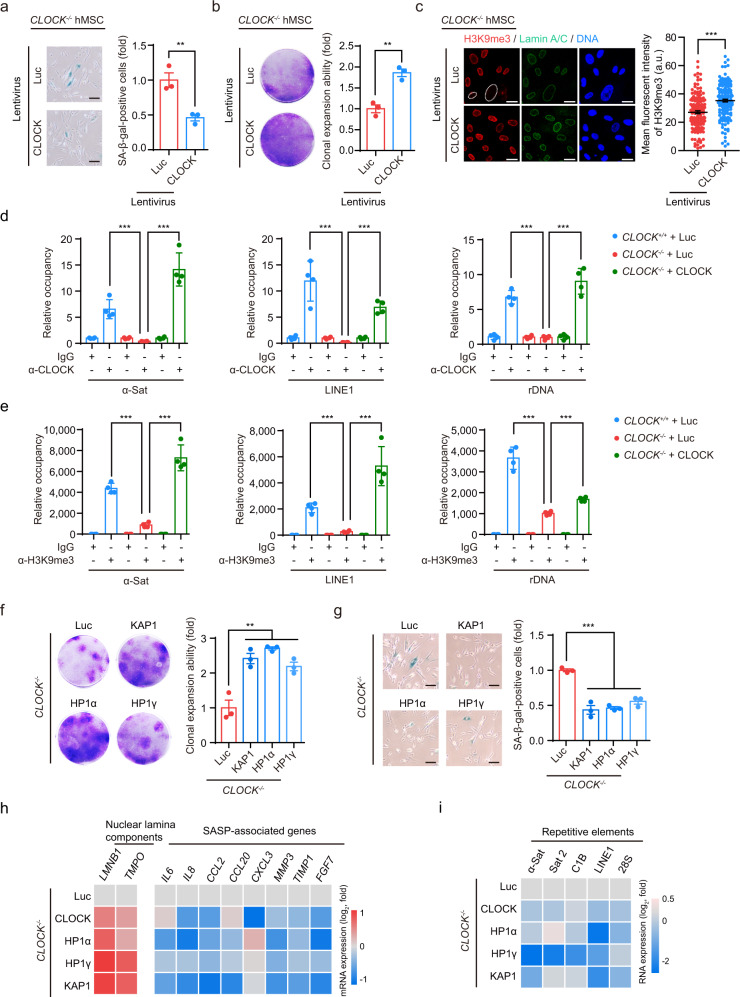
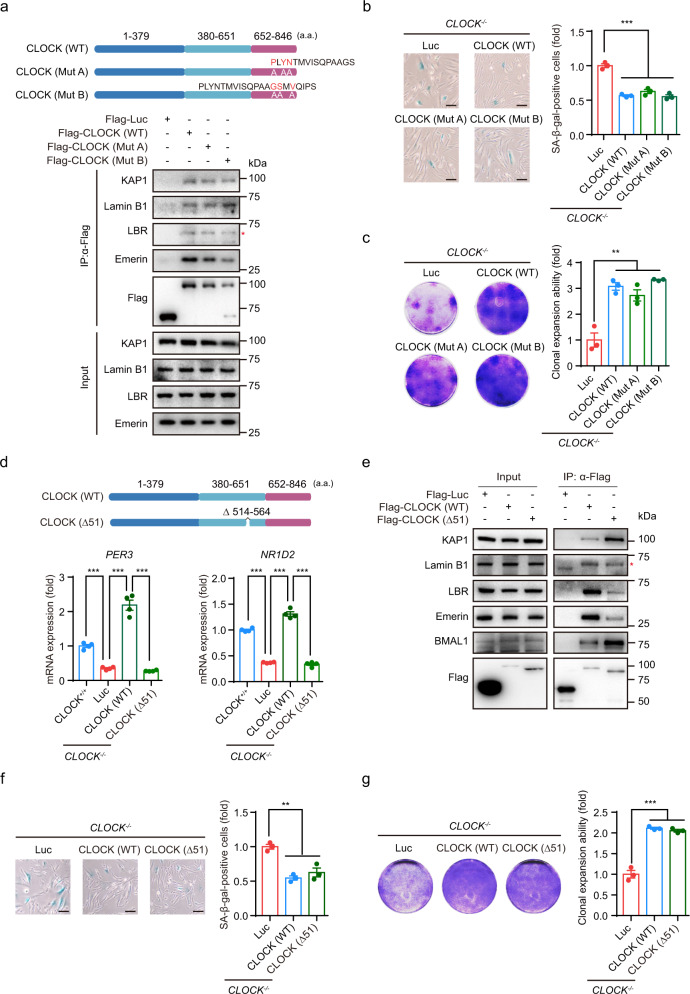
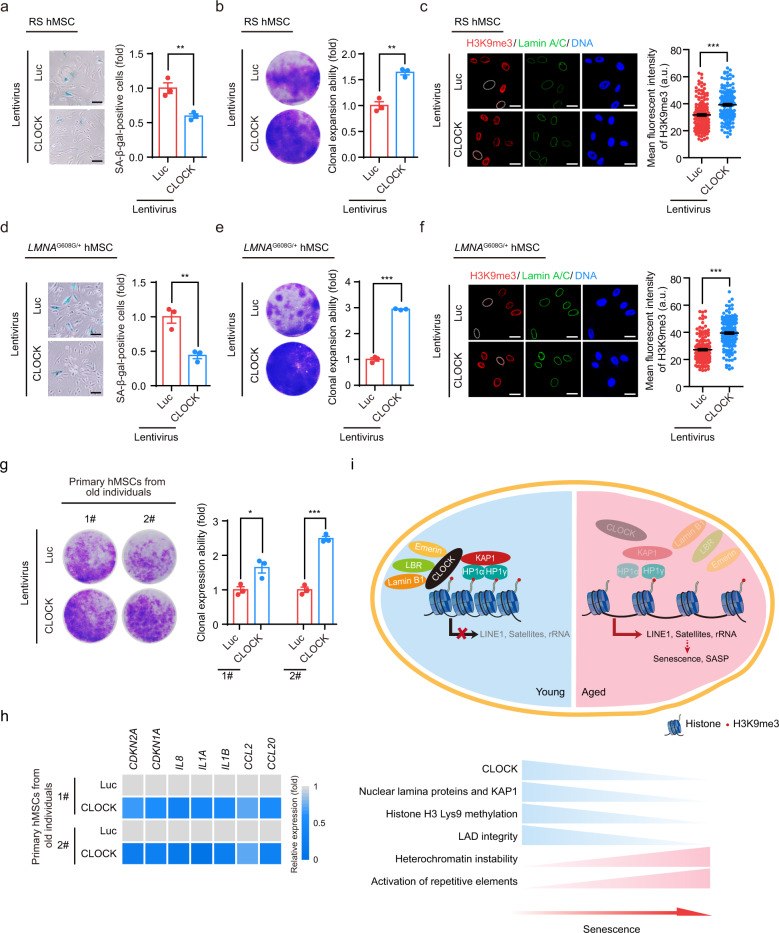
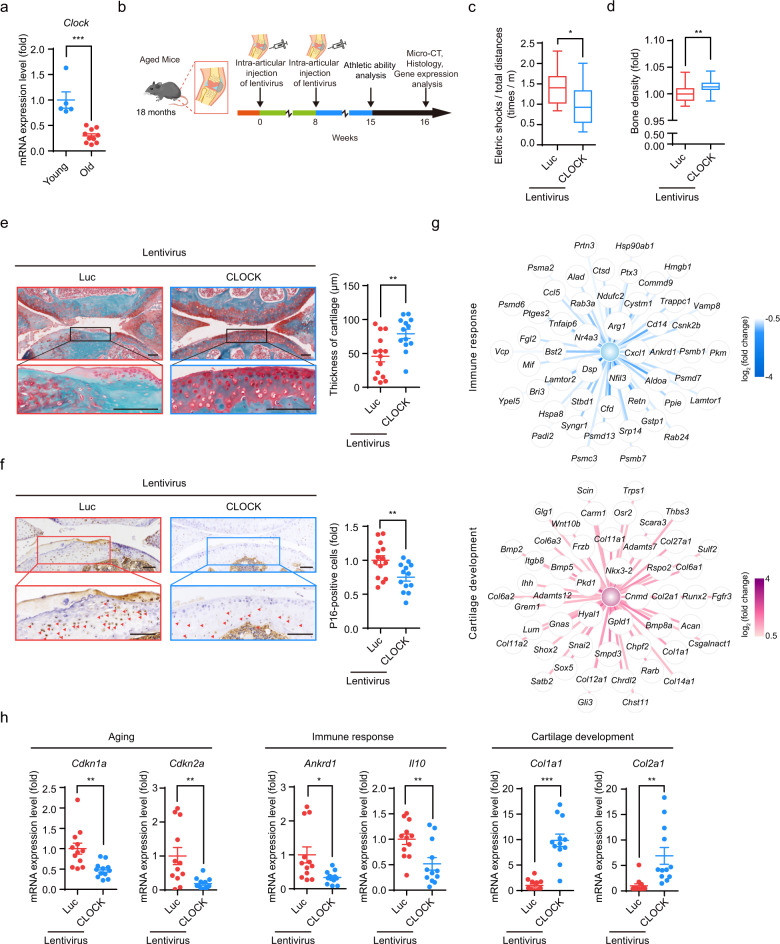
Accumulating evidence indicates an association between the circadian clock and the aging process. However, it remains elusive whether the deregulation of circadian clock proteins underlies stem cell aging and whether they are targetable for the alleviation of aging-associated syndromes. Here, we identified a transcription factor-independent role of CLOCK, a core component of the molecular circadian clock machinery, in counteracting human mesenchymal stem cell (hMSC) decay. CLOCK expression was decreased during hMSC aging. In addition, CLOCK deficiency accelerated hMSC senescence, whereas the overexpression of CLOCK, even as a transcriptionally inactive form, rejuvenated physiologically and pathologically aged hMSCs. Mechanistic studies revealed that CLOCK formed complexes with nuclear lamina proteins and KAP1, thus maintaining heterochromatin architecture and stabilizing repetitive genomic sequences. Finally, gene therapy with lentiviral vectors encoding CLOCK promoted cartilage regeneration and attenuated age-related articular degeneration in mice. These findings demonstrate a noncanonical role of CLOCK in stabilizing heterochromatin, promoting tissue regeneration, and mitigating aging-associated chronic diseases.


Conflict of interest statement

The authors declare no competing interests.

Figures

Fig. 1
Fig. 1. CLOCK−/− hMSCs exhibit phenotypes associated with accelerated cellular senescence.
a Representative traces of circadian oscillation in early-, middle- and late-passage (abbreviated as EP (P4), MP (P9) and LP (P13), respectively) hMSCs monitored by a transiently transfected reporter plasmid expressing destabilized Luc driven by the PER2 gene promoter (PER2-dLuc). Continuous monitoring of Luc activity revealed significant amplitude dampening and period lengthening of PER2-dLuc oscillations in MP and LP hMSCs. b Western blot analysis of CLOCK in EP (P4), MP (P9) and LP (P13) hMSCs. β-actin was used as the loading control. Data are representative of three independent experiments. Quantitative data to the right are presented as means ± SEM. n = 3 independent experiments. ns nonsignificant; ***P < 0.001 (two-tailed unpaired Student’s t-test). The red asterisk indicated the CLOCK band. c Statistical analysis of the relative protein expression levels of CLOCK in HGPS-specific (LMNAG608G/+ and LMNAG608G/G608G) hMSCs. Data are presented as means ± SEM. n = 3 independent experiments. *P < 0.05; **P < 0.01 (two-tailed unpaired Student’s t-test). d Statistical analysis of the relative protein expression levels of CLOCK in young and old primary hMSCs. Data are presented as means ± SEM. n = 4 biological replicates. *P < 0.05 (two-tailed unpaired Student’s t-test). e Schematic illustration of hESC differentiation into hMSCs. f Western blot analysis of CLOCK in early-passage CLOCK+/+ and CLOCK−/− hMSCs (P4). β-actin was used as the loading control. Data are representative of three independent experiments. g Growth curves of CLOCK+/+ and CLOCK−/− hMSCs. h SA-β-gal staining of EP (P4) and LP (P9) CLOCK+/+ and CLOCK−/− hMSCs. Data are presented as means ± SEM. n = 3 biological replicates. **P < 0.01; ***P < 0.001 (two-tailed unpaired Student’s t-test). Scale bars, 100 μm. i Clonal expansion assay of EP (P4) and LP (P9) CLOCK+/+ and CLOCK−/− hMSCs. Data are presented as means ± SEM. n = 3 biological replicates. **P < 0.01; ***P < 0.001 (two-tailed unpaired Student’s t-test). j Cell cycle analysis of EP (P4) and LP (P9) CLOCK+/+ and CLOCK−/− hMSCs. Data are presented as means ± SEM. n = 3 biological replicates. ***P < 0.001 (two-tailed unpaired Student’s t-test). k Immunostaining of γH2AX and 53BP1 in EP (P4) CLOCK+/+ and CLOCK−/− hMSCs. Dashed lines indicate the nuclear boundaries of the cells. Data are presented as means ± SEM. n = 3 biological replicates. **P < 0.01 (two-tailed unpaired Student’s t-test). Scale bars, 10 μm. l Heatmap showing mRNA levels of the indicated genes in EP (P4) and LP (P9) CLOCK+/+ and CLOCK−/− hMSCs. The average expression levels of the indicated genes in each cell type were normalized to those in EP CLOCK+/+ hMSCs. Data are representative of two independent experiments. m Left, gene set enrichment analysis showing that SASP-associated genes are enriched in late-passage CLOCK−/− hMSCs compared to CLOCK+/+ hMSCs (P9). Right, network showing the relative expression levels of enriched SASP-associated genes in late-passage CLOCK−/− hMSCs compared to CLOCK+/+ hMSCs (P9). n Photon flux from the TA muscles of NOD-SCID mice transplanted with CLOCK+/+ (left) or CLOCK−/− hMSCs (right) expressing luciferase. To indicate hMSCs attrition after implantation, Luc activity in the TA muscles was detected with an in vivo imaging system (IVIS). Quantitative data to the right are presented as means ± SEM. n = 6 mice. ***P < 0.001 (two-tailed unpaired Student’s t-test).
Fig. 2
Fig. 2. CLOCK forms complexes with nuclear lamina proteins and the heterochromatin-associated protein KAP1.
a The flow chart of the mass spectrometry strategy for identifying interacting proteins of CLOCK. Luc was used as a control. b KAP1, LBR, Emerin, BMAL1 and CIPC were interacting proteins of CLOCK identified by mass spectrometry. Unique peptides of each interacting protein are listed in the table. c Co-IP analysis of KAP1, Lamin B1, LBR, Emerin, BMAL1 and PER3 with exogenous Flag-tagged CLOCK protein in HEK293T cells. Data are representative of three independent experiments. d Co-IP analysis of KAP1, Lamin B1, LBR, Emerin, BMAL1 and PER3 with endogenous CLOCK protein in CLOCK+/+ hMSCs. The red asterisk indicates the LBR band pulled down by IP with CLOCK antibody. Data are representative of two independent experiments. e Enrichment of CLOCK within α-Sat, LINE1, and rDNA regions, as measured by ChIP-qPCR. Data are presented as means ± SD. n = 4. ***P < 0.001 (two-tailed unpaired Student’s t-test). Data are representative of two independent experiments. f 3D construction of a z-stack of H3K9me3 (red) and Lamin A/C (green) immunofluorescence images of late-passage CLOCK+/+ and CLOCK−/− hMSCs (P9). Scale bars, 5 μm. g Left, mean fluorescence intensity of H3K9me3 in late-passage CLOCK+/+ and CLOCK−/− hMSCs (P9). Data are presented as means ± SEM. n = 150 cells from three biological replicates. ***P < 0.001 (two-tailed unpaired Student’s t-test). Right, quantitative nuclear area of late-passage CLOCK+/+ and CLOCK−/− hMSCs (P9). Data are presented as means ± SEM. n = 150 cells from three biological replicates. ***P < 0.001 (two-tailed unpaired Student’s t-test). h Electron microscopy analysis of the heterochromatin architecture at the nuclear periphery in late-passage CLOCK+/+ and CLOCK−/− hMSCs (P9). The percentages of cells with heterochromatin loss at the nuclear periphery are presented below the images. Scale bars, 2 μm. i Representative western blots of nuclear lamina and heterochromatin components in early-passage CLOCK+/+ and CLOCK−/− hMSCs (P4). β-actin was used as the loading control. Quantitative data to the right are presented as means ± SEM. n = 3 independent experiments. **P < 0.01; ***P < 0.001 (two-tailed unpaired Student’s t-test).
Fig. 3
Fig. 3. CLOCK is required for heterochromatin maintenance in hMSCs.
a Heatmap showing the DamID signal (log2 (Dam-EMD/Dam)) from 0.15 Mb upstream to 0.15 Mb downstream of LAD regions in late-passage CLOCK+/+ and CLOCK−/− hMSCs (P9). b Violin plot showing the DamID signal (log2 (Dam-EMD/Dam)) at the indicated repetitive elements in late-passage CLOCK+/+ and CLOCK−/− hMSCs (P9). The white circles represent the median values, and the white lines represent the values within the interquartile range (IQR) from smallest to largest. **P < 0.01; ***P < 0.001 (two-sided Wilcoxon rank-sum test). c Chromosome ideogram showing the levels of H3K9me3 mountains across the 23 chromosomes of late-passage CLOCK−/− hMSCs compared to those of CLOCK+/+ hMSCs (P9). The color key from blue to red indicates low to high relative H3K9me3 levels, respectively. d Heatmap showing the H3K9me3 signal (RPKM) from 3 kb upstream to 3 kb downstream of H3K9me3 mountain regions in late-passage CLOCK+/+ and CLOCK−/− hMSCs (P9). e Representative tracks of DamID and H3K9me3 ChIP-seq data showing pronounced loss of H3K9me3 signal (RPKM) accompanied by decreased DamID signal (log2 (Dam-EMD/Dam)) in CLOCK−/− hMSCs. f Enrichment of H3K9me3 within α-Sat, LINE1, and rDNA regions, as measured by ChIP-qPCR. Data are presented as means ± SD. n = 4. ***P < 0.001 (two-tailed unpaired Student’s t-test). Data are representative of two independent experiments. g Violin plot showing the ATAC signal at the genomic regions of ATAC-seq peaks in late-passage CLOCK+/+ and CLOCK−/− hMSCs (P9). The white circles represent the median values, and the white lines represent the values within the IQR from smallest to largest. ***P < 0.001 (two-sided Wilcoxon rank-sum test). h Pie chart showing the counts of opened and closed ATAC peaks in LP (P9) CLOCK−/− hMSCs compared to CLOCK+/+ hMSCs. i Genomic element enrichment analysis of opened and closed ATAC peaks in LP (P9) CLOCK−/− hMSCs compared to CLOCK+/+ hMSCs. j Heatmap showing the relative mRNA levels of repetitive elements in EP (P4) or LP (P9) CLOCK+/+ and CLOCK−/− hMSCs. The average expression levels of the indicated repetitive elements in each cell type were normalized to those in CLOCK+/+ hMSCs. Data are representative of three independent experiments.
Fig. 4
Fig. 4. CLOCK–heterochromatin axis protects hMSC against senescence.
a SA-β-gal staining of CLOCK−/− hMSCs transduced with lentiviruses expressing Luc or CLOCK. Data are presented as means ± SEM. n = 3 biological replicates. **P < 0.01 (two-tailed unpaired Student’s t-test). Scale bars, 100 μm. b Clonal expansion assay of CLOCK−/− hMSCs transduced with lentiviruses expressing Luc or CLOCK. Data are presented as means ± SEM. n = 3 biological replicates. **P < 0.01 (two-tailed unpaired Student’s t-test). c Immunofluorescence analysis of the H3K9me3 intensity in CLOCK–/– hMSCs transduced with Luc or CLOCK. Dashed lines indicate the nuclear boundaries of the cells with decreased H3K9me3 signals. Data are presented as means ± SEM. n = 150 cells from three biological replicates. ***P < 0.001 (two-tailed unpaired Student’s t-test). Scale bars, 25 μm. d Enrichment of CLOCK within α-Sat, LINE1, and rDNA regions, as measured by ChIP-qPCR, in CLOCK+/+ hMSCs transduced with Luc and CLOCK−/− hMSCs transduced with Luc or CLOCK. Data are presented as means ± SD. n = 4. ***P < 0.001 (two-tailed unpaired Student’s t-test). Data are representative of two independent experiments. e Enrichment of H3K9me3 within α-Sat, LINE1, and rDNA regions, as measured by ChIP-qPCR, in CLOCK+/+ hMSCs transduced with Luc and CLOCK−/− hMSCs transduced with Luc or CLOCK. Data are presented as means ± SD. n = 4. ***P < 0.001 (two-tailed unpaired Student’s t-test). Data are representative of two independent experiments. f Clonal expansion assay of CLOCK−/− hMSCs transduced with lentiviruses expressing Luc, KAP1, HP1α, or HP1γ. Data are presented as means ± SEM. n = 3 biological replicates. **P < 0.01 (two-tailed unpaired Student’s t-test). g SA-β-gal staining of CLOCK−/− hMSCs transduced with lentiviruses expressing Luc, KAP1, HP1α, or HP1γ. Data are presented as means ± SEM. n = 3 biological replicates. ***P < 0.001 (two-tailed unpaired Student’s t-test). Scale bars, 100 μm. h Heatmaps showing the relative mRNA levels of nuclear lamina components and SASP-associated genes in CLOCK−/− hMSCs transduced with lentiviruses expressing Luc, KAP1, HP1α, or HP1γ. The average expression levels of the indicated genes in each cell type were normalized to those in CLOCK−/− hMSCs transduced with Luc. Data are representative of two independent experiments. i Heatmap showing the relative transcript levels of repetitive elements in CLOCK−/− hMSCs transduced with Luc, KAP1, HP1α, or HP1γ. The average expression levels of the indicated repetitive elements in each cell type were normalized to those in CLOCK−/− hMSCs transduced with Luc. Data are representative of two independent experiments.
Fig. 5
Fig. 5. CLOCK counteracts hMSC senescence independent of its transcriptional activity.
a Top, schematic diagram showing the mutation strategy for CLOCK. Bottom, Co-IP of KAP1 and nuclear lamina proteins with exogenous WT and mutant CLOCK proteins (Mut A and Mut B) in HEK293T cells. Data are representative of two independent experiments. The red asterisk indicates the LBR band pulled down by IP with Flag antibody. b SA-β-gal staining in CLOCK–/– hMSCs transduced with lentiviruses expressing Luc, CLOCK (WT), CLOCK (Mut A), or CLOCK (Mut B). The percentage of SA-β-gal-positive cells in each cell type was normalized to that in CLOCK−/− hMSCs transduced with Luc. Data are presented as means ± SEM. n = 3 biological replicates. ***P < 0.001 (two-tailed unpaired Student’s t-test). Scale bars, 100 μm. c Clonal expansion assay of CLOCK−/− hMSCs transduced with lentiviruses expressing Luc, CLOCK (WT), CLOCK (Mut A), or CLOCK (Mut B). The clonal expansion ability of each cell type was normalized to that of CLOCK–/– hMSCs transduced with Luc. Data are presented as means ± SEM. n = 3 biological replicates. **P < 0.01 (two-tailed unpaired Student’s t-test). d Top, schematic diagram showing the mutation strategy for the CLOCK Δ51 truncation. Bottom, relative mRNA levels of PER3 and NR1D2 in CLOCK+/+ hMSCs and CLOCK−/− hMSCs transduced with lentiviruses expressing Luc, CLOCK (WT), or CLOCK (Δ51). Data are presented as means ± SEM. n = 4. ***P < 0.001 (two-tailed unpaired Student’s t-test). Data are representative of two independent experiments. e Co-IP of KAP1 and nuclear lamina proteins with exogenous CLOCK (WT) and CLOCK (Δ51) proteins in HEK293T cells. Data are representative of two independent experiments. The red asterisk indicates the band of Lamin B1. f SA-β-gal staining of CLOCK−/− hMSCs transduced with lentiviruses expressing Luc, CLOCK (WT), or CLOCK (Δ51). The percentage of SA-β-gal-positive cells in each cell type was normalized to that in CLOCK–/– hMSCs transduced with Luc. Data are presented as means ± SEM. n = 3 biological replicates. **P < 0.01 (two-tailed unpaired Student’s t-test). Scale bars, 100 μm. g Clonal expansion assay of CLOCK–/– hMSCs transduced with lentiviruses expressing Luc, CLOCK (WT) and CLOCK (Δ51). The clonal expansion ability of each cell type was normalized to that of CLOCK–/– hMSCs transduced with Luc. Data are presented as means ± SEM. n = 3 biological replicates. ***P < 0.001 (two-tailed unpaired Student’s t-test).
Fig. 6
Fig. 6. CLOCK overexpression attenuates hMSC aging.
a SA-β-gal staining of replicative senescent (RS) CLOCK+/+ hMSCs transduced with lentiviruses expressing Luc or CLOCK. Data are presented as means ± SEM. n = 3 biological replicates. **P < 0.01 (two-tailed unpaired Student’s t-test). Scale bars, 100 μm. b Clonal expansion assay of RS CLOCK+/+ hMSCs transduced with lentiviruses expressing Luc or CLOCK. Data are presented as means ± SEM. n = 3 biological replicates. **P < 0.01 (two-tailed unpaired Student’s t-test). c H3K9me3 staining of RS CLOCK+/+ hMSCs transduced with lentiviruses expressing Luc or CLOCK. Dashed lines indicate the nuclear boundaries of cells with decreased H3K9me3 signals. Data are presented as means ± SEM. n = 150 cells from three biological replicates. ***P < 0.001 (two-tailed unpaired Student’s t-test). Scale bars, 25 μm. d SA-β-gal staining of HGPS-specific hMSCs transduced with lentiviruses expressing Luc or CLOCK. Data are presented as means ± SEM. n = 3 biological replicates. **P < 0.01 (two-tailed unpaired Student’s t-test). Scale bars, 100 μm. e Clonal expansion assay of HGPS-specific hMSCs transduced with lentiviruses expressing Luc or CLOCK. Data are presented as means ± SEM. n = 3 biological replicates. ***P < 0.001 (two-tailed unpaired Student’s t-test). f H3K9me3 staining of HGPS-specific hMSCs transduced with lentiviruses expressing Luc or CLOCK. Dashed lines indicate the nuclear boundaries of cells with decreased H3K9me3 signals. Data are presented as means ± SEM. n = 150 cells from three biological replicates. ***P < 0.001 (two-tailed unpaired Student’s t-test). Scale bars, 25 μm. g Clonal expansion assay of primary hMSCs that were derived from a 92-year-old individual and a 76-year-old individual and transduced with lentiviruses expressing Luc or CLOCK. Data are presented as means ± SEM. n = 3 biological replicates for two individuals. *P < 0.05; ***P < 0.001 (two-tailed unpaired Student’s t-test). h Heatmap showing the mRNA levels of the indicated genes in primary hMSCs transduced with lentiviruses expressing Luc or CLOCK. The average expression levels of the indicated genes of primary hMSCs transduced with lentiviruses expressing CLOCK were normalized to those of primary hMSCs transduced with lentiviruses expressing Luc. n = 4. i A constructive model describing the role of CLOCK in stabilizing heterochromatin during aging. In young hMSCs, CLOCK forms a complex with the heterochromatin-associated protein KAP1 and nuclear lamina proteins Lamin B1, LBR and Emerin. This complex tethers H3K9me3-enriched heterochromatin to nuclear periphery, repressing aberrant transcription of repetitive elements. In aged hMSCs, the complex is destabilized due to the downregulation of CLOCK and its binding partners, which results in heterochromatin instability and thereby transcription of repetitive elements, leading to cellular senescence and SASP.
Fig. 7
Fig. 7. CLOCK gene therapy alleviates aging-associated osteoarthritis.
a RT-qPCR analysis of Clock mRNA in the joints of young mice (n = 5) and old mice (n = 10). Data are presented as means ± SEM. ***P < 0.001 (two-tailed unpaired Student’s t-test). b Schematic of the time course for the experiments referenced in bh. c Treadmill experiment with aged mice injected with lentiviruses expressing Luc (n = 14 mice) or CLOCK (n = 13 mice). Box plots indicate the median (center line inside the box), lower and upper quartiles (bounds of box), smallest and largest values (whiskers), *P < 0.05 (two-tailed unpaired Student’s t-test). d Bone density analysis of aged mice injected with lentiviruses expressing Luc (n = 14 mice) or CLOCK (n = 13 mice). Box plots indicate the median (center line inside the box), lower and upper quartiles (bounds of box), smallest and largest values (whiskers), **P < 0.01 (two-tailed unpaired Student’s t-test). e Representative images of safranin O-fast green staining of articular cartilage from aged mice injected with lentiviruses expressing Luc (n = 14 mice) or CLOCK (n = 13 mice). Quantitative data of articular cartilage thickness to the right are presented as means ± SEM. **P < 0.01 (two-tailed unpaired Student’s t-test). Scale bars, 100 μm. f Immunostaining for P16 in articular cartilage from aged mice injected with lentiviruses expressing Luc (n = 14 mice) or CLOCK (n = 13 mice). Quantitative data of the percentage of P16-positive cells to the right are presented as means ± SEM. **P < 0.01 (two-tailed unpaired Student’s t-test). Scale bars, 100 μm. g Network showing the expression levels of differentially expressed genes associated with “Immune response” and “Cartilage development” in the joints of aged mice injected with lentiviruses expressing Luc or CLOCK. Top 50 downregulated genes associated with “Immune response” and top 50 upregulated genes associated with “Cartilage development” are shown. h Representative RT-qPCR analysis of the indicated genes in the joints of aged mice injected with lentiviruses expressing Luc (n = 12 mice) or CLOCK (n = 12 mice). Data are presented as means ± SEM. *P < 0.05; **P < 0.01; ***P < 0.001 (two-tailed unpaired Student’s t-test).

References

    1. Zhang EE, Kay SA. Clocks not winding down: unravelling circadian networks. Nat. Rev. Mol. Cell Biol. 2010;11:764–776. - PubMed
    1. Patke A, Young MW, Axelrod S. Molecular mechanisms and physiological importance of circadian rhythms. Nat. Rev. Mol. Cell Biol. 2020;21:67–84. - PubMed
    1. Nakamura, T. J. et al. Age-related changes in the circadian system unmasked by constant conditions. eNeuro2, ENEURO.0064-15.2015 (2015). - PMC - PubMed
    1. Gossan N, et al. The circadian clock in murine chondrocytes regulates genes controlling key aspects of cartilage homeostasis. Arthritis Rheum. 2013;65:2334–2345. - PMC - PubMed
    1. Musiek ES, Holtzman DM. Mechanisms linking circadian clocks, sleep, and neurodegeneration. Science. 2016;354:1004–1008. - PMC - PubMed

Publication types

MeSH terms