. 2020 Nov;161(3):230-244.
doi: 10.1111/imm.13246. Epub 2020 Sep 14.

p38 MAPK signaling mediates retinoic acid-induced CD103 expression in human dendritic cells

Affiliations

p38 MAPK signaling mediates retinoic acid-induced CD103 expression in human dendritic cells

Mandi M Roe et al. Immunology. 2020 Nov.

Abstract

Retinoic acid (RA) is an active derivative of vitamin A and a key regulator of immune cell function. In dendritic cells (DCs), RA drives the expression of CD103 (integrin αE ), a functionally relevant DC subset marker. In this study, we analyzed the cell type specificity and the molecular mechanisms involved in RA-induced CD103 expression. We show that RA treatment caused a significant up-regulation of CD103 in differentiated monocyte-derived DCs and blood DCs, but not in differentiated monocyte-derived macrophages or T cells. DC treatment with an RA receptor α (RARα) agonist led to an increase in CD103 expression similar to that in RA treatment, whereas RARA gene silencing with small interfering RNA blocked RA-induced up-regulation of CD103, pointing to a major role of RARα in the regulation of CD103 expression. To elucidate RA-induced signaling downstream of RARα, we used Western blot analysis of RA-treated DCs and showed a significant increase of p38 mitogen-activated protein kinase (MAPK) phosphorylation. In addition, DCs cultured with RA and a p38 MAPK inhibitor had a significantly reduced expression of CD103 compared with DCs cultured with RA only, indicating that p38 MAPK is involved in CD103 regulation. In summary, these findings suggest that the RA-induced expression of CD103 is specific to DCs, is mediated primarily through RARα and involves p38 MAPK signaling.

Keywords: CD103; dendritic cells; p38 mitogen-activated protein kinase; retinoic acid.


Conflict of interest statement

The authors declare no conflict of interest.

Figures
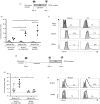
Figure 1
Figure 1
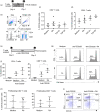
Retinoic acid (RA) induces increased expression of CD103 in monocytes and monocyte‐derived dendritic cells (MoDCs), but not in differentiated monocyte‐derived macrophages (MDMs). (a) Schematic of experimental design for (b) and (c). Isolated CD14+ monocytes were cultured for 1 day with or without RA. Interleukin‐4 (IL‐4) and granulocyte–macrophage colony‐stimulating factor (GM‐CSF) were added to differentiate monocytes into MoDCs, and macrophage colony‐stimulating factor (M‐CSF) was added to differentiate monocytes into MDMs. (b) FACS analysis of CD103 expression on monocytes cultured under different conditions; pooled data from three independent experiments; individual data points, mean ± SD are shown. (c) Representative histograms of RA‐treated and untreated cells from (b). (d) Schematic of experimental design for panels (e) and (f). CD14+ monocytes were cultured for 3 days with IL‐4/GM‐CSF or with M‐CSF. On day 3, RA was added to the culture for 1 day and cells were harvested for FACS analysis. (e) Pooled FACS data from three or four independent experiments showing CD103 expression on different cell types. (f) Representative histograms of data in (e). Isotype control – gray histogram, CD103 antibody – black solid line. One‐way analysis of variance with Dunnett’s multiple comparisons test; *P ≤ 0·05. **P ≤ 0·01.
Figure 2
Figure 2
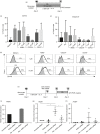
Retinoic acid (RA) does not induce significant CD103 expression in blood T cells. (a) Schematic of experimental design for panels (b) to (d). CD14‐depleted peripheral blood mononuclear cells (PBMCs) were cultured for 1 day with or without RA, transforming growth factor β 1 (TGF‐β 1) or TGF‐β 2 and harvested for FACS analysis. (b) Gating schematic for analysis of CD8+ and CD4+ T cells. (c, d) Pooled data from four independent experiments show (c) no CD103 expression on CD4+ T cells and (d) low CD103 expression on CD8+ T cells with or without addition of RA, TGF‐β 1 or TGF‐β 2. (e) Schematic of experimental design for panels (f) to (i). PBMCs remaining after CD14+ monocyte depletion were cultured for 5 days with or without RA and anti‐CD3/CD28 beads and were harvested for FACS analysis. (f) Pooled data from three experiments and (g) representative FACS histograms showing the percentage of proliferating T cells after each treatment as measured by CellTrace Violet for CD4+ T cells (top graphs) and CD8+ T cells (bottom graphs). Two‐way analysis of variance with Dunnet’s multiple comparisons test; *indicates statistical significance (P < 0·01). (h) Pooled FACS data from three experiments (with mean ± SD) and (i) representative dotplots showing CD103 expression on proliferating CD4+ and CD8+ T cells after 5 days in culture with or without RA treatment.
Figure 3
Figure 3
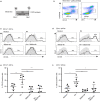
Retinoic acid receptor α (RARα) mediates RA‐induced expression of CD103 on monocyte‐derived dendritic cells (MoDCs). (a) Schematic of experimental design for (b) to (d). MoDCs were cultured with RA, AM80 (RARα agonist), CD2314 (RARβ agonist), or CD437 (RARγ agonist) before harvest for FACS analysis after 3 days. RAR agonists were added at concentrations of 1 µm or 10 µm. Expression of (b) CD103 and (c) integrin β 7 on MoDCs was analyzed by FACS. Pooled data from three independent experiments; mean ± SD; one‐way analysis of variance with Tukey’s multiple comparisons test. Symbols indicate significant difference compared with medium control; *P ≤ 0·05; **P ≤ 0·01; ***P ≤ 0·001. (d) Representative data showing CD103 expression on MoDCs with RA and RAR agonists. Isotype control – gray histogram, CD103 antibody – black solid line. (e) Schematic of experimental design for panels (f) to (h). MoDCs were differentiated for 3 days before addition of scramble siRNA or RARα siRNA. On day 4, RA was added to the culture medium for 1 day before harvest and analysis by qRT‐PCR. (f) Relative gene expression of RARA, the gene encoding for RARα, after treatment with RARα siRNA; representative experiment with n = 2 technical replicates. Relative gene expression of (g) ITGAE, gene encoding CD103, and (h) ITGB7, gene encoding integrin β 7, of MoDCs after treatment with RA and RARα siRNA. RT‐qPCR analyzed using the Pfaffl method 31 and normalized to GAPDH. Pooled data from three independent experiments; mean ± SD. *Reveals statistically significant difference from media control (P ≤ 0·05). One‐way analysis of varaince with Tukey’s multiple comparisons test.
Figure 4
Figure 4
Retinoic acid (RA) does not significantly increase the phosphorylation of SMAD2/3 in monocyte‐derived dendritic cells (MoDCs). (a) Schematic of experimental design. MoDCs were cultured with or without RA for 3 days. Transforming growth factor‐β 1 (TGF‐β 1) or TGF‐β 1 plus SB431542, a TGF‐β 1 inhibitor, were added to the cell culture, and cells were harvested for FACS analysis of SMAD2/3 phosphorylation 2 hr later. (b) FACS analysis of SMAD2/3 phosphorylation in MoDCs, pooled data from three independent experiments; mean ± SD. (c) Representative FACS histograms of SMA2/3 phosphorylation. Isotype control – gray‐shaded, SMAD2/3 antibody – solid black line. **Indicates statistical significance from the medium only control, P ≤ 0·01. Kruskal–Wallis one‐way analysis of variance with Dunn’s multiple comparisons test.
Figure 5
Figure 5
Retinoic acid (RA)‐induced CD103 expression in MoDCs is dependent on p38 mitogen‐activated protein kinase (MAPK) signaling. (a) Schematic of experimental design. Monocyte‐derived dendritic cells (MoDCs) were cultured for 3 days with RA or SB202190, a p38 MAPK inhibitor, before harvest for Western blot, PCR or FACS analysis. (b) Representative Western blot of MoDCs cultured with RA. (c) Band intensity of phosphorylated p38 protein normalized to GAPDH and total p38 MAPK protein. Pooled data from three independent experiments; mean ± SD. (d) Relative ITGAE gene expression of MoDCs cultured with RA and SB202190. Gene expression was analyzed by TaqMan qRT‐PCR, data were analyzed using the Pfaffl method. Pooled data from three independent experiments; mean ± SD. FACS analysis of CD103 (e, f) expression and (g) integrin β 7 expression in MoDCs treated with RA and/or SB202190 (e) Pooled data (n = 3) and (f) representative data for CD103 expression. Isotype control – gray histogram, CD103 antibody – black solid line. (g) Pooled data for β 7 expression; n = 4. *Represents statistically significant difference from medium control at P ≤ 0·05. One‐way analysis of variance with Tukey’s multiple comparisons test.
Figure 6
Figure 6
Retinoic acid (RA)‐induced expression of CD103 on blood dendritic cell (DC) subsets is dependent on p38 mitogen‐activated protein kinase (MAPK) signaling. (a) Schematic of experimental design. Blood DCs were isolated for healthy adult donors and cultured for 1 day with the addition of RA and SB202190, a p38 MAPK inhibitor, before harvest and FACS analysis. (b) FACS gating strategy of human blood DC subsets; CD141 – cDC1s, CD1c – cDC2s. Representative FACS histograms of CD103 expression on (c) cDC1s and (d) cDC2s. Isotype control – gray histogram, CD103 antibody – black solid line. (e, f) Pooled FACS data showing CD103 expression by CD141+ cDC1s and CD1c+ cDC2s. Individual data, mean ± SD, n = 5. One‐way analysis of variance with Tukey’s multiple comparisons test; *P ≤ 0·05, **P ≤ 0·01, **P ≤ 0·001.
Figure 7
Figure 7
Inhibition of nuclear factor of activated T cells (NFAT1c) abrogates retinoic acid (RA) ‐induced expression of CD103 on monocyte‐derived dendritic cells (MoDCs). (a) Schematic of experimental design. MoDCs were differentiated for 3 days before the addition of RA and 10–50 µm NFAT inhibitor. MoDCs were harvested 1 day after addition of RA and NFAT inhibitor and CD103 expression was analyzed by FACS. (b) Expression of CD103 on MoDCs treated with RA and different concentrations of NFAT inhibitor by FACS analysis; n = 4 independent experiments; mean ± SD. (c) Representative FACS histograms of CD103 expression. Isotype control – gray‐shaded histogram, CD103 antibody (black solid line). Indicates statistical significance. One‐way analysis of variance with Tukey’s multiple comparisons test, *P ≤ 0·05.

References

    1. Vermot J, Gallego Llamas J, Fraulob V, Niederreither K, Chambon P, Dolle P. Retinoic acid controls the bilateral symmetry of somite formation in the mouse embryo. Science 2005; 308:563–6. - PubMed
    1. Huang Z, Liu Y, Qi G, Brand D, Zheng SG. Role of vitamin A in the immune system. J Clin Med 2018; 7:258. - PMC - PubMed
    1. Erkelens MN, Mebius RE. Retinoic acid and immune homeostasis: a balancing act. Trends Immunol 2017; 38:168–80. - PubMed
    1. Zeng R, Bscheider M, Lahl K, Lee M, Butcher EC. Generation and transcriptional programming of intestinal dendritic cells: essential role of retinoic acid. Mucosal Immunol 2016; 9:183–93. - PMC - PubMed
    1. Zeng R, Oderup C, Yuan R, Lee M, Habtezion A, Hadeiba H et al Retinoic acid regulates the development of a gut‐homing precursor for intestinal dendritic cells. Mucosal Immunol 2013; 6:847–56. - PMC - PubMed

Publication types

MeSH terms