Multicenter Study
. 2020 Nov;72(5):1758-1770.
doi: 10.1002/hep.31483. Epub 2020 Oct 19.

Prenatal Exposure to Perfluoroalkyl Substances Associated With Increased Susceptibility to Liver Injury in Children

Affiliations
Multicenter Study

Prenatal Exposure to Perfluoroalkyl Substances Associated With Increased Susceptibility to Liver Injury in Children

Nikos Stratakis et al. Hepatology. 2020 Nov.

Abstract

Background and aims: Per- and polyfluoroalkyl substances (PFAS) are widespread and persistent pollutants that have been shown to have hepatotoxic effects in animal models. However, human evidence is scarce. We evaluated how prenatal exposure to PFAS associates with established serum biomarkers of liver injury and alterations in serum metabolome in children.

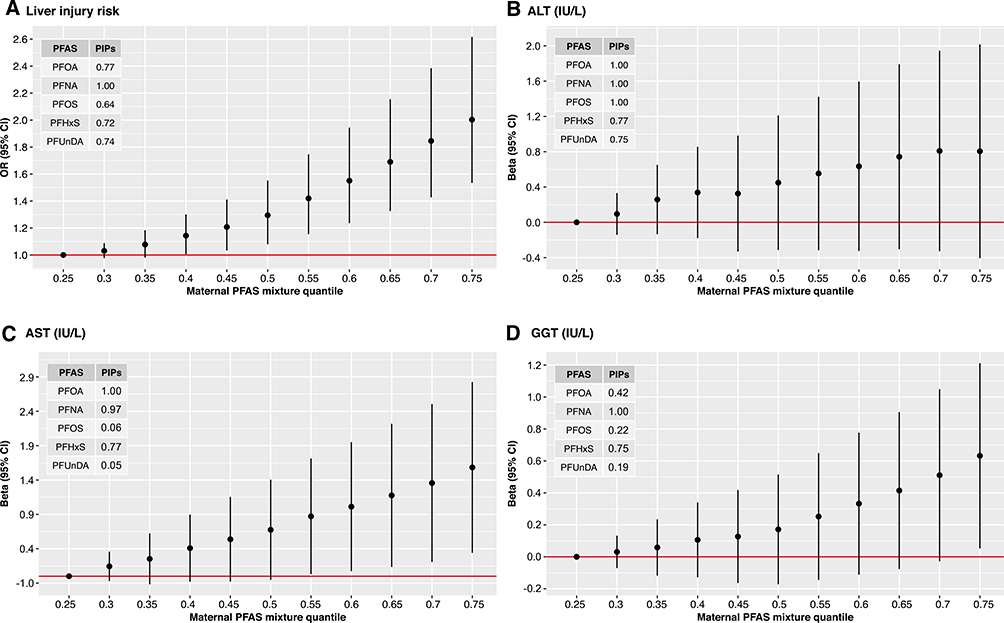
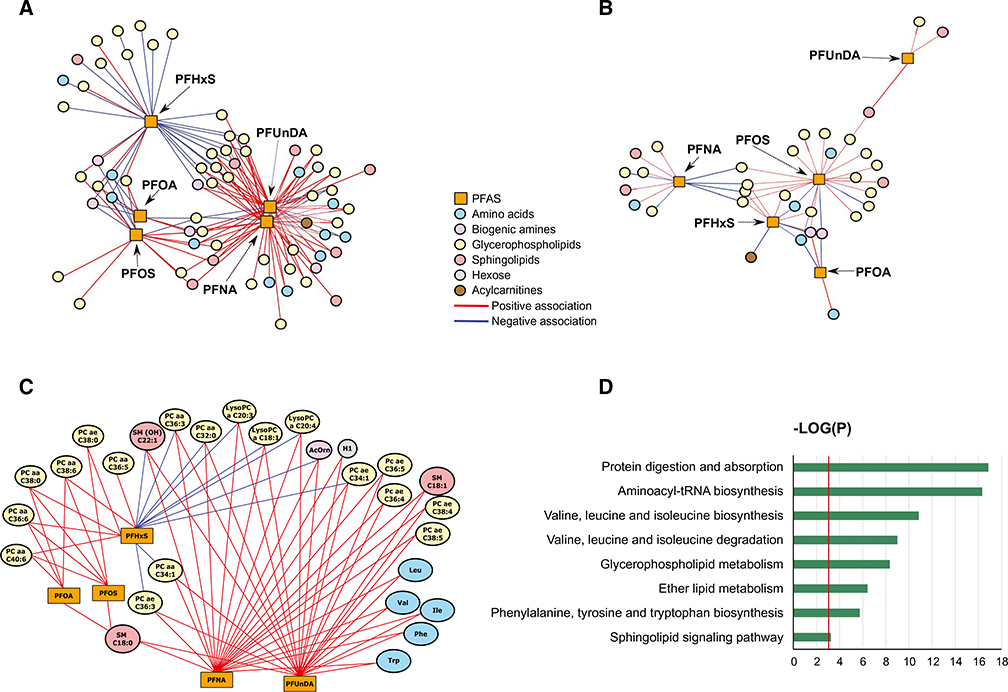
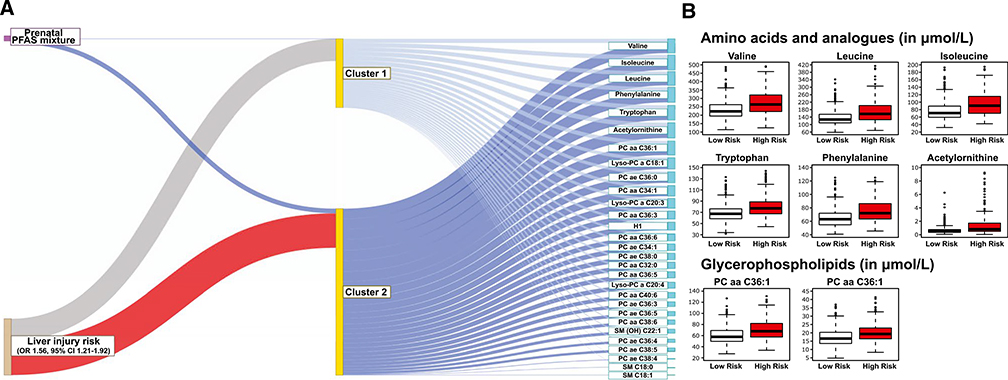
Approach and results: We used data from 1,105 mothers and their children (median age, 8.2 years; interquartile range, 6.6-9.1) from the European Human Early-Life Exposome cohort (consisting of six existing population-based birth cohorts in France, Greece, Lithuania, Norway, Spain, and the United Kingdom). We measured concentrations of perfluorooctane sulfonate, perfluorooctanoate, perfluorononanoate, perfluorohexane sulfonate, and perfluoroundecanoate in maternal blood. We assessed concentrations of alanine aminotransferase, aspartate aminotransferase, and gamma-glutamyltransferase in child serum. Using Bayesian kernel machine regression, we found that higher exposure to PFAS during pregnancy was associated with higher liver enzyme levels in children. We also measured child serum metabolomics through a targeted assay and found significant perturbations in amino acid and glycerophospholipid metabolism associated with prenatal PFAS. A latent variable analysis identified a profile of children at high risk of liver injury (odds ratio, 1.56; 95% confidence interval, 1.21-1.92) that was characterized by high prenatal exposure to PFAS and increased serum levels of branched-chain amino acids (valine, leucine, and isoleucine), aromatic amino acids (tryptophan and phenylalanine), and glycerophospholipids (phosphatidylcholine [PC] aa C36:1 and Lyso-PC a C18:1).

Conclusions: Developmental exposure to PFAS can contribute to pediatric liver injury.


Conflict of interest statement

Potential conflict of interest: Nothing to report.

Figures

FIG. 1.
FIG. 1.
Joint effect of prenatal PFAS mixture on liver injury risk and individual liver enzyme levels in children. Effect estimates were calculated by BKMR models adjusted for cohort, maternal age, education level, and prepregnancy BMI, child ethnicity, age, and sex. Graphs A, B, C and D depict the mixture response function for liver injury risk, alanine aminotransferase (ALT), aspartate aminotransferase (AST), and gamma-glutamyltransferase (GGT), respectively. Graphs show the difference in the effect estimates when all exposures are at a particular quantile compared to when all are at the 25th quantile. Circle represents effect estimates, black vertical lines represent 95% CIs, and red horizontal lines represent the null. Tables within the graphs depict the posterior inclusion probabilities (PIPs) of each PFAS in the mixture-response function for each outcome. PFHxS, perfluorohexane sulfonate; PFNA, perfluorononanoate; PFOA, perfluorooctanoate; PFOS, perfluorooctane sulfonate; PFUnDA, perfluoroundecanoate.
FIG. 2.
FIG. 2.
Integrated differential network analysis of maternal blood PFAS during pregnancy and child serum metabolites. (A) Network structure of PFAS and metabolites in children at high liver injury risk. (B) Network structure of PFAS and metabolites in children at low liver injury risk. (C) Network structure of PFAS and metabolites with differential contribution to the high- versus low-risk network (|delta eigenvector centrality| ≥0.2) in children at high liver injury risk. Pair-wise association scores between PFAS and metabolites were estimated using sparse partial least squares regression. Graphs A, B, and C depict significant PFAS-metabolite associations at P < 0.05. (D) Overpresentation analysis of metabolites with differential contribution to the high- versus low-risk network. Blue bars indicate −log(P) based on the hypergeometric test. Red vertical line indicates the P value threshold of 0.05.
FIG. 3.
FIG. 3.
Integrated latent variable analysis on prenatal PFAS-mixture exposure and child serum metabolome. (A) Identification of a subgroup of children at risk of liver injury. The thick blue line connecting PFAS-mixture exposure to Cluster 2 indicate positive association (OR for 75th vs. 25th percentile, 2.16; 95% CI, 1.84, 2.53), compared to Cluster 1 (reference). The blue lines connecting the clusters to metabolites indicate positive associations. The thick red line connecting Cluster 2 and liver injury risk shows that children in the Cluster 2 had a higher risk for liver injury (OR, 1.56; 95% CI, 1.21–1.92) compared to those in Cluster 1. (B) Distribution of selected amino acid and glycerophospholipid metabolites in children with high probability of inclusion to Cluster 2 (P (Highrisk|PFASmixture, Metabolites)≥0.5) compared to those with low probability of inclusion. Median μmol/L values (25th-75th percentile) for children with low versus high inclusion probability were 223.0 (195.0, 265.0) versus 264.0 (220.0, 320.3) for valine, 127.0 (109.0, 155.0) versus 157.0 (126.0, 201.5) for leucine, 70.8 (59.94, 89.4) versus 90.6 (70.2, 115.3) for isoleucine, 67.4 (58.6, 76.3) versus 77.1 (67.5, 88.7) for tryptophan, 63.1 (54.8, 72.0) versus 72.1 (63.4, 85.9) for phenylalanine, 0.52 (0.35, 0.77) versus 0.81 (0.50, 1.71) for acetylornithine, 57.8 (49.7, 69.2) versus 67.8 (57.5, 81.7) for PC aa C36:1, and 16.6 (13.6, 20.3) versus 19.3 (16.4, 22.9) for Lyso-PC a C18:1.

Comment in

References

    1. Anderson EL, Howe LD, Jones HE, Higgins JP, Lawlor DA, Fraser A. The prevalence of non-alcoholic fatty liver disease in children and adolescents: a systematic review and meta-analysis. PLoS One 2015;10:e0140908. - PMC - PubMed
    1. ) Welsh JA, Karpen S, Vos MB. Increasing prevalence of nonalcoholic fatty liver disease among United States adolescents, 1988–1994 to 2007–2010. J Pediatr 2013;162:496–500.e1. - PMC - PubMed
    1. Estes C, Razavi H, Loomba R, Younossi Z, Sanyal AJ. Modeling the epidemic of nonalcoholic fatty liver disease demonstrates an exponential increase in burden of disease. Hepatology 2018;67:123–133. - PMC - PubMed
    1. Stefan N, Haring HU, Cusi K. Non-alcoholic fatty liver disease: causes, diagnosis, cardiometabolic consequences, and treatment strategies. Lancet Diabetes Endocrinol 2018. August 30 10.1016/S2213-8587(18)30154-2. - DOI - PubMed
    1. Heindel JJ, Blumberg B, Cave M, Machtinger R, Mantovani A, Mendez MA, et al. Metabolism disrupting chemicals and metabolic disorders. Reprod Toxicol 2017;68:3–33. - PMC - PubMed

Publication types

MeSH terms