. 2021 Jan;85(1):480-494.
doi: 10.1002/mrm.28435. Epub 2020 Aug 1.

Comparison of parameter optimization methods for quantitative susceptibility mapping

Affiliations

Comparison of parameter optimization methods for quantitative susceptibility mapping

Carlos Milovic et al. Magn Reson Med. 2021 Jan.

Abstract

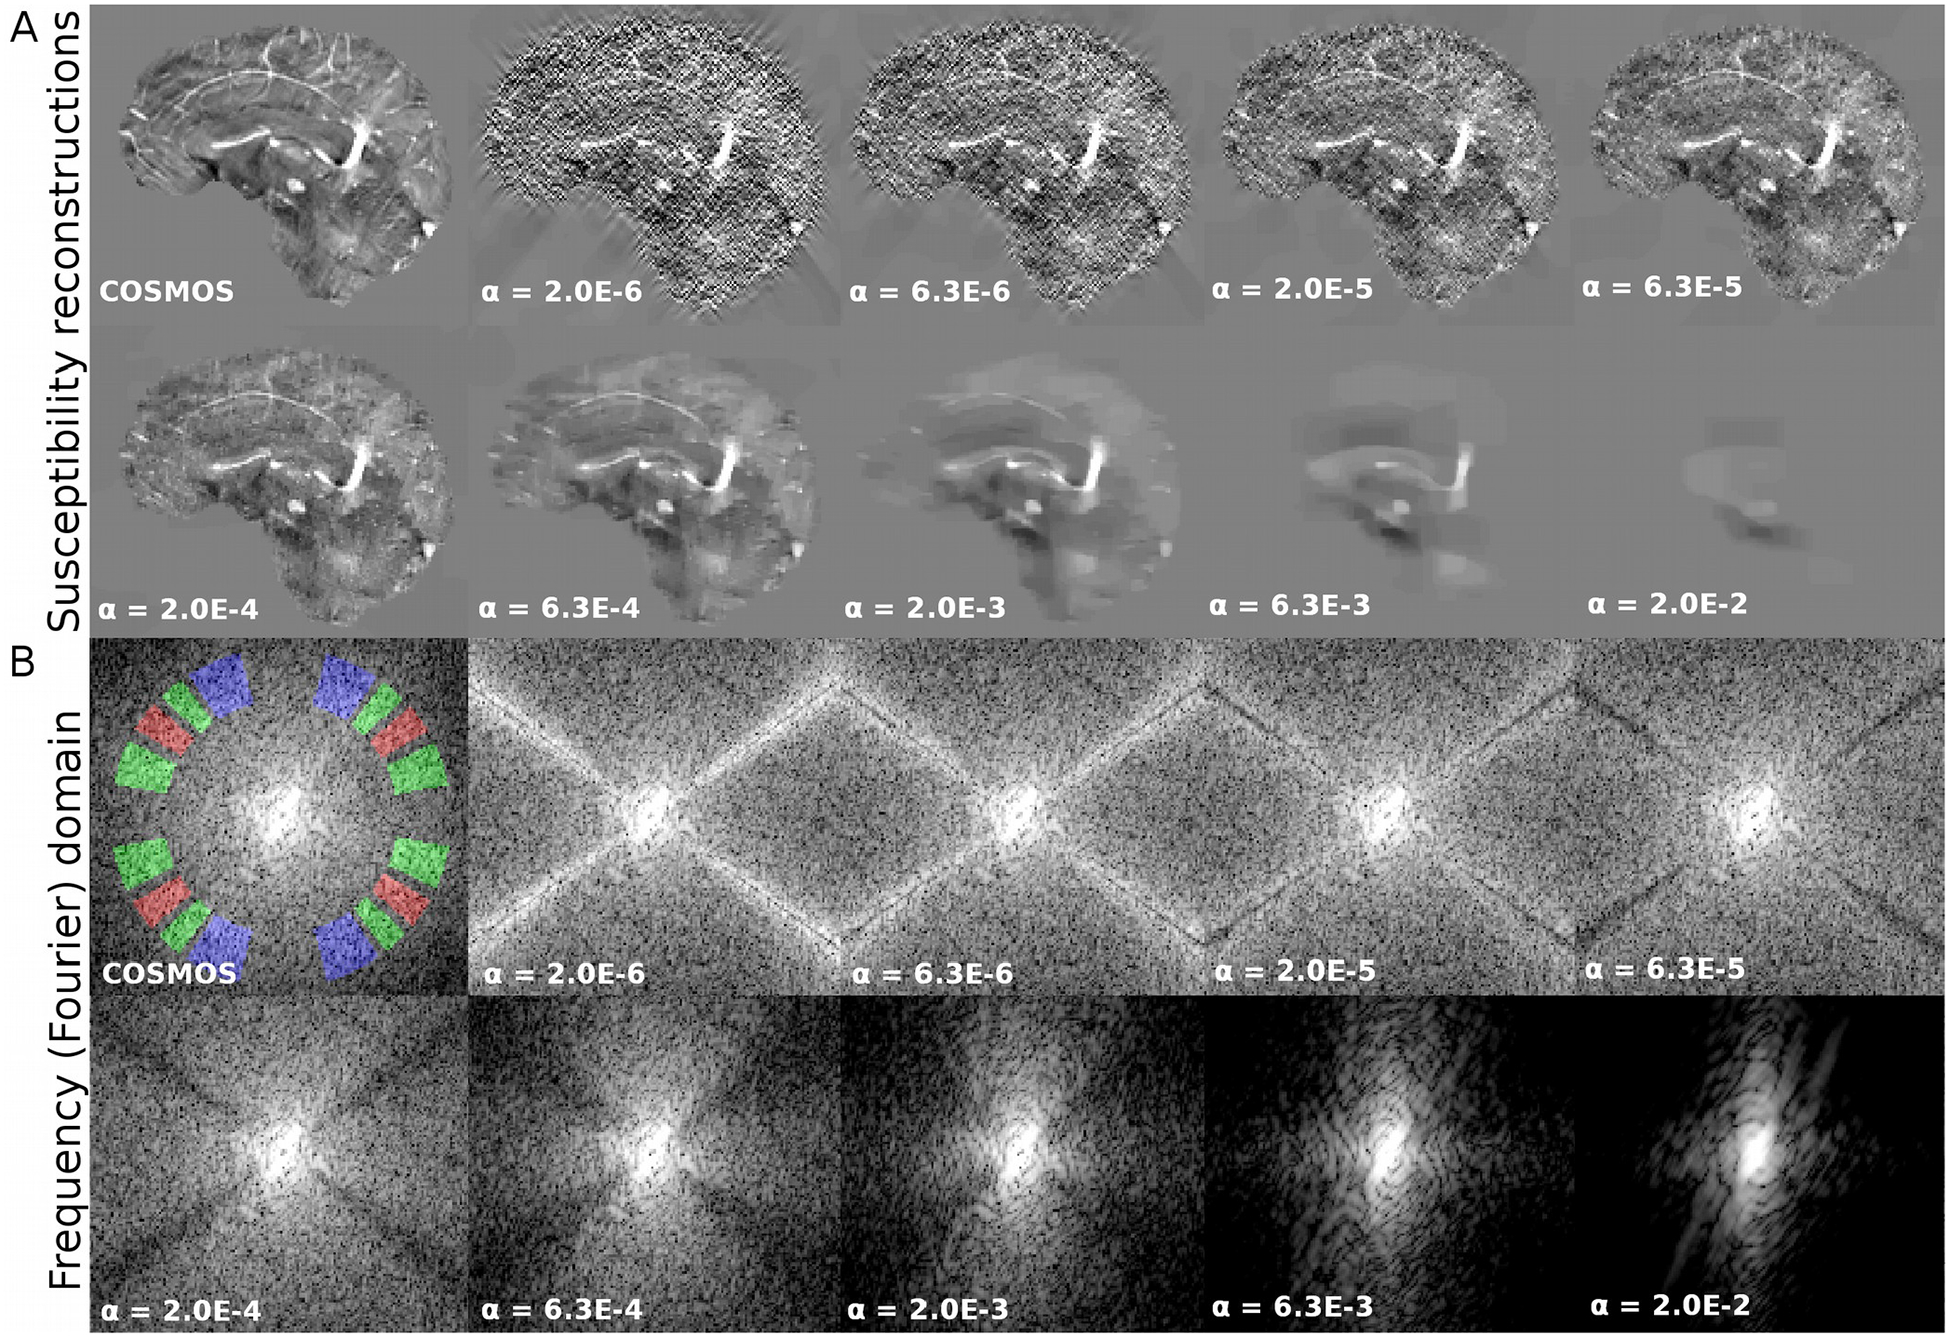
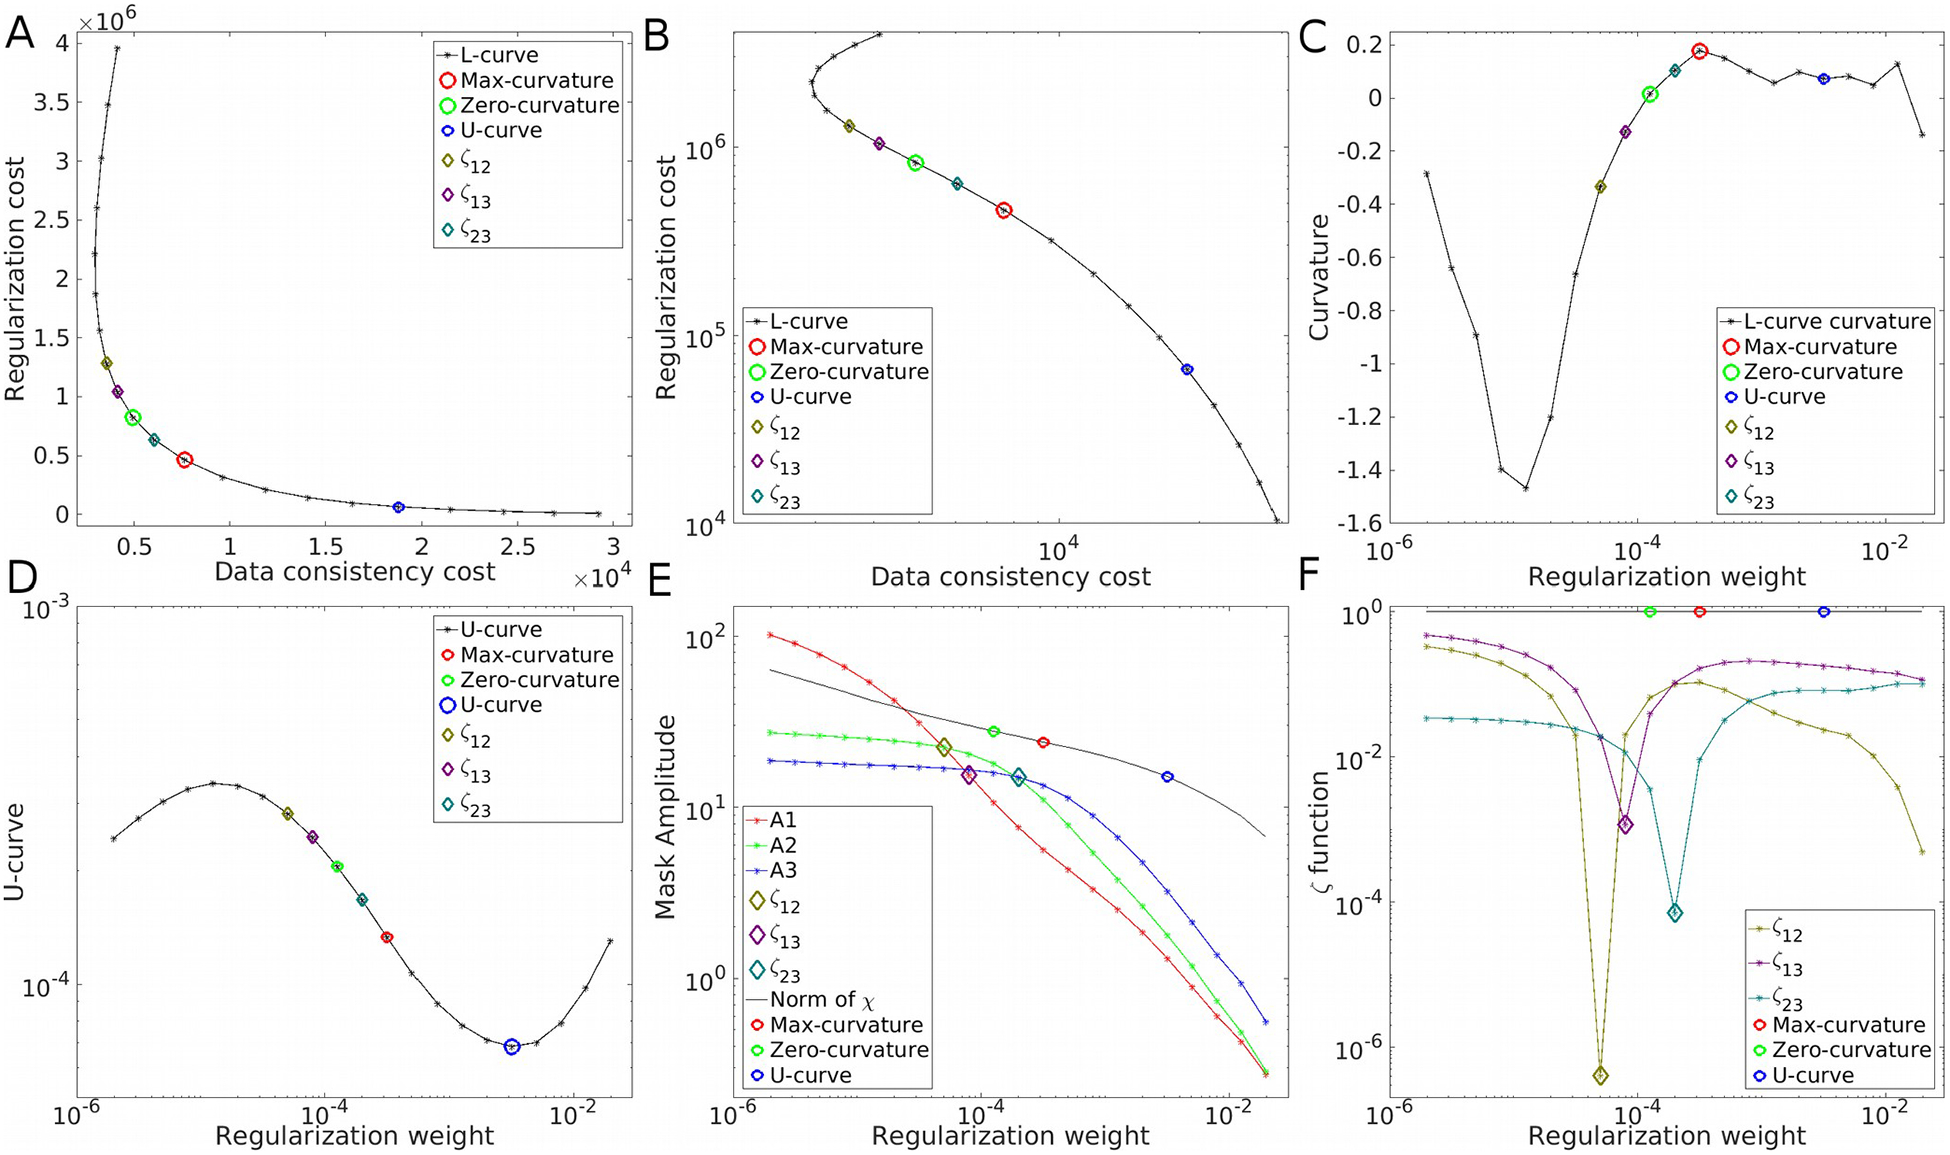
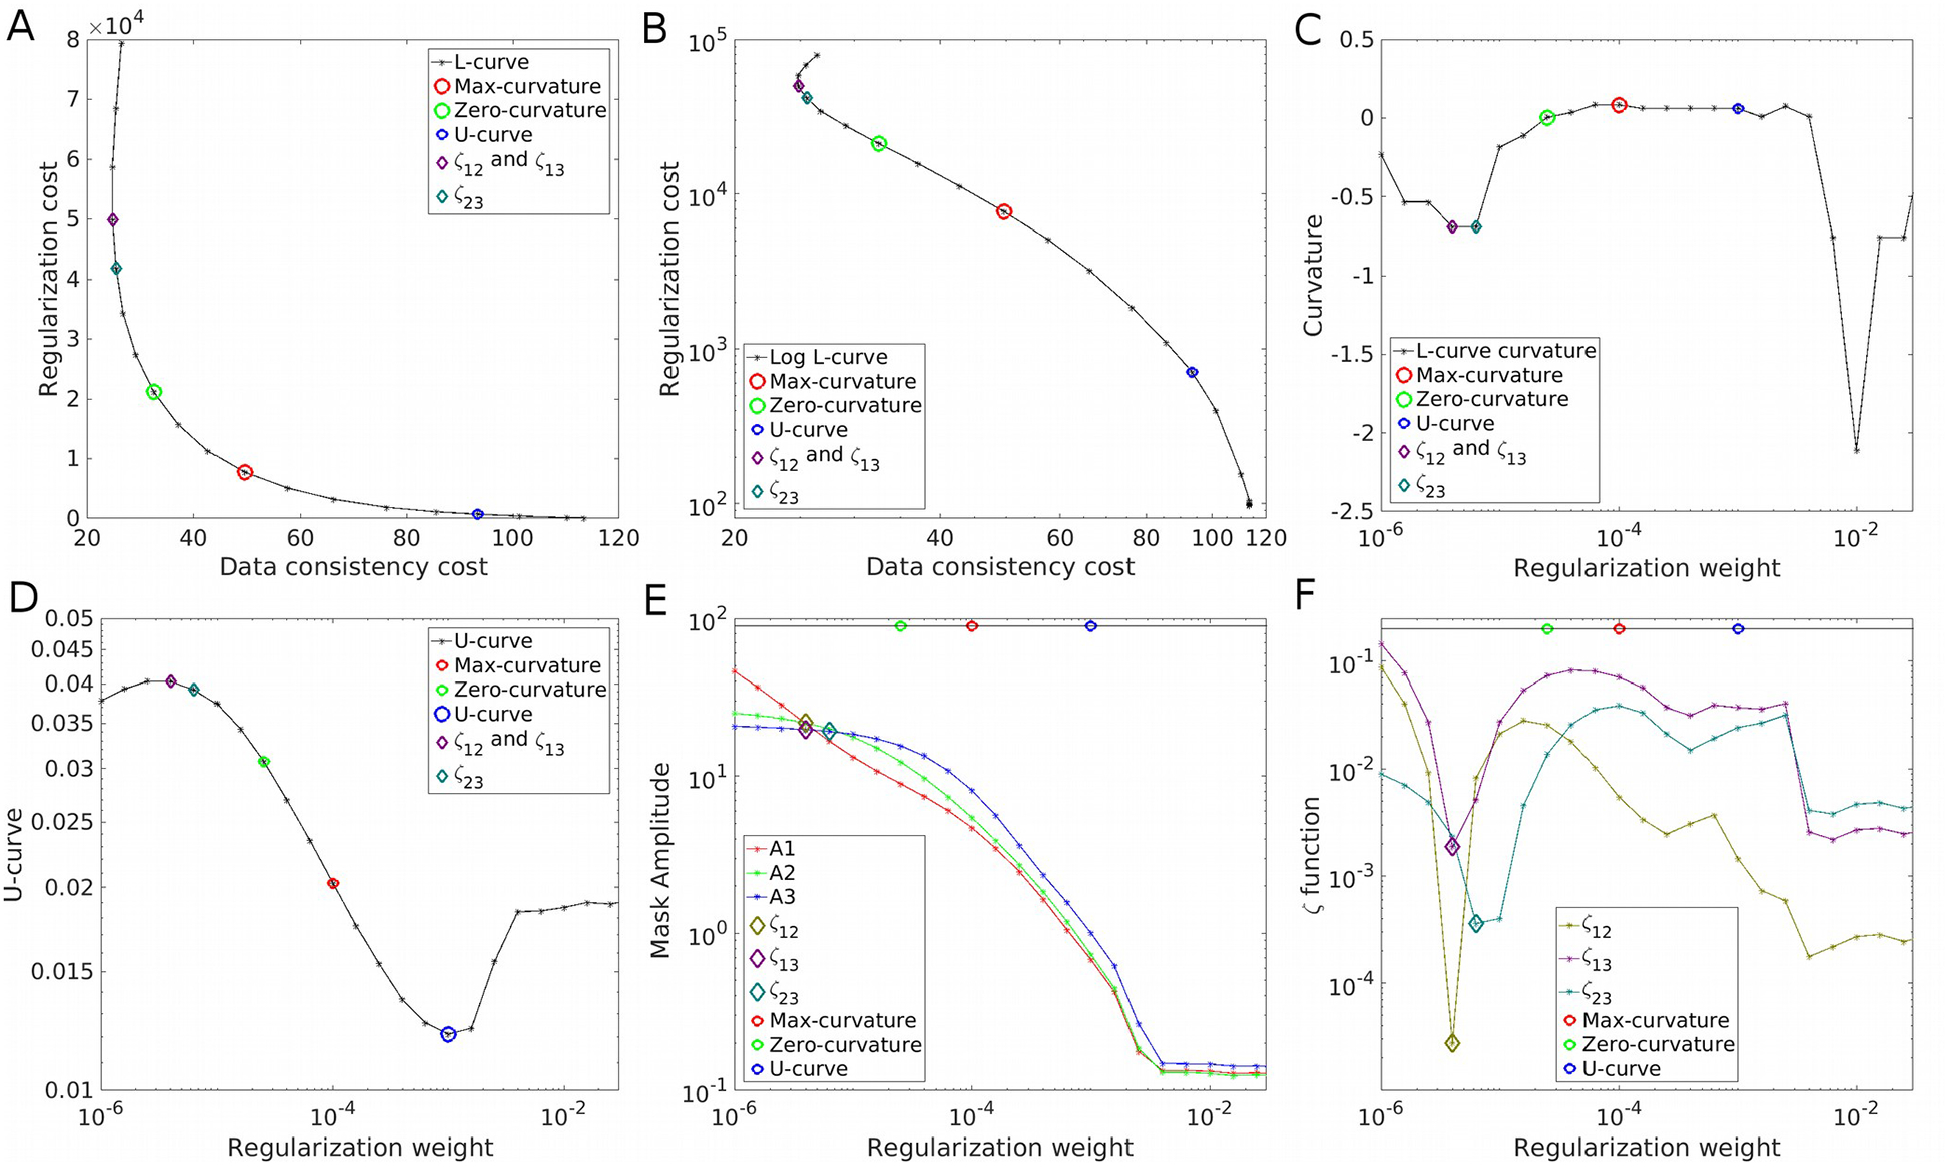
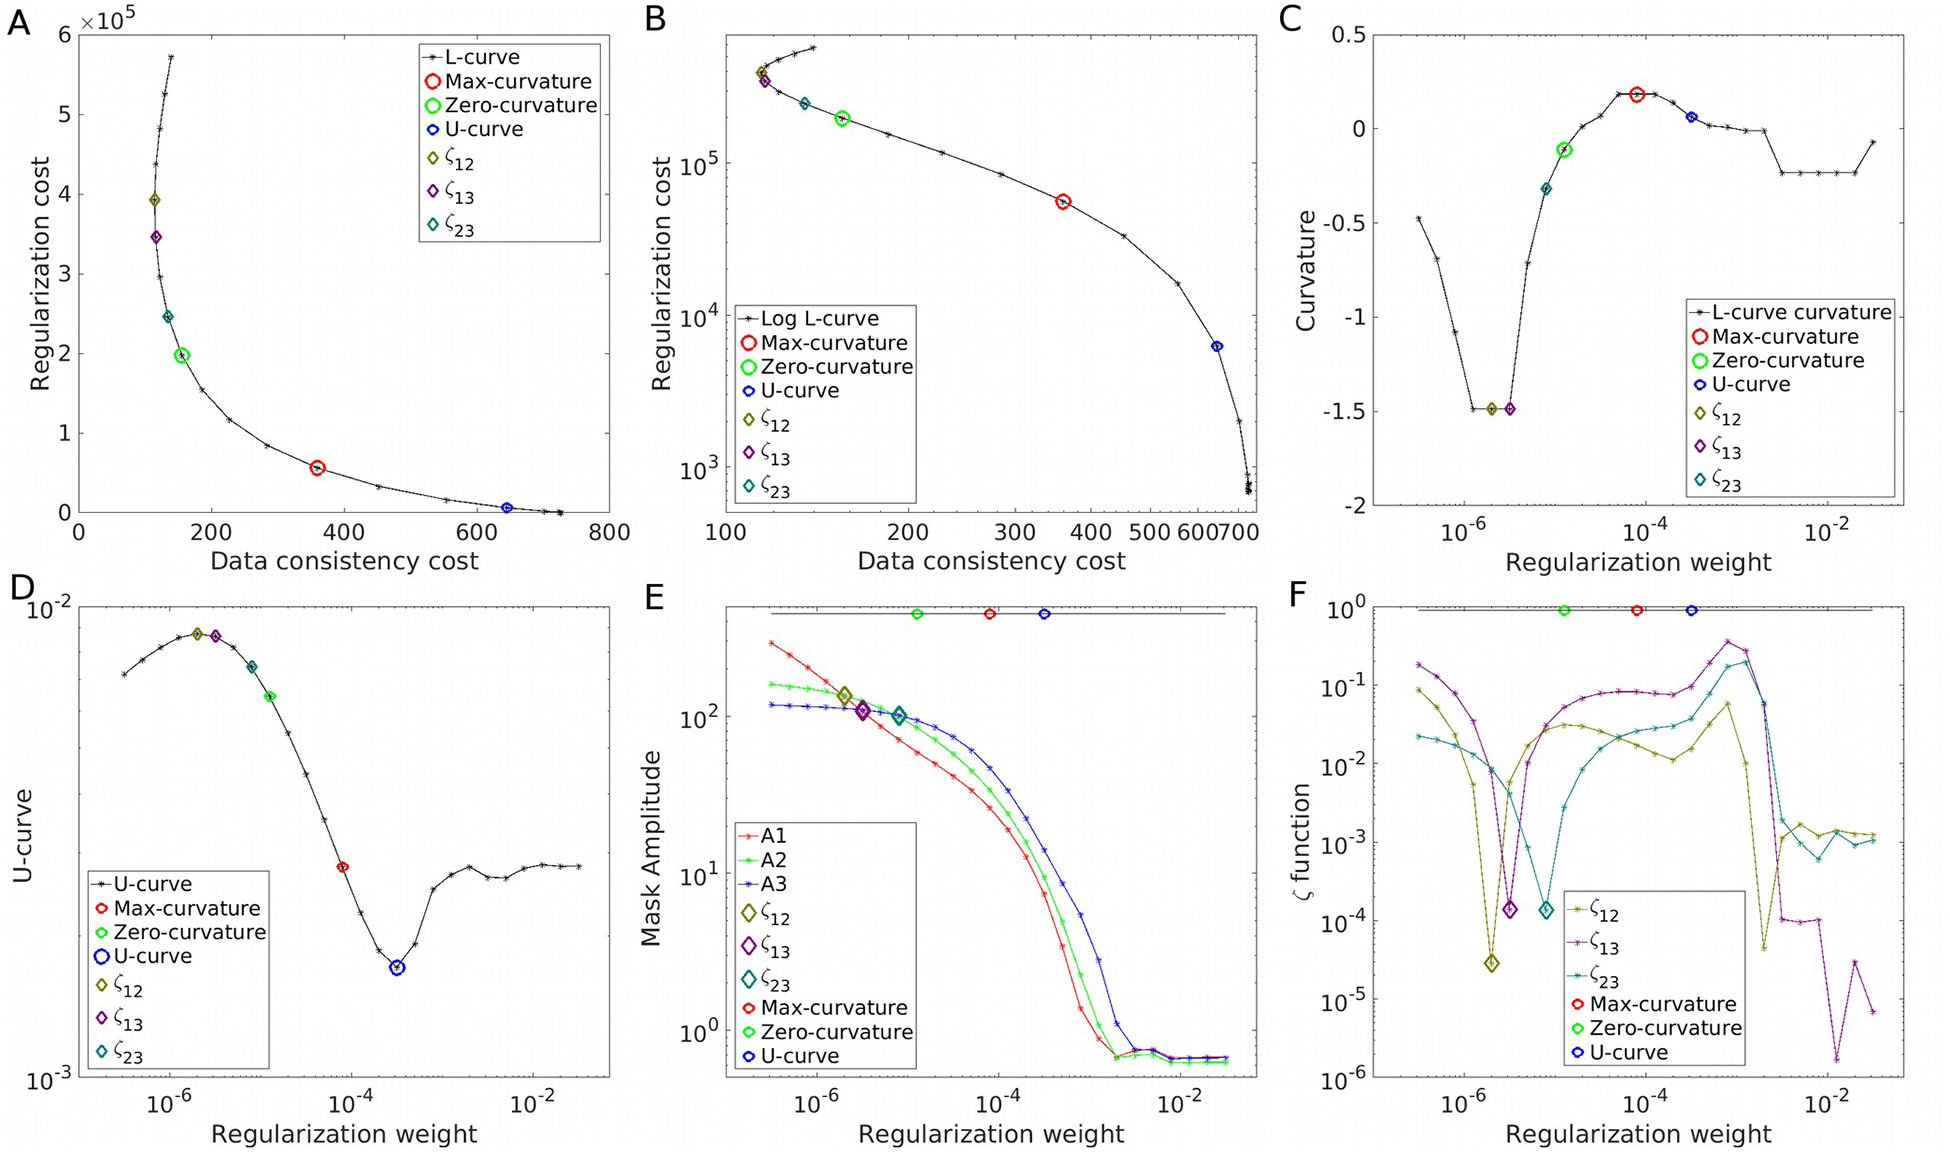
Purpose: Quantitative Susceptibility Mapping (QSM) is usually performed by minimizing a functional with data fidelity and regularization terms. A weighting parameter controls the balance between these terms. There is a need for techniques to find the proper balance that avoids artifact propagation and loss of details. Finding the point of maximum curvature in the L-curve is a popular choice, although it is slow, often unreliable when using variational penalties, and has a tendency to yield overregularized results.

Methods: We propose 2 alternative approaches to control the balance between the data fidelity and regularization terms: 1) searching for an inflection point in the log-log domain of the L-curve, and 2) comparing frequency components of QSM reconstructions. We compare these methods against the conventional L-curve and U-curve approaches.

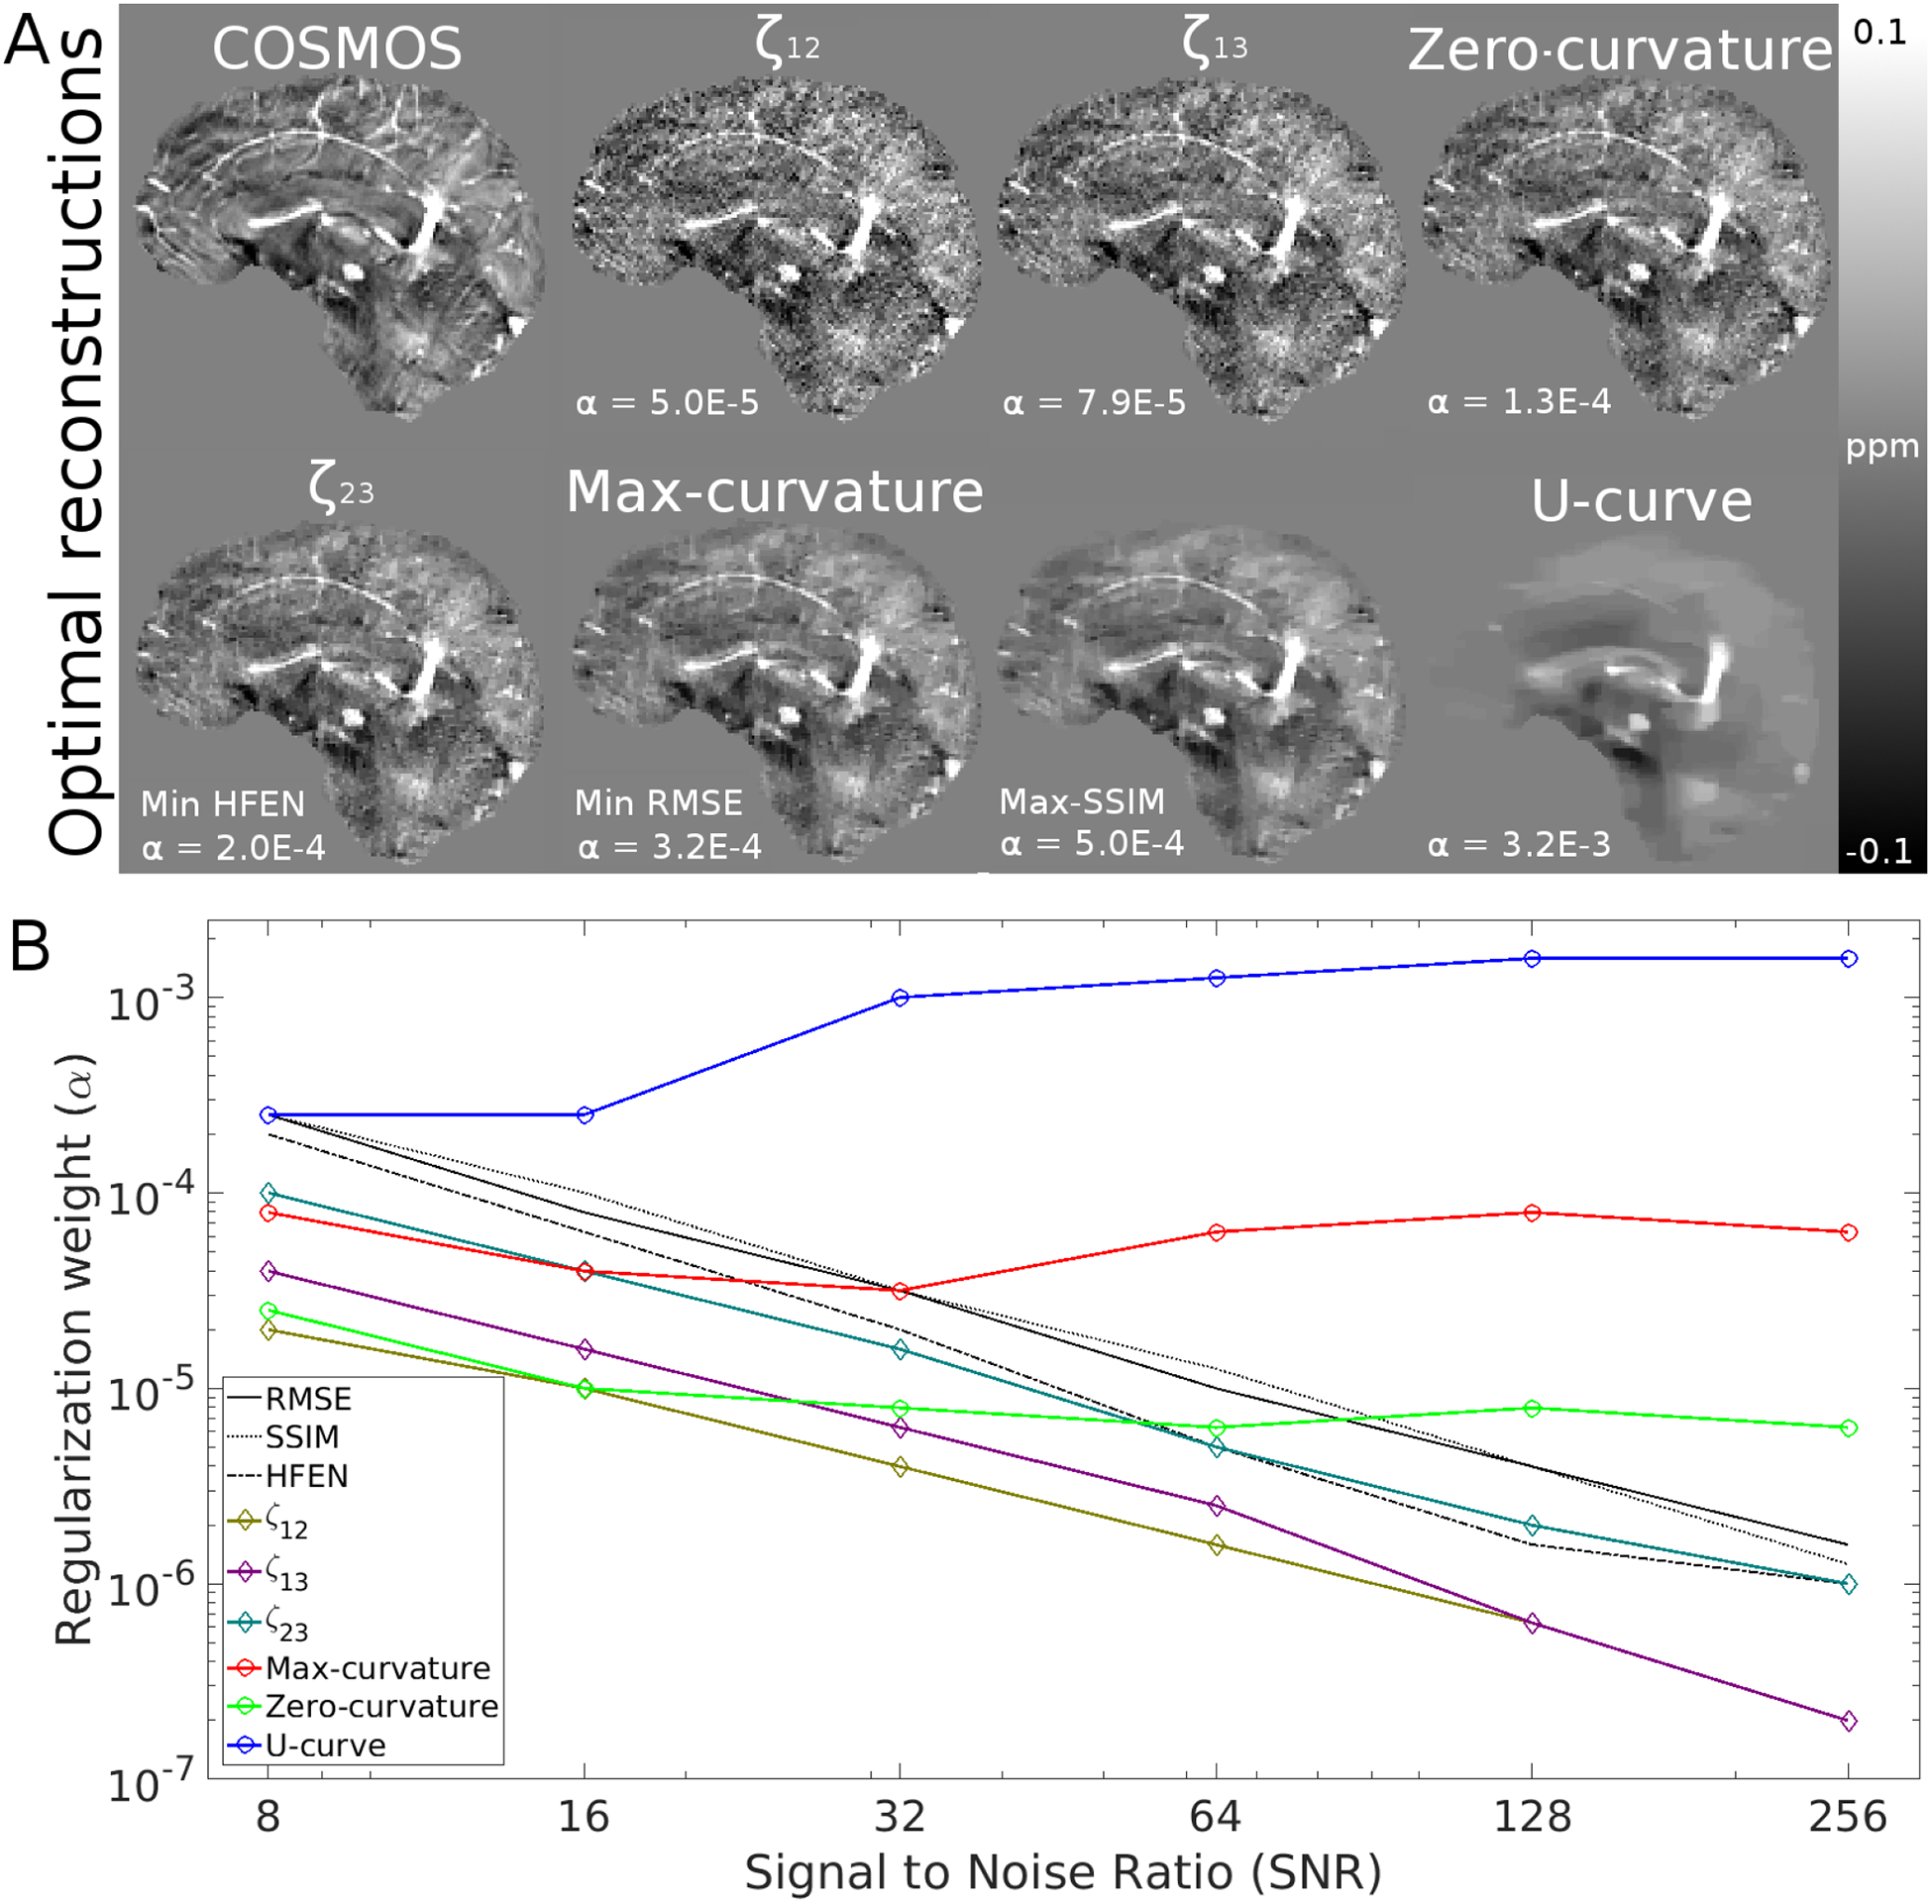
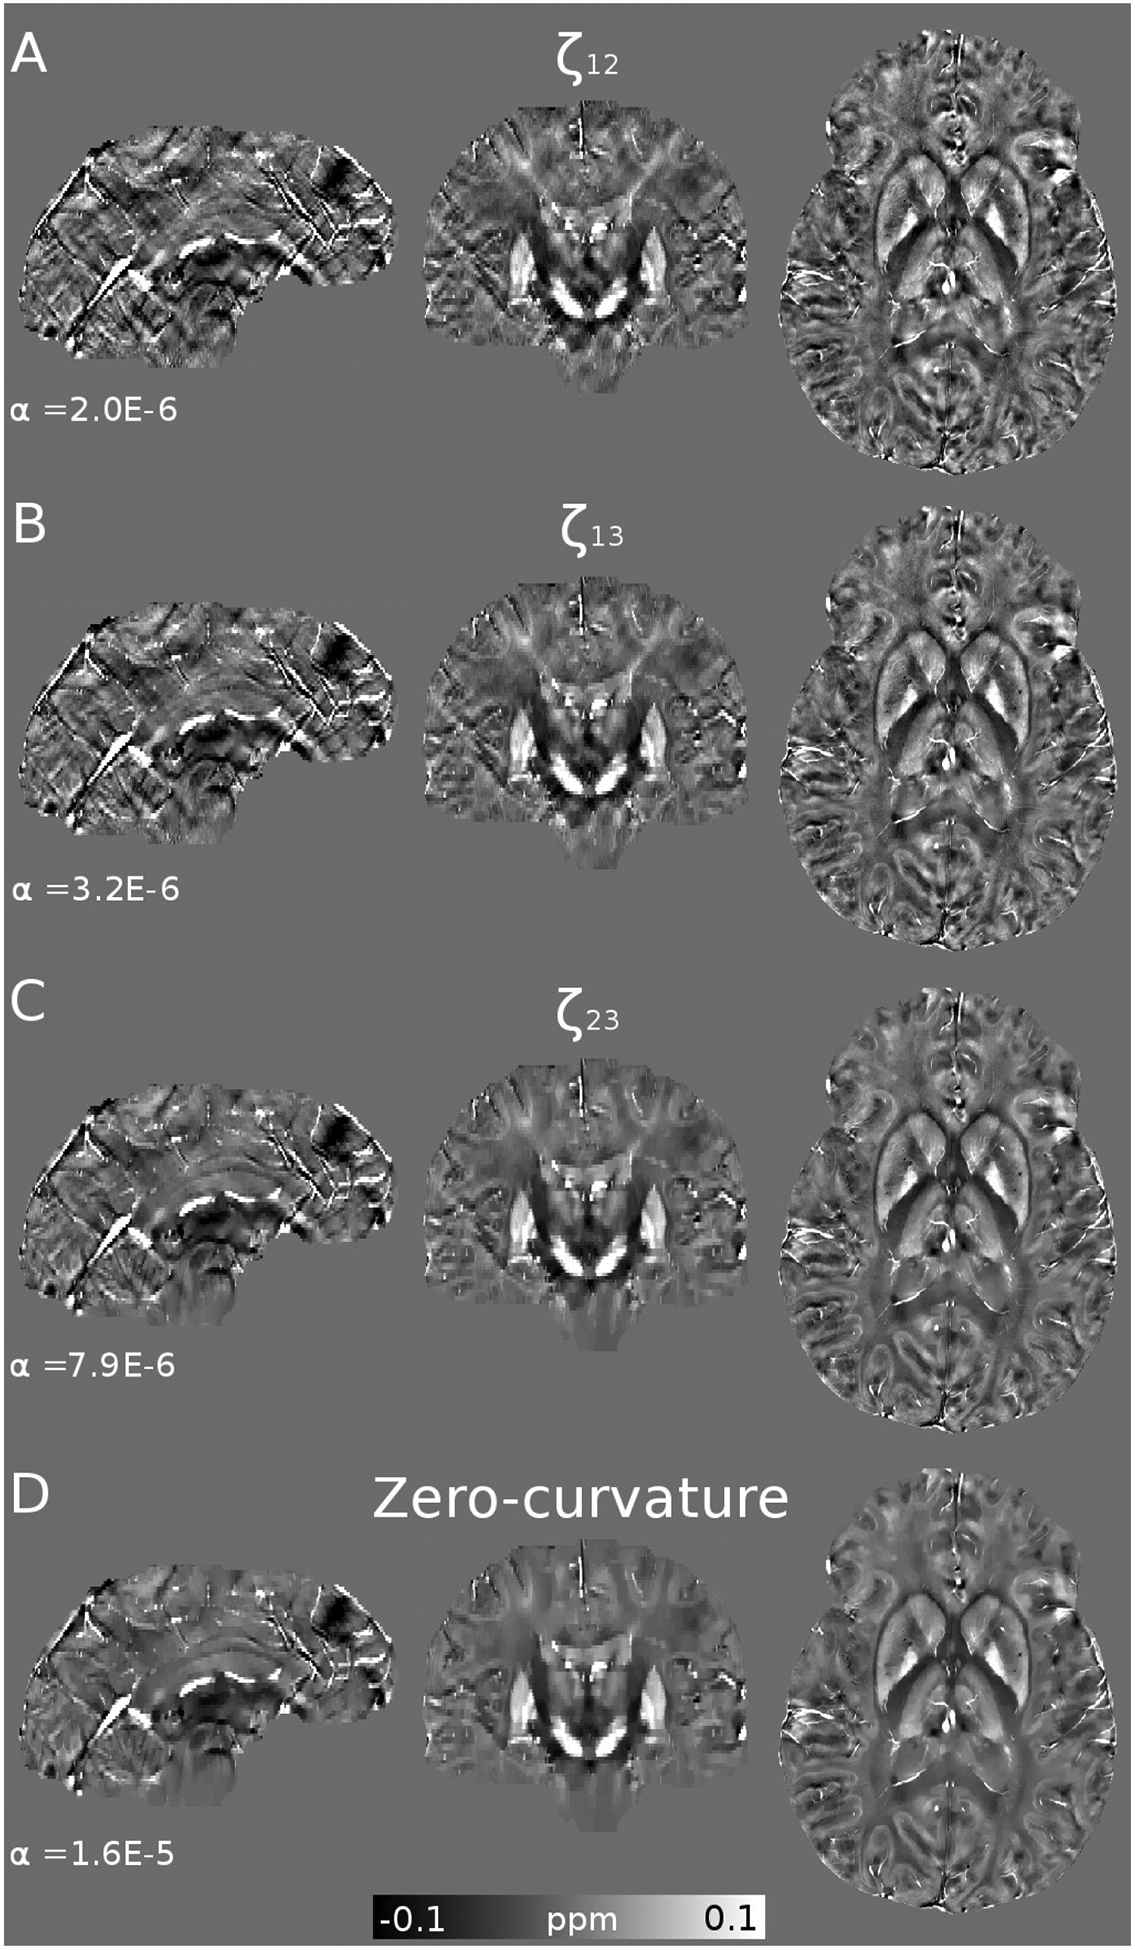
Results: Our methods achieve predicted parameters that are better correlated with RMS error, high-frequency error norm, and structural similarity metric-based parameter optimizations than those obtained with traditional methods. The inflection point yields less overregularization and lower errors than traditional alternatives. The frequency analysis yields more visually appealing results, although with larger RMS error.

Conclusion: Our methods provide a robust parameter optimization framework for variational penalties in QSM reconstruction. The L-curve-based zero-curvature search produced almost optimal results for typical QSM acquisition settings. The frequency analysis method may use a 1.5 to 2.0 correction factor to apply it as a stand-alone method for a wider range of signal-to-noise-ratio settings. This approach may also benefit from fast search algorithms such as the binary search to speed up the process.

Keywords: QSM; alternating direction method of multipliers (ADMM); augmented Lagrangian; total variation.


Figures

Figure 1.
Figure 1.
QSM reconstructions (A) and their Fourier transforms (B) for different regularization weights. Proposed ROI masks are represented in red (M1), green (M2) and blue (M3) overlying the COSMOS frequency ground-truth.
Figure 2.
Figure 2.
Parameter optimization strategies on the COSMOS-brain simulations at SNR=40. The L-curve in linear (A) and logarithm (B) representations, with its curvature (C). The U-curve (D). Frequency analysis using the amplitude estimations A1, A2 and A3 (E) and the ζ cost functions (F).
Figure 3.
Figure 3.
COSMOS-based simulation. (A) shows the optimal reconstructions and regularizations weights (α) using the Frequency, L-curve and U-curve analysis, along with the ground-truth. Also represented here are the best scoring HFEN, RMSE and SSIM results. (B) shows the evolution of the optimal regularization weights for each method and metric as function of the SNR.
Figure 4.
Figure 4.
Parameter optimization strategies on the QSM Challenge in vivo data. The L-curve in linear (A) and logarithm (B) representations, with its curvature (C). The U-curve (D). Frequency analysis using the amplitude estimations A1, A2 and A3 (E) and the ζ cost functions (F).
Figure 5.
Figure 5.
Optimal reconstructions and regularizations weights (α) of the QSM Challenge in vivo data, using the Frequency (A, B), L-curve (C, D) and U-curve analysis (E).
Figure 6.
Figure 6.
Parameter optimization strategies on the 7T Siemens in vivo data. The L-curve in linear (A) and logarithm (B) representations, with its curvature (C). The U-curve (D). Frequency analysis using the amplitude estimations A1, A2 and A3 (E) and the ζ cost functions (F).
Figure 7.
Figure 7.
Optimal reconstructions and regularizations weights (α) of the 7T Siemens in vivo data, using the Frequency (A, B, E), L-curve (B, C) and U-curve analysis (D).
Figure 8.
Figure 8.
Coronal and sagittal cuts for Fourier transform of the original ROIs masks (A), and arbitrary selection of frequency ranges and same dipole kernel coefficients (B), and the modified ROIs masks to account for the anisotropy and the uneven frequency distribution.
Figure 9.
Figure 9.
Parameter optimization strategies on the 7T Siemens in vivo data with modified ROIs. The L-curve in linear (A) and logarithm (B) representations, with its curvature (C). The U-curve (D). Frequency analysis using the amplitude estimations A1, A2 and A3 (E) and the ζ cost functions (F).
Figure 10.
Figure 10.
Optimal reconstructions and regularizations weights (α) of the 7T Siemens in vivo data with modified ROIs, using the Frequency (AC), and zero-curvature point of the L-curve (D).

References

    1. Haacke EM, Brown R, Thompson M, Venkatesan R. Magnetic Resonance Imaging: Physical Principles and Sequence Design.
    1. Salomir R, De Senneville BD, Moonen CTW. A fast calculation method for magnetic field inhomogeneity due to an arbitrary distribution of bulk susceptibility. Concepts Magn Reson. 2003;19B(1):26–34. doi:10.1002/cmr.b.10083 - DOI
    1. Marques JPP, Bowtell R. Application of a fourier-based method for rapid calculation of field inhomogeneity due to spatial variation of magnetic susceptibility. Concepts Magn Reson Part B Magn Reson Eng. 2005;25(1):65–78. doi:10.1002/cmr.b.20034 - DOI
    1. Wharton S, Schäfer A, Bowtell R. Susceptibility mapping in the human brain using threshold-based k-space division. Magn Reson Med. 2010;63(5):1292–1304. doi:10.1002/mrm.22334 - DOI - PubMed
    1. Shmueli K, de Zwart J a, van Gelderen P, Li T-Q, Dodd SJ, Duyn JH. Magnetic susceptibility mapping of brain tissue in vivo using MRI phase data. Magn Reson Med. 2009;62(6):1510–1522. doi:10.1002/mrm.22135 - DOI - PMC - PubMed

Publication types