. 2021 May 4;72(9):e334-e342.
doi: 10.1093/cid/ciaa1130.

The First 100 Days of Severe Acute Respiratory Syndrome Coronavirus 2 (SARS-CoV-2) Control in Vietnam

Collaborators, Affiliations

The First 100 Days of Severe Acute Respiratory Syndrome Coronavirus 2 (SARS-CoV-2) Control in Vietnam

Pham Quang Thai et al. Clin Infect Dis. .

Abstract

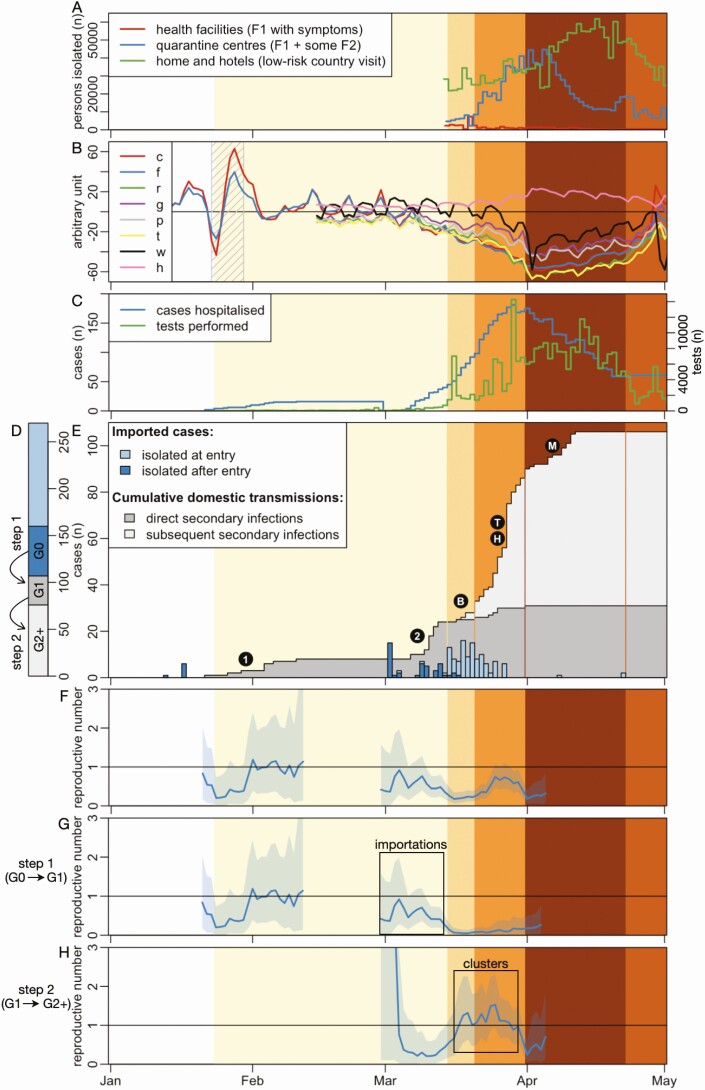
Background: One hundred days after severe acute respiratory syndrome coronavirus 2 (SARS-CoV-2) was first reported in Vietnam on 23 January, 270 cases were confirmed, with no deaths. We describe the control measures used by the government and their relationship with imported and domestically acquired case numbers, with the aim of identifying the measures associated with successful SARS-CoV-2 control.

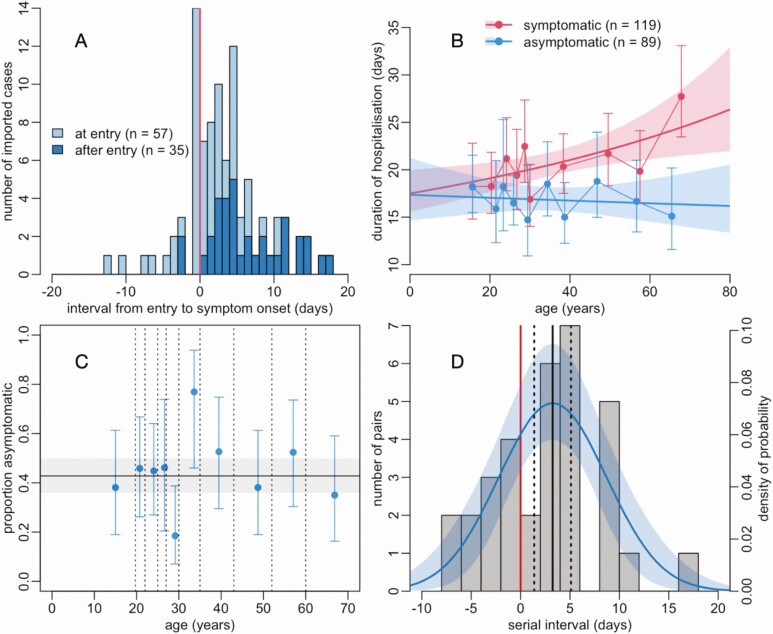
Methods: Clinical and demographic data on the first 270 SARS-CoV-2 infected cases and the timing and nature of government control measures, including numbers of tests and quarantined individuals, were analyzed. Apple and Google mobility data provided proxies for population movement. Serial intervals were calculated from 33 infector-infectee pairs and used to estimate the proportion of presymptomatic transmission events and time-varying reproduction numbers.

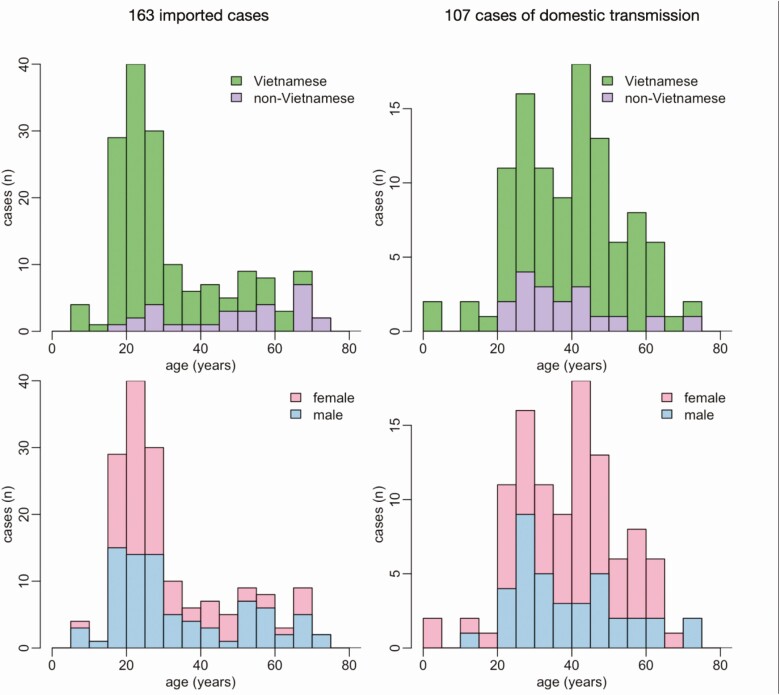
Results: A national lockdown was implemented between 1 and 22 April. Around 200 000 people were quarantined and 266 122 reverse transcription polymerase chain reaction (RT-PCR) tests conducted. Population mobility decreased progressively before lockdown. In total, 60% (163/270) of cases were imported; 43% (89/208) of resolved infections remained asymptomatic for the duration of infection. The serial interval was 3.24 days, and 27.5% (95% confidence interval [CI], 15.7%-40.0%) of transmissions occurred presymptomatically. Limited transmission amounted to a maximum reproduction number of 1.15 (95% CI, .·37-2.·36). No community transmission has been detected since 15 April.

Conclusions: Vietnam has controlled SARS-CoV-2 spread through the early introduction of mass communication, meticulous contact tracing with strict quarantine, and international travel restrictions. The value of these interventions is supported by the high proportion of asymptomatic and imported cases, and evidence for substantial presymptomatic transmission.

Keywords: COVID-19; SARS-CoV-2; Vietnam; asymptomatic; epidemic control.


Figures

Figure 1.
Figure 1.
Timeline of SARS-CoV-2 emergence and response in Vietnam. Background color reflects the intensity of the interventions taken by the Vietnam government to control the COVID-19 epidemic, with darker shades indicating more intense disease control measures. The main events of these periods are described in detail in Table 1. A, Number of people in isolation by day. B, Relative indexes of population movements: number of travellers by car (c), on foot (f) (both from Apple Mobility Data [13]), proxies of people in retail and recreation areas (r), in groceries stores and pharmacies (g), in parks (p), in bus transit stations (t), at work (w), and at home (h), all from Google Community Mobility Data [14]. Hashed area indicates the lunar New Year holiday (23–29 January). Traditionally, the first half of the week is spent at home with close family, whereas the second half of the week is dedicated to visits of members of the extended family. C, Number of SARS-CoV-2 positive cases hospitalised and RT-PCR tests performed by day. D, Cumulative number of detected SARS-CoV-2 positive cases in Vietnam, differentiating imported cases (G0) and whether they were isolated at entry or later, and locally transmitted cases and whether they were in direct contact with imported cases (G1) or not (G2+). E, Numbers of SARS-CoV-2 imported cases together with cumulative numbers of local transmissions. Circled characters indicate major internal transmission events: first introduction of SARS-CoV-2 virus in the country (1: 16 cases), second introduction (2: 15 cases), cluster of transmission in a Ho Chi Minh City bar (B: 19 cases), cluster of transmission in a large Hanoi hospital (H: 17 cases), community cluster of transmission linked to the Hanoi hospital through catering staff (T: 28 cases) and community cluster of transmission in Me Linh district in the north of Hanoi (M: 13 cases). FH, Estimates of the reproduction number for the 2 epidemics. Panel G focuses only on the first step of the chain of transmission between G0 and G1, whereas panel H focuses on all the other steps of the chain of transmission. Panel F includes all detected cases. The shaded blue area shows the 95% confidence intervals. Abbreviations: COVID-19, coronavirus disease 2019; RT-PCR, reverse transcription polymerase chain reaction; SARS-COV-2, severe acute respiratory syndrome coronavirus 2.
Figure 2.
Figure 2.
Demographics of the 270 SARS-CoV-2 positive cases in Vietnam. Age distribution for the 163 imported cases (left column) and the 107 cases of local transmission (right column), by nationality (top row) and sex (bottom row). Abbreviation: SARS-CoV-2, severe acute respiratory syndrome coronavirus 2.
Figure 3.
Figure 3.
Asymptomatic and symptomatic SARS-CoV-2 infection in Vietnam. A, Distribution of the interval between entry into the country and the onset of symptoms for 92 symptomatic imported SARS-CoV-2 positive cases, differentiating those who were isolated at entry from those who were not. Symptoms occurred after entry on the right-hand side of the vertical red line. B, Duration of hospital stay of 208 discharged SARS-CoV-2 positive cases. Dots and error bars show mean and 95% confidence interval (assuming a gamma distribution) per decile of age, lines and shaded areas show gamma regression fits and their 95% confidence intervals. Corresponding gamma regression table is in Table S2. C, Relationship between age and the proportion asymptomatic among 208 discharged SARS-CoV-2 positive cases. Vertical dotted lines indicate deciles of the age distribution, with the proportion asymptomatic estimated within each of these deciles. Vertical error bars show 95% confidence intervals. Horizontal line and the gray area show the average across ages and its 95% confidence interval. Corresponding logistic regression table is in Table S3. D, Distribution of serial intervals for 33 infector-infectee pairs together with a normal distribution fitted to it. The shaded area shows the 95% confidence interval. The vertical black line shows the estimate of the mean serial interval, together with its 95% confidence interval (dashed vertical lines). The proportion of the distribution to the left of the red line is a proxy for the proportion of infections that occur before the onset of symptoms. Abbreviation: SARS-CoV-2, severe acute respiratory syndrome coronavirus 2.

Comment in

References

    1. Zhu N, Zhang D, Wang W, et al. . A novel coronavirus from patients with pneumonia in China, 2019. N Engl J Med 2020; 382:727–33. - PMC - PubMed
    1. Zheng M, Song L. Novel antibody epitopes dominate the antigenicity of spike glycoprotein in SARS-CoV-2 compared to SARS-CoV. Cell Mol Immunol 2020; 17:1–3. - PMC - PubMed
    1. Li Q, Guan X, Wu P, et al. . Early transmission dynamics in Wuhan, China, of novel coronavirus–infected pneumonia. N Engl J Med 2020; 382:1199–207. - PMC - PubMed
    1. Sanche S, Lin YT, Xu C, Romero-Severson E, Hengartner N, Ke R. High contagiousness and rapid spread of severe acute respiratory syndrome coronavirus 2. Emerg Infect Dis 2020; 26:1199. - PMC - PubMed
    1. Fu L, Wang B, Yuan T, et al. . Clinical characteristics of coronavirus disease 2019 (COVID-19) in China: a systematic review and meta-analysis. J Infect 2020; 80:656–65. - PMC - PubMed