. 2020 Oct 6;32(4):591-604.e7.
doi: 10.1016/j.cmet.2020.07.001. Epub 2020 Jul 31.

Mitochondrial Oxidative Damage Underlies Regulatory T Cell Defects in Autoimmunity

Affiliations

Mitochondrial Oxidative Damage Underlies Regulatory T Cell Defects in Autoimmunity

Themis Alissafi et al. Cell Metab. .

Abstract

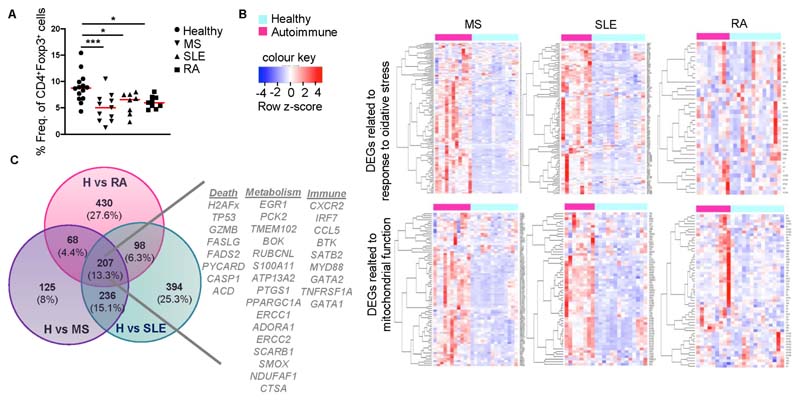
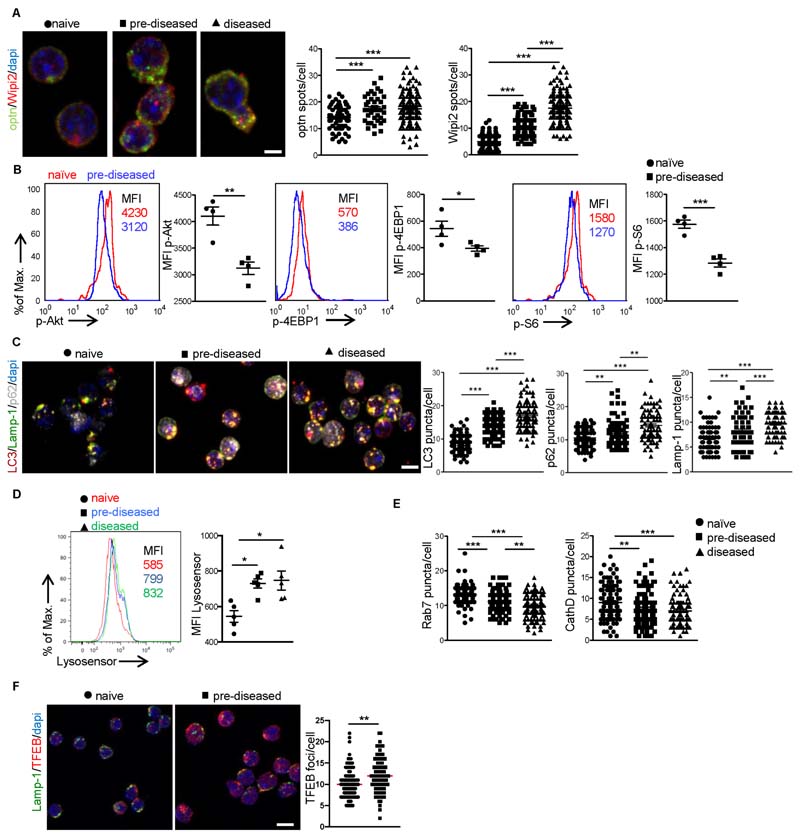
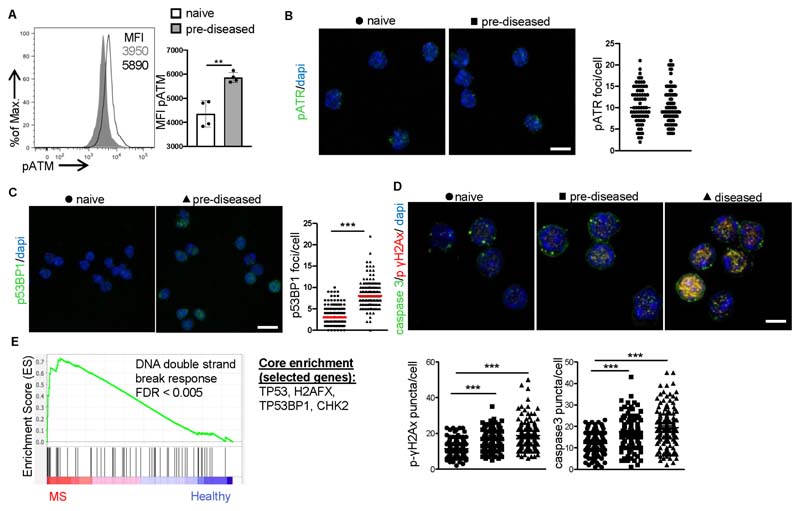
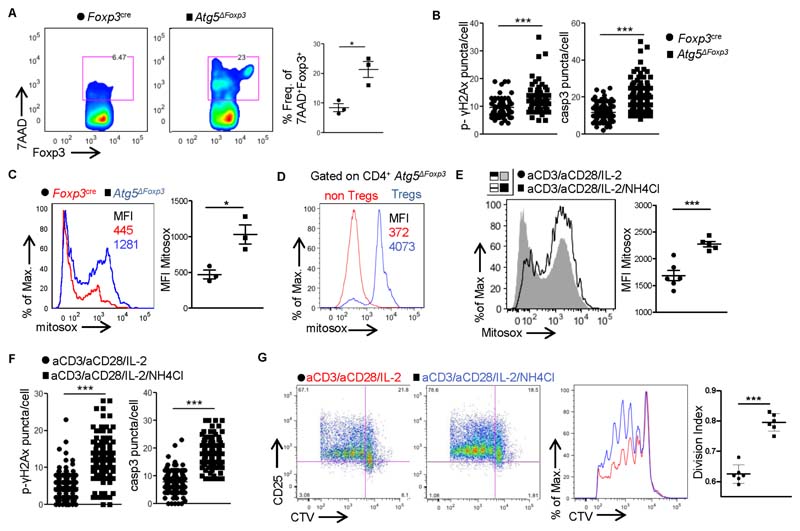
Regulatory T cells (Tregs) are vital for the maintenance of immune homeostasis, while their dysfunction constitutes a cardinal feature of autoimmunity. Under steady-state conditions, mitochondrial metabolism is critical for Treg function; however, the metabolic adaptations of Tregs during autoimmunity are ill-defined. Herein, we report that elevated mitochondrial oxidative stress and a robust DNA damage response (DDR) associated with cell death occur in Tregs in individuals with autoimmunity. In an experimental autoimmune encephalitis (EAE) mouse model of autoimmunity, we found a Treg dysfunction recapitulating the features of autoimmune Tregs with a prominent mtROS signature. Scavenging of mtROS in Tregs of EAE mice reversed the DDR and prevented Treg death, while attenuating the Th1 and Th17 autoimmune responses. These findings highlight an unrecognized role of mitochondrial oxidative stress in defining Treg fate during autoimmunity, which may facilitate the design of novel immunotherapies for diseases with disturbed immune tolerance.

Keywords: DNA damage response; autoimmunity; lysosome; metabolism; mitochondrial oxidative stress; regulatory T cell.


Conflict of interest statement

Declaration of Interests The authors declare no competing interests.

Figures

None
Graphical abstract
Figure 1
Figure 1. Treg cells isolated from the peripheral blood of individuals with autoimmune diseases are metabolically reprogrammed
(A) Frequencies of CD4+CD127-CD25+Foxp3+ Treg cells from the peripheral blood of healthy individuals (n = 14) and individuals with autoimmunity: MS (n = 11), SLE (n = 8), RA (n = 9). Results are expressed as mean ± SEM. Statistical significance was obtained by one-way ANOVA. ***P = 0.0008, *P = 0.0242, *P = 0.0196. (B) Heatmaps of enriched gene sets found during GSEA analysis of healthy vs autoimmune Treg cell samples. Genes from similar enriched processes were pooled and depicted in a single heatmap. (C) Venn diagram showing the overlap among significant DEGs of Healthy vs MS, Healthy vs RA and Healthy vs SLE comparisons. A signature of 33 selected genes involved in cell death, metabolism and immune related responses is depicted. See also Figure S1 and Supplemental Table 1.
Figure 2
Figure 2. Treg cells during autoimmune responses experience an impaired mitochondrial function.
(A)Seahorse analysis of oxygen consumption rate (OCR) in CD4+CD25+GITR+ Treg cells isolated from dLNs (inguinal) of naïve or immunized mice 9 d following s.c. Mog35-55/CFA injection. For B-F CD4+Foxp3+ Treg cells were isolated from dLNs (inguinal for pre-diseased or cervical for diseased) of naïve, pre-diseased or EAE induced with disease activity score > 3.5, Foxp3gfp.KI mice. (B)Intracellular ATP values are depicted for naïve (n = 6), pre-diseased (n = 6) and diseased (n = 5) Foxp3+ Treg cells (****P < 0.0001). (C) Mitochondrial membrane potential measured by flow cytometry using TMRE. Mean fluorescence intensity (MFI) of TMRE is depicted for naïve (n = 9), pre-diseased (n = 10) and diseased Treg cells (n = 8) (*P = 0.0423, *P = 0.05). (D) MFI of cytochrome c in naïve or pre-diseased Treg cells. One representative experiment of two is depicted (n = 4 mice per group, *P = 0.0492). (E) Representative immunofluorescence confocal microscopy images for Mitotracker (red) and DAPI (blue) and Mitotracker puncta/cell, (n = 5 mice per group, *P = 0.0111). (F) Representative images of Foxp3+ Treg cells using transmission electron microscopy are depicted. (G) Treg cells were isolated as CD4+CD127-CD25+ cells from peripheral blood of healthy individuals (n = 14) and subjects with MS (n = 11). GSEA plot showing the enrichment of “GO Mitochondrial depolarization” (NES 1.42, FDR 0.23) gene set. The top enriched genes are listed to the right of each plot. Results are presented as mean ± SEM. Statistical significance was obtained by One-way ANOVA or unpaired Student’s t-test. See also Figure S2
Figure 3
Figure 3. Mitochondrial oxidative stress is a hallmark of Treg cells in autoimmune environments.
For A-C CD4+Foxp3+ Treg cells were isolated from dLNs (inguinal for pre-diseased or cervical for diseased) of naïve, pre-diseased or EAE induced with disease activity score > 3.5 Foxp3gfp.KI mice. (A) Mean Fluorescence Intenstity (MFI) of mtROS production measured by flow cytometry using mitosox Red in naïve (n = 13), pre-diseased (n = 9) and diseased Treg cells (n = 5) (*P = 0.0191, **P = 0.0075). (B) Immunofluorescence confocal microscopy for 8-OHDG (red), TOM20 (green) and DAPI (blue) in isolated Treg cells. Representative fields (10 μm scale bar) from three independent experiments are depicted. Pearson correlation analysis for co-localization efficiency is depicted (***P < 0.0001). (C) SOD2 (**P = 0.0069) and mCAT (*P = 0.0336) enzyme activity measured in isolated mitochondria from naïve (n = 4) or pre-diseased Treg cells (n = 3). Each sample was pooled from n = 4 - 5 mice. (D) Treg cells were isolated as CD4+CD127-CD25+ cells from peripheral blood of healthy individuals (n = 14) and subjects with MS (n = 11). GSEA plot showing the enrichment of “GO Response to Oxidative Stress” (NES 1.43, FDR 0.23) gene set is depicted. The top enriched genes are listed to the right of each plot. Results are expressed as mean ± SEM. Statistical significance was obtained by unpaired Student’s t- test (C) or One-way ANOVA (A, B).
Figure 4
Figure 4. Treg cells exhibit incomplete mitophagy during autoimmune responses.
CD4 Foxp3 Treg cells were isolated from dLNs of naïve, pre-diseased or diseased Foxp3gfpKI mice. (A) Immunofluorescence confocal microscopy for Optn (red), Wipi2 (green) and DAPI (blue) (10 pm scale bar). Fields from one representative experiment of three are depicted. Optn (***P < 0.0001) and Wipi2 (*** P < 0.0001) puncta/cell are depicted. (B) MFI of p-Akt (**P = 0.0032), p-4EBP1 (*P = 0.0487) and p-S6 (***P = 0.0005) (n = 4 mice per group). (C) Immunofluorescence confocal microscopy for LC3 (red), Lamp-1 (green), p62 (silver white) and DAPI (blue) (10 pm scale bar). Fields from one representative experiment of three are shown. LC3 (***P < 0.0001), Lamp-1 (**P = 0.0032, ***P = 0.0002, ***P < 0.0001) and p62 (**P = 0.0020, **P = 0.0026, ***P < 0.0001) puncta/cell are depicted. (D) MFI of Lysosensor Green DND (n = 5 mice per group, *P = 0.0166, *P = 0.0290). (E) Rab7 (**P = 0.0021, ***P < 0.0001) and CathD (**P = 0.0086, ***P = 0.0005) puncta/cell are depicted. (F) Immunofluorescence confocal microscopy for TFEB (red), Lamp-1 (green) and DAPI (blue) (10 pm scale bar). Fields from one representative experiment of three are depicted. TFEB (**P = 0.011) puncta/cell are depicted. Results are expressed as mean ± SEM. Statistical significance was obtained by One-way ANOVA or unpaired Student’s t-test. See also Figure S3.
Figure 5
Figure 5. Increased DDR and cell death are Treg cell checkpoints in autoimmunity.
For A-D Treg cells were isolated from Foxp3gfp.KI mice. (A) MFI of pATM (**P = 0.0021), (n = 4 mice per group). One representative experiment of three is depicted. (B) Immunofluorescence confocal microscopy for pATR (green) and dapi (blue) (10 pm scale bar) (n = 4 mice per group). Fields from one representative experiment of two are depicted. pATR puncta/cell are depicted. (C) Immunofluorescence confocal microscopy for p53BP1 (green) and dapi (blue) (10 μm scale bar) (n = 4 mice per group). Fields from one representative experiment of two are depicted. p53BP1 puncta/cell (***P < 0.0001). (D) Immunofluorescence confocal microscopy for pH2Ax (red), caspase 3 (green) and DAPI (blue). Representative fields from three independent experiments (10 μm scale bar). Caspase 3 (***P < 0.0001) and pH2AX (***P < 0.0001) puncta/cell are depicted. (E) Treg cells were isolated as CD4+CD127-CD25+ cells from peripheral blood of healthy individuals (n = 14) and subjects with MS (n = 11). GSEA plot showing the enrichment of “GO DNA double strand break response” (NES 1.78, FDR < 0.005) gene set is depicted. The top enriched genes are listed to the right of the plot. Results are expressed as mean ± SEM. Statistical significance was obtained by One-way ANOVA or unpaired Student’s t-test. See also Figure S4.
Figure 6
Figure 6. Defective lysosomal function and mitophagy in Treg cells enhance mitochondrial oxidative stress and DDR, promoting cell death.
For A-D Treg cells were isolated from peripheral LNs or spleen (when indicated) of naïve Foxp3Cre or Atg5AFoxp3 n = 3 mice per group. One representative experiment of three is depicted. (A) Flow cytometric analysis and frequencies of 7AAD+CD4+Foxp3+ Treg cells (*P = 0.0132). (B) pH2Ax (*** P < 0.0001) and caspase 3 (***P < 0.0001) puncta/cell. (C) MFI of Mitosox (*P = 0.0191). (D) MFI of Mitosox gated on CD4+Foxp3- T cells or CD4+Foxp3+ Treg cells is depicted. For E-G CD4+Foxp3+ Treg cells isolated from LNs of naïve Foxp3gfp K\ mice were in vitro activated with aCD3/aCD28 beads and IL-2 in the presence or absence of ammonium chloride for 16 hrs. (E) MFI of Mitosox in control (n = 6) or ammonium chloride treated activated Treg cells (n = 5) (***P = 0.0007). One representative experiment of three is depicted. (F) pH2Ax (***P < 0.0001) and caspase 3 (***P < 0.0001) puncta/cell. (G) CD4+Foxp3+ Treg cells isolated from LNs of naïve Foxp3gp.KI mice were in vitro cultured with IL-2 in the presence or absence of ammonium chloride for 16 hrs. Treg cells were then washed and co-cultured with cell trace violet (CTV) labeled CD4+Foxp3- responder T cells in the presence of aCD3/aCD28 beads. Suppressive activity of Treg cells was measured 96h later. Flow cytometric analysis of CTV dilution and CD25 expression. Division index of CD4+Foxp3- cells (n = 6 mice per group ***P < 0.0001) is depicted. Results are presented as mean ± SEM. Statistical significance was obtained by unpaired Student’s t-test. See also Figure S5.
Figure 7
Figure 7. Scavenging of mtROS in Treg cells attenuates the DDR response, reverses Treg cell death and ameliorates Th1 and Th17 autoimmune responses.
For A-D CD4+Foxp3+ Treg cells were isolated from dLNs of naïve or pre-diseased Foxp3gfp.KI mice treated with or without MT. (A) Caspase-3 and pH2AX (***P < 0.0001) puncta/cell measured by immunofluorescence confocal microscopy, in Treg cells isolated from dLNs of untreated (n = 4) or MT treated (n = 4) pre-diseased mice. One representative experiment of three. (B) Lamp-1 (*P = 0.0223, ***P < 0.0001), p62 (**P = 0.0029, ***P < 0.0001), Rab7 (**P = 0.0017, ***P = 0.0005, ***P < 0.0001) and CathD (***P < 0.0001) puncta/cell measured by IF are depicted (n = 4 mice per group). One representative experiment of three. (C) Mean clinical score (*P = 0.0152, *P = 0.0160) and EAE severity (*P = 0.0160) from diseased mice treated with (n = 6) or without MT (n = 4). Representative H&E sections and score from spinal cords of control diseased (clinical score 4) and diseased mice treated with mitotempo (clinical score 1.5) at 14d post immunization (p.i.) (n = 8 mice per group, ***P = 0.0004). One representative experiment of two is depicted. (D) Flow cytometric analysis and frequencies of CD4+IL-17+ Th17 cells (*P = 0.0456) and CD4+IFNγ+ Th1 cells (*P = 0.0151) in spinal cords of diseased (clinical score 4) and diseased mice treated with MT (clinical score 1.5) at 14d post-immunization (p.i.). One representative experiment on two is depicted. (E) dLN cells were isolated from (7-9 weeks old) Mog35-55/CFA immunized Atg5AFoxp3 (denoted as pre-diseased Atg5AFoxp3) mice treated or not with MT, 9d p.i. (n = 8 mice per group) and cultured in the presence or absence of Mog35-55 peptide for 48hrs. IFNγ (**P = 0.036) and IL-17 (*P = 0.0101) measured by ELISA in the supernatants. For F-I CD4+Foxp3+ Treg cells were isolated from dLNs of Mog35-55/CFA immunized mCATFoxp3 mice, over-expressing the antioxidant enzyme mCAT in their Treg cell compartment, 9d p.i. (n = 4 mice per group). One representative experiment of two is depicted. (F) Immunofluorescence confocal microscopy for 8-OHDG (red), TOM20 (green) and DAPI (blue). Representative fields (10 μm scale bar). Pearson correlation analysis for colocalization efficiency of 8-OHDG and TOM20 (****p < 0.0001). (G) Immunofluorescence confocal microscopy for pH2Ax (red), caspase 3 (green) and DAPI (blue). pH2AX (***P < 0.0001) puncta/cell. (H) Frequency of 7AAD+CD4+Foxp3+ Treg cells (*P = 0.0452). (I) dLN cells were isolated and cultured in the presence or absence of Mog35-55 peptide for 48hrs. IFNγ (**P = 0.0041) and IL-17 (*P = 0.0163) measured by ELISA in the supernatants (n = 6 mice per group). Results are presented as mean ± SEM. Statistical significance was obtained by One-way ANOVA or unpaired Student’s t-test. See also Figure S6.

Comment in

References

    1. Alissafi T, Banos A, Boon L, Sparwasser T, Ghigo A, Wing K, Vassilopoulos D, Boumpas D, Chavakis T, Cadwell K, Verginis P. Tregs restrain dendritic cell autophagy to ameliorate autoimmunity. J Clin Invest. 2017;727:2789–2804. - PMC - PubMed
    1. Alissafi T, Hatzioannou A, Ioannou M, Sparwasser T, Grun JR, Grutzkau A, Verginis P. De novo-induced self-antigen-specific Foxp3+ regulatory T cells impair the accumulation of inflammatory dendritic cells in draining lymph nodes. J Immunol. 2015;194:5812–5824. - PubMed
    1. Alissafi T, Hatzioannou A, Mintzas K, Barouni RM, Banos A, Sormendi S, Polyzos A, Xilouri M, Wielockx B, Gogas H, Verginis P. Autophagy orchestrates the regulatory program of tumor-associated myeloid-derived suppressor cells. J Clin Invest. 2018;128:3840–3852. - PMC - PubMed
    1. Anders S, Pyl PT, Huber W. HTSeq--a Python framework to work with high-throughput sequencing data. Bioinformatics. 2015;31:166–169. - PMC - PubMed
    1. Angelin A, Gil-de-Gomez L, Dahiya S, Jiao J, Guo L, Levine MH, Wang Z, Quinn WJ, 3rd, Kopinski PK, Wang L, et al. Foxp3 Reprograms T Cell Metabolism to Function in Low-Glucose, High-Lactate Environments. Cell Metab. 2017;25:1282–1293.:e1287. - PMC - PubMed

Publication types

LinkOut - more resources