

The impact of the COVID-19 pandemic on emergency department visits and patient safety in the United States
- PMID: 32738468
- PMCID: PMC7274994
- DOI: 10.1016/j.ajem.2020.06.007
The impact of the COVID-19 pandemic on emergency department visits and patient safety in the United States
Abstract
Background: COVID-19 pandemic effects are still being elucidated. Stay-at-home orders and social distancing compounded with COVID-19 concerns have caused significant disruptions in daily life. One notable effect of these variables may be a change in the number of emergency department (ED) visits. This study aims to investigate the effects of COVID-19 on ED visits, and possible reasons for changes.
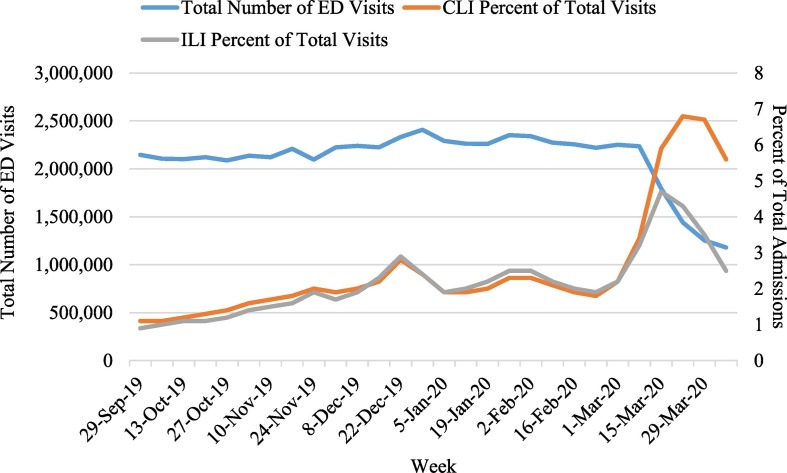
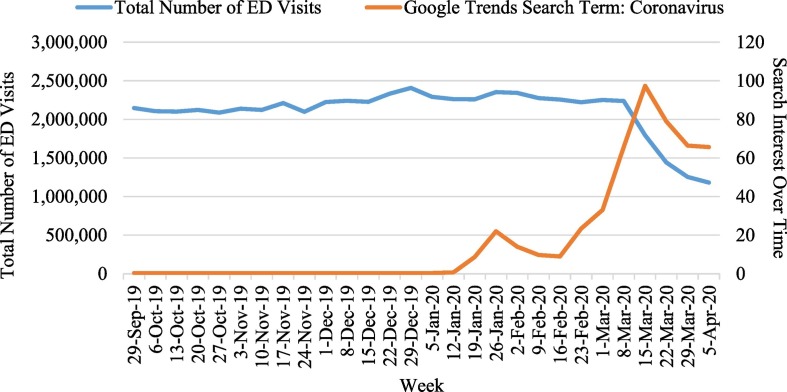
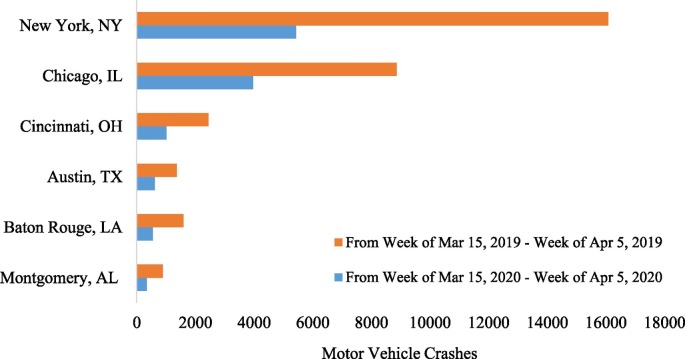
Methods: Retrospective analysis using CDC data for ED visits and percentage of visits for COVID-19-Like Illness (CLI) and Influenza-Like Illness (ILI). Google Trends was used to assess COVID-19 public awareness. Motor vehicle collision (MVC) data was collected from cities, which reported current data. A descriptive statistical analysis and two-sample t-test was performed on ED visit data to assess for significance and a descriptive analysis was conducted to assess COVID-19's impact on MVCs.
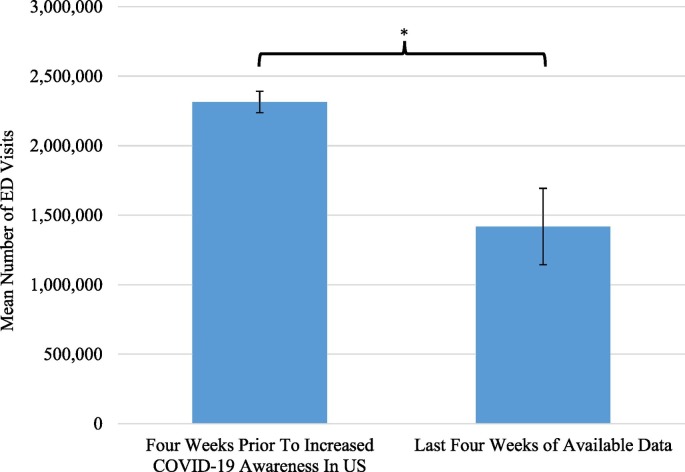
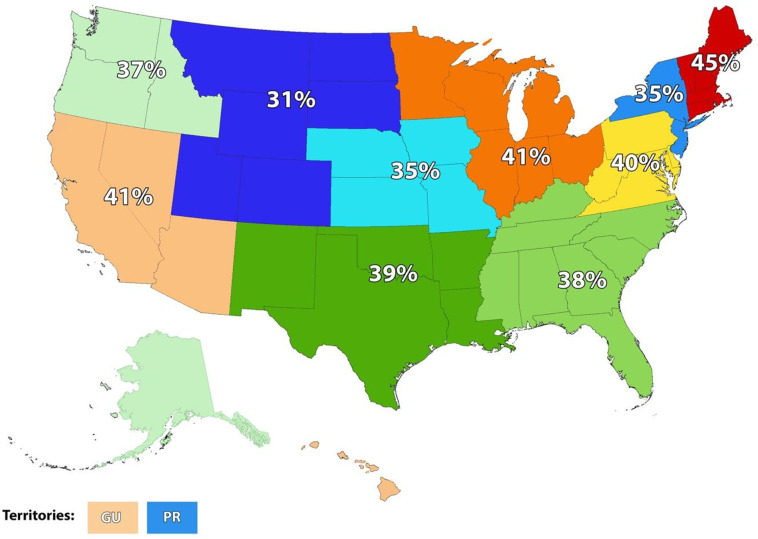
Results: The mean number of ED visits per week for the last four weeks of available data during the pandemic was significantly less than the four weeks prior to COVID-19 pandemic (p = 0.008). The ED visit decrease per week varied by region, with Region 1 having the greatest decrease (45%). MVCs decreased substantially across all cities studied, with New York City and Baton Rouge experiencing the greatest decrease (66%) during the pandemic.
Conclusion: A number of factors have likely contributed to the substantial decrease in ED visits observed in this study. In light of these findings, it is important to raise patient awareness regarding acute conditions that are deadlier than COVID-19 and require immediate medical intervention to ensure recovery.
Keywords: Acute medical conditions; COVID-19 pandemic; Emergency department visits; Medical emergencies; Motor vehicle collisions.
Copyright © 2020 Elsevier Inc. All rights reserved.
Conflict of interest statement
Declaration of competing interest Authors declare no competing interests.
Figures
References
-
- World Health Organization. WHO director-General's opening remarks at the media briefing on COVID-19 - 11 march 2020. World Health Organization. https://www.who.int/dg/speeches/detail/who-director-general-s-opening-re.... Published 2020. Accessed April 19, 2020.
-
- Centers for Disease Control and Prevention. Cases of coronavirus disease (COVID-19) in the U.S. U.S. Department of Health & Human Services. https://www.cdc.gov/coronavirus/2019-ncov/cases-updates/cases-in-us.html. Published 2020. Accessed April 18, 2020.
-
- Gerhold L. 2020. COVID-19: Risk perception and coping strategies.
-
- Parmet W.E., Sinha M.S. Covid-19 — the law and limits of quarantine. New England Journal of Medicine. 2020;382(15):e28. - PubMed
Publication types
MeSH terms
LinkOut - more resources
Full Text Sources
Medical
Research Materials
Miscellaneous
